15.1 Diagnostic Utilities

Mac OS X includes many diagnostic utilities that you can use to monitor your system and investigate problems.

15.1.1 top

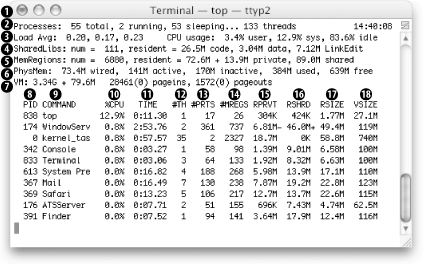
The top utility displays memory statistics and a list of running processes. It is divided into two regions : the top region contains memory statistics, and the bottom region contains details on each process.

You can specify the number of processes to show by supplying a numeric argument. By default, top refreshes its display every second and sorts the list of processes by process ID (PID) in descending order. You can set top to sort by CPU utilization with - u , and you can specify the refresh delay with the - s option. Figure 15-1 shows the output of top -u 10 (if you wanted to refresh the output every 3 seconds, you could run top -s3 -u 10 ).

Figure 15-1. Sample output from top
figs/mug2_1501.gif

Table 15-1 describes the values shown in the top region, and Table 15-2 describes the columns in the bottom region (process information).

Table 15-1. Memory information displayed by top

Item number

Item

Description

 1 
 Processes 

Number of processes and threads. A running process is currently using CPU time, while a sleeping process is not.

 2 
 Load Avg. 

Average system load (the number of jobs vying for the CPU's attention) over the last 1, 5, and 15 minutes.

 3 
 CPU usage 

Breakdown of CPU usage, listing time spent in user mode, kernel ( sys ) mode, and idle time.

 4 
 SharedLibs 

Number of shared libraries in use, along with their memory utilization.

 5 
 MemRegions 

Number of Mach virtual memory regions in use, along with memory utilization details.

 6 
 PhysMem 

Physical memory utilization. Memory that is wired cannot be swapped to disk. active memory is memory that's currently being used, inactive memory is memory that Mac OS X is keeping "on deck" for processes that need it, and free memory is memory that's not being used at all.

 7 
 VM 

Virtual memory statistics, including the total amount of virtual memory allocated (the sum of the VSIZE in the process list), as well as paging activity (data paged in and out of physical memory).


Table 15-2. Process information displayed by top

Item number

Item

Description

 8 
 PID 

Process ID

 9 
 COMMAND 

Program's name

 10 
 %CPU 

Percentage of the CPU that the process is using

 11 
 TIME 

Total amount of CPU time this process has used

 12 
 #TH 

Number of threads in this process

 13 
 #PRTS 

Number of Mach ports

 14 
 #MREGS 

Number of memory registers

 15 
 RPRVT 

Resident private memory

 16 
 RSHRD 

Resident shared memory

 17 
 RSIZE 

Resident memory

 18 
 VSIZE 

Process's total address space, including shared memory


15.1.2 fs_usage

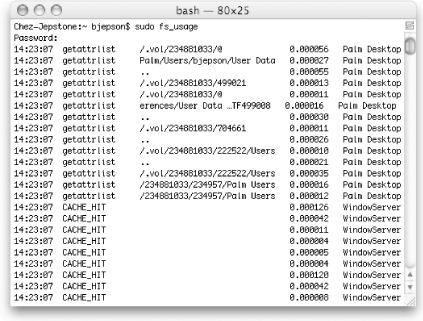
The fs_usage utility shows a continuous display of filesystem- related system calls and page faults. You must run fs_usage as root . By default, it ignores anything originating from fs_usage , Terminal , telnetd , sshd , rlogind , tcsh , csh , or sh .

Figure 15-2 shows the output of fs_usage , which displays the following columns:

  • Timestamp

  • System call

  • Filename

  • Elapsed time

  • Name of the process

Figure 15-2. Monitoring filesystem operations with fs_usage
figs/mug2_1502.gif

15.1.3 latency

latency measures the number of context switches and interrupts, and reports on the resulting delays, updating the display once per second. This utility must be run as root . Example 15-1 shows a portion of its output.

Example 15-1. Partial output from latency
 Tue Dec 30 14:33:41                             0:07:00                      SCHEDULER     INTERRUPTS --------------------------------------------- total_samples           339307         548794 delays <  10 usecs      296044         547403 delays <  20 usecs       17033           1199 delays <  30 usecs        5376            158 delays <  40 usecs        3020             29 delays <  50 usecs        1147              5 delays <  60 usecs         812              0 delays <  70 usecs         497              0 delays <  80 usecs         358              0 delays <  90 usecs         354              0 delays < 100 usecs         308              0 total  < 100 usecs      324949         548794 

The SCHEDULER column lists the number of context switches and the INTERRUPTS column lists the number of interrupts.

15.1.4 sc_usage

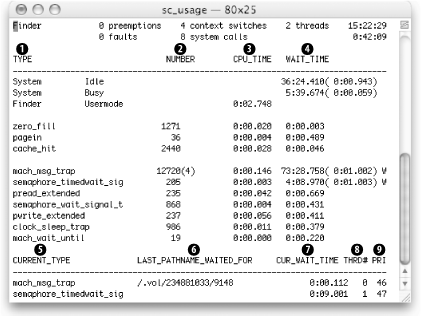
The sc_usage utility samples system calls and page faults, then displays them onscreen. sc_usage must be run by root or by someone with superuser privileges. The display is updated once per second. You must specify a PID, a command name, or a program to execute with the - E switch. For example, to monitor the Finder, use sudo sc_usage Finder . Figure 15-3 shows the output of running sc_usage on the Finder. Table 15-3 explains sc_usage 's output.

Figure 15-3. sc_usage monitoring the Finder
figs/mug2_1503.gif
Table 15-3. Information displayed by sc_usage

Item number

Row

Description

 1 
 TYPE 

System call type

 2 
 NUMBER 

System call count

 3 
 CPU_TIME 

Processor time used by the system call

 4 
 WAIT_TIME 

Absolute time that the process spent waiting

 5 
 CURRENT_TYPE 

Current system call type

 6 
 LAST_PATHNAME_WAITED_FOR 

Last file or directory that resulted in a blocked I/O operation during a system call

 7 
 CUR_WAIT_TIME 

Cumulative time spent blocked

 8 
 THRD# 

Thread ID

 9 
 PRI 

Scheduling priority


15.1.5 vm_stat

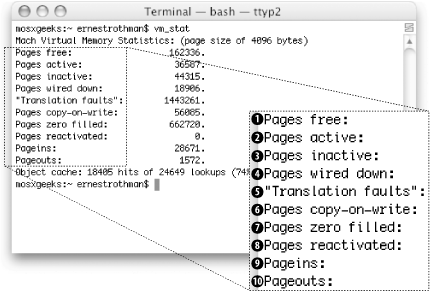
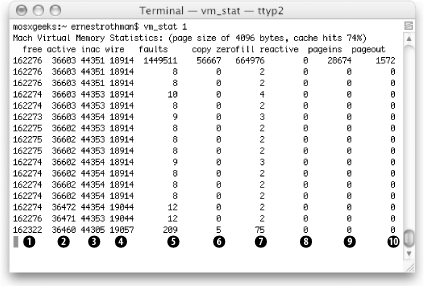
The vm_stat utility displays virtual memory statistics. Unlike implementations of vm_stat in other Unix systems, it does not default to continuous display. Instead, it displays accumulated statistics.

To obtain a continuous display, specify an interval argument (in seconds), as in vm_stat 1 . Figure 15-4 shows the output of vm_stat with no arguments.

Figure 15-4. vm_stat displaying accumulated statistics
figs/mug2_1504.gif

Figure 15-5 shows the output of vm_stat 1 . Table 15-4 describes the information that vm_stat displays (the item numbers correspond to the callouts in both figures).

Figure 15-5. vm_stat's continuous output
figs/mug2_1505.gif
Table 15-4. Information displayed by vm_stat

Item number

Accumulated mode

Continuous mode

Description

 1 
 Pages free 
 free 

Total free pages

 2 
 Pages active 
 active 

Total pages in use that can be paged out

 3 
 Pages inactive 
 inac 

Total inactive pages

 4 
 Pages wired down 
 wire 

Total pages wired into memory (cannot be paged out)

 5 
 Translation Faults 
 faults 

Number of times vm_fault has been called

 6 
 Pages copy-on-write 
 copy 

Number of faults that resulted in a page being copied

 7 
 Pages zero filled 
 zerofill 

Number of pages that have been zero-filled

 8 
 Pages Reactivated 
 reactive 

Number of pages reclassified from inactive to active

 9 
 Pageins 
 pagein 

Number of pages moved into physical memory

 10 
 Pageouts 
 pageout 

Number of pages moved out of physical memory


Mac OS X Panther for Unix Geeks
ISBN: 0596006071
EAN: 2147483647
Year: 2003
Pages: 212

flylib.com © 2008-2017.
If you may any questions please contact us: flylib@qtcs.net