4.1.3 How to look for something specific
|
| < Day Day Up > |
|
Now that you know how to obtain a general overview of your application, it is time to look a little deeper into the results that WSAA generated. For this example we continue to delve into the batch side of the application.
To explore your project in greater detail, continue working on the Project details: Analyze-change results page, and perform the following steps:
-
Click the number (link) next to Batch job in the Run time column. The Impact analysis results: Batch job summary page is displayed, as shown in Figure 4-8.
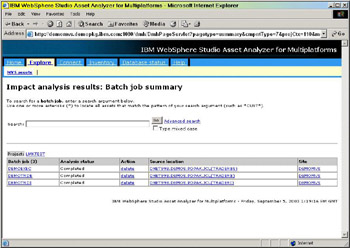
Figure 4-8: Impact analysis results: Batch job summary page -
Click the link, DEMOTRDB (which is the internal name of the batch job for TRADERB). The Impact analysis results: Batch job details page is displayed, as shown in Figure 4-9.
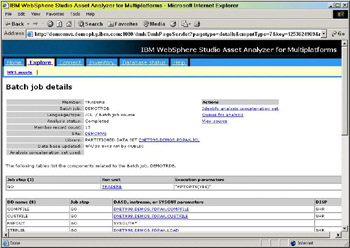
Figure 4-9: Impact analysis results: Batch job details page (part 1)Table 4-1 briefly describes the information that is available in the upper, left-hand portion of this page.
Table 4-1: Batch job details page heading fields Field
Description
Member
The member name of the component as found in the library
Batch job
The internal name of the batch job as derived from the JOB card
Language/type
The language and type of component as determined during the inventory scan
Analysis status
The status of this member as of the last inventory collection or scan
Member record count
The number of lines of code in the member
Site
The name of the organization created when the product was installed
Library
The name of the partitioned data set in which the member resides
Database updated
The date and time when the last scan was completed
Analysis concatenation set used
The name of the concatenation set used to resolve any included components for this member
Most of this information was identified in the inventory collection’s first pass. The information displayed on the bottom portion of the page was generated during the second pass. 3.6.3, “What happens during a scan” on page 92 describes these events.
You can click any of the links to obtain additional, detailed information about the component.
-
Scroll down the page. You will see a graph of your batch job’s components, as shown in Figure 4-10.
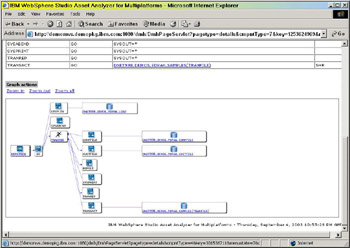
Figure 4-10: Impact analysis results: Batch job details page (part 2)
OK, now this is getting even better! Here you have a clear picture of each component that is used in the batch job, DEMOTRDB.
We provide you with a more detailed description of the contents of this diagram in 4.2.1, “Visual relationships” on page 132.
You can click the components represented in the graph to drill down to the information they represent.
The information contained within the program (what WSAA classifies as a “run unit”) TRADERB, is described in detail in Chapter 5, “Working with your inventory” on page 139.
Additional considerations
You have just seen how easy it is to find detailed information about a batch job. The graphical depiction lets you see the DD names, the actual files, and any called subroutines. Now imagine how excited your application development team is going to be when they can use the power of a visual tool to help them get their work done. Think of the ease with which new developers on your team can grasp the core processing of your application.
How many legacy applications do you have that need to be maintained or enhanced? How many new projects do you have that need to interface with other existing legacy applications? WSAA is specifically designed to help you get these projects accomplished quickly and more easily.
That concludes the detailed view of our sample application from the perspective of an application development project manager or group leader.
4.1.4 Reanalyzing a project
One thing we almost overlooked — and we would be remiss if we did not tell you how to do this — is how to determine how your application development team is progressing with their project.
One recommendation we have is to either take a screen print of the analysis report or save the Web page as HTML. This will give you a baseline of what your requirements looked like when you first queried the database.
Later, after your project is underway, you can track how items are moving through your source change management (SCM) system, by reanalyzing your project.
To do that, click Explore -> MVS assets and enter the name of your project in the Search field. We did that for our WSAA Redbook project 1 by entering WSAA*. The Project summary page is displayed with the search results, as shown in Figure 4-11.
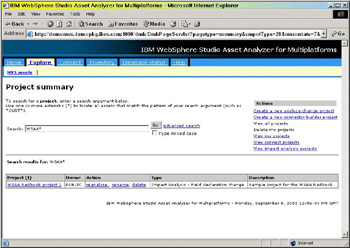
Figure 4-11: Project summary page, with search results displayed
Click reanalyze under the Action column to obtain an updated (that is, current) view of your project. Now, you can once again save the results and compare them to your baseline.
|
| < Day Day Up > |
|
EAN: 2147483647
Pages: 84