Integrated Testing
Integrated Testing
One of the greatest benefits in Visual Studio 2005 Team System is the addition of integrated testing. Testing has steadily grown more popular over the past few years, and an increasing number of developers are using a development methodology that encourages the strict use of testing.
Visual Studio 2005 Team System provides numerous testing support pieces for the developer. First and foremost is the integrated unit-testing capabilities. Unit tests allow developers to create code that will be used to test the quality and completeness of their production code. Visual Studio 2005 Team System can create unit-test skeletons and test projects with only a few mouse clicks or keystrokes.
The ability to generate unit tests isn't the only testing feature available in Visual Studio 2005 Team System, however. You can also run a suite of unit tests while looking to see the amount of code that is covered by those tests. This process is referred to as code coverage testing, and it allows you to see, by line, which areas of the code were tested by the unit tests that were run and which weren't.
Static analysis testing is also available. Static analysis tests allow a developer to analyze his or her compiled code for common errors and poor programming practices. For Microsoft .NET developers using Microsoft Visual Studio .NET 2003, static analysis testing has been done by using a plug-in such as FxCop to perform static analysis on the code. The ability to do static analysis is now built into Team Edition for Developers, allowing developers to quickly and easily get concrete recommendations for improving code with a minimum of effort.
Finally, developers are able to profile their code for performance. Profiling allows them to see where their application is spending the majority of its time, determine how long methods are taking to execute, and identify performance bottlenecks in their application.
Test-Driven Development
One of the primary development trends in testing is the use of Test-Driven Development (TDD). TDD puts testing front and center in any development methodology. In fact, in TDD, unit tests (explained in further detail later) are developed to test the functionality of a piece of code before that code is actually written. This process has several benefits, including confidence in the condition of your code, ease of refactoring, reduction in the amount of time spent debugging, and the uncovering of flaws in the architectural design of the system. There are many other benefits to TDD, and I highly recommend learning more about it if you plan on doing professional code development.
When developers are first exposed to TDD, they often balk at implementing it, thinking that it's an incredible waste of time to write all those unit tests just to test a simple piece of functionality. However, the benefits of TDD often quickly overcome the initial resistance.
For me, the most important benefit is confidence—confidence in your code. When you have a suite of unit tests that effectively test your code, you can be confident that your code will compile and run with a very low likelihood of errors. Thus, when a customer asks to see a demonstration of the code in its current state, you don't need to spend hours running through your code checking out possible locations for errors and fearing that something might go wrong. Instead, you can simply run the suite of unit tests against your code, ensuring all of them pass. When they do, the code can be compiled and demonstrated or delivered.
Another major benefit to TDD is the ability to confidently refactor code. Refactoring involves changing existing code to improve its design. Try as we might to create loosely coupled code, in any nontrivial software development project there will always exist strongly coupled objects or methods. This strong coupling can make it extremely dangerous to change the structure of the code, because a change in one area of the code can affect another area. At times, these effects aren't entirely clear and might not be caught in compile-time checks. Thus, many developers avoid making clear improvements in their code for fear it will break the fragile structure that has been built. With a suite of unit tests that cover the code, refactoring can be done with confidence. If some area of the code is affected by the change, it will fail the unit tests when the suite is run. By examining the unit test that failed, the developer can find exactly where the problem exists, and either roll back their refactoring or make a change in the affected code.
Another enormous benefit is the drastic reduction in time spent debugging. Granted, as a developer using TDD, you'll have spent a good deal of time building unit tests; however, much of that time is compensated by the reduction in debug time. It's said that developers spend 60 percent of their time in design, 30 percent of their time in development, and 80 percent of their time debugging. Although this is said tongue in cheek, that sentence holds some truth for many developers. Debugging always takes far more time than originally planned, regardless of the complexity of the code. TDD reduces (although it doesn't eliminate) the time spent in debugging. It does this by clearly indicating the location of a problem. If a test suite has been developed and the code has been run and has failed, the location of that failure is immediately apparent. All you need to do is visually examine the results of the unit tests. The failed ones will be highlighted in red. Because a single unit test covers only a relatively small piece of functionality, the location of the error becomes almost immediately apparent. And because a unit test is testing a single path through the code, you also know the nature of the failure. This amount of information is critical to quickly fixing the code. Many developers I've talked with say that the debugging tools they used so heavily in the past are now rarely used. It's easier to determine the exact nature and location of a code failure by looking at a failed unit test than it is by stepping through code in a debugger.
Finally, an often overlooked benefit of TDD and unit tests in general is that they can reveal flaws in the architecture of the system. Some unit tests can admittedly be difficult to write, but if a unit test requires a lot of thought to design so that it works properly, that might be an indication of poor design. Quite often, difficult unit tests reveal tight coupling between elements of a design. This tight coupling might be intentional, but in most cases it reveals poor design. The code and the design can then be refactored. And because you already have a suite of unit tests, you can refactor with confidence. Thus, TDD can assist in the design of a system rather than just testing the system.
There are a few best practices for using TDD. The first is the mantra “red/green/refactor,” which defines the steps to developing a piece of functionality. If you write a test designed to fail and run it, it should fail. That's the red. You then write just enough code to make the test pass, which earns it a green designation when it passes. Finally, you refactor your code to clean it up prior to moving to the next piece of functionality. Another good practice is to ensure that all your test cases for a particular piece of functionality encapsulate the requirements of the code. That is, there shouldn't be any explicit requirements for a piece of code that aren't checked by the unit tests. That doesn't mean, however, that you must write unit tests to test trivial code. For example, simple properties that contain no validation logic do not normally need to be unit tested.
Unit Testing
To build clean, well-structured code, the developer needs some mechanism to ensure that the code written runs effectively. One solution is for the developer to write a piece of code and then run the application to see whether it works the way it should. The developer then moves on to the next piece of code, never coming back to test that functionality until it's close to the release date. You probably know someone who codes like this. And you might even be guilty of it yourself! Unit tests are a way to automate that method of testing so that the tests can be run repeatedly as the product is developed.
Unit tests involve designing a series of test cases that test whether the business logic is functioning correctly and whether inputs produce the expected outputs. To be complete, many unit tests might test the same piece of function code to ensure that all the branches and internal code flow are tested. We'll see how Visual Studio solves this problem when we talk about code coverage later. Because unit tests test basic functionality at the method level, they are considered to be a developer's responsibility and not the responsibility of the testing staff.
The support for unit testing runs deep in Team System and it gives developers the ability to quickly generate unit tests and unit test projects directly from a code skeleton. It's as simple as right-clicking a method and selecting Create Tests. (See Figure 6-14.) A test project is created, and a fully built skeleton of a unit test is generated for you. The unit test will be set up to return Inconclusive, and all the appropriate inputs and outputs are generated. You can then add the test code that will be used to test the functionality of your code. Often you'll need to create several unit tests to test one method. This is generally done by copying and pasting the previously created unit test. Although this frustrates many developers—specifically, those who believe Team System should automatically generate a larger number of unit tests—remember that a great deal of overlap often exists between two unit tests that test the same piece of code. Thus, one test can be fleshed out completely, and a copy/paste/edit of that test will often result in far less effort than editing a newly created skeleton.
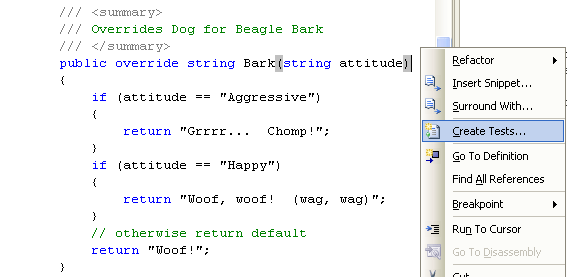
Figure 6-14 Creating a unit test from code
Once you've selected to build a unit test, a wizard guides you through the remaining steps. You can select which tests you'd like to generate, as well as which language the test project should be created in. (See Figure 6-15.) If you want, you can also change the defaults by clicking the Settings button. Doing this allows you to change how the projects and tests are created and named. (See Figure 6-16.)
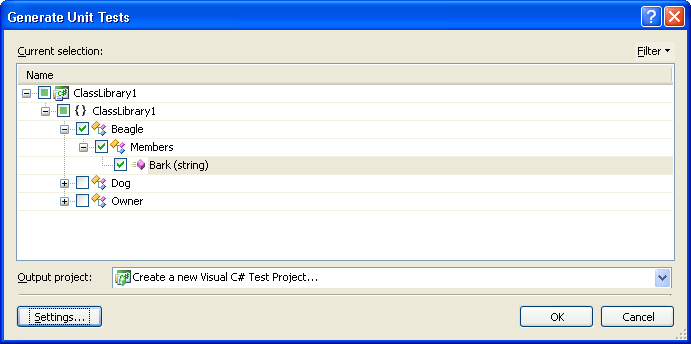
Figure 6-15 Generating unit tests for class members
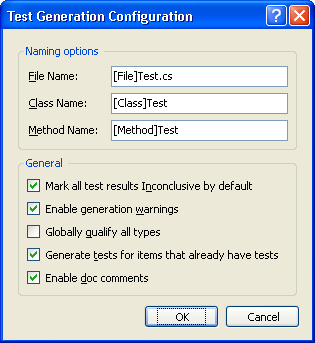
Figure 6-16 Configuring default unit test options
Once the unit tests have been generated, they can be edited to test for the desired functionality. Figure 6-17 shows a completed unit test for the Bark method on the Beagle class.
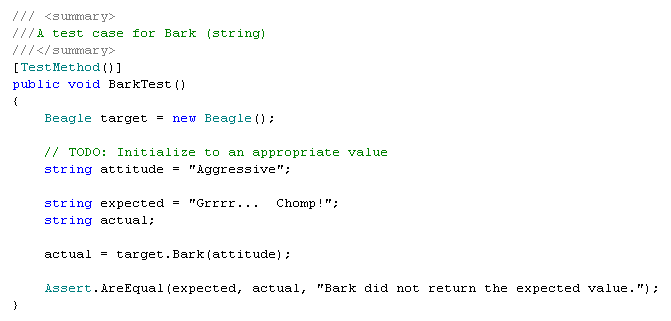
Figure 6-17 The completed unit test on the Bark method
Finally, the unit tests are executed. This is done either in the Test Manager window or the Test View window. Both windows can be seen in Figure 6-18. From either of these windows, you can execute selected unit tests. In addition, the Test Manager window allows you to create groupings of tests that should be run together.
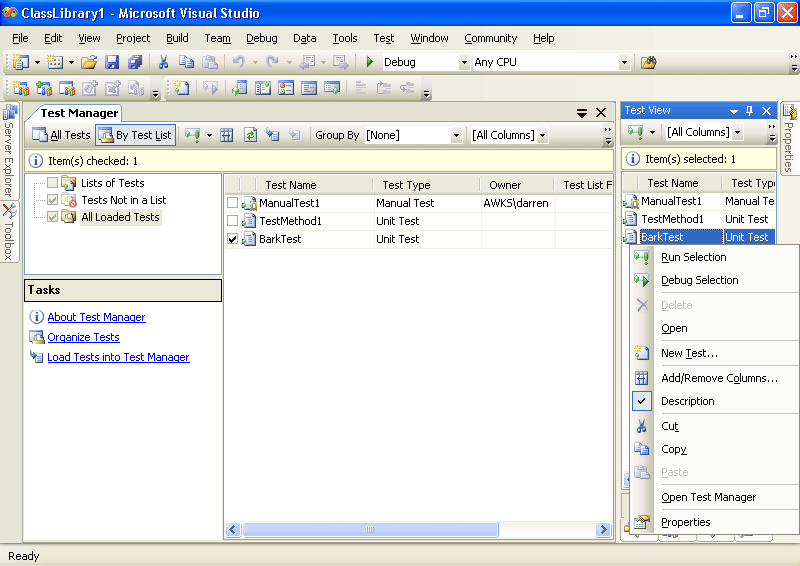
Figure 6-18 The unit Test Manager and Test View windows
Finally, when you've executed the tests, the Test Results window pops up and shows you the results of your test. (See Figure 6-19.) Hopefully, all your tests will have passed after you have built the code to implement those tests. Don't forget that although we demonstrated building tests for code that already existed, it's a best practice in TDD to build tests first for just the code skeleton and then actually implement the code.
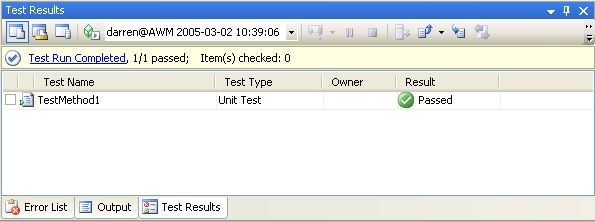
Figure 6-19 Unit test results—passed!
Code Coverage
Writing unit tests is a critical tool for creating solid, quality code. However, developers need one additional tool to be sure that enough unit tests have been written. The code coverage tool built in to Team System provides a simple method to verify that the created unit tests are testing as much of the code as possible.
One of the nicest features of using the code coverage tool is that it demonstrates dramatically which areas of your code were not covered by the unit tests. After looking at the statistics that show how much code was covered, you can simply open the text view of your code to see every uncovered line highlighted in red and every line of code that was executed by a unit test highlighted in green. It's not just the complete methods that show up in red or green. The code coverage tool will highlight un-followed paths through the code inside of a method as well. For instance, you might test a path through an if statement but fail to test the path through the else portion. It will also highlight try-catch blocks that were not tested.
TIP
The red and green code coverage indicators provide immediate and dramatic feedback. Reports are also important, in that they summarize the information on a broader scope and can provide even more useful information.
To run the test, ensure that code coverage is enabled for the DLL you want to test. You can do this by editing your current test run configuration file, which you'll find in Solution Explorer. Once code coverage is enabled, you can re-execute your unit tests to show how much of your code was covered. The Code Coverage window gives a summary of the results.
Once you've run your tests, you can also look at the code directly. The code covered by our single unit test will be only the first few lines and will be highlighted in green. The remaining code in the Bark method will be highlighted in red and is therefore not covered by our current set of unit tests.
Code coverage is a very useful tool; however, be aware that although a line of code is covered by a test, the test isn't necessarily sufficient to fully stress the code. For instance, you might have a unit test that tests an AbsoluteValue function that passes in a positive integer. This test would cover the code, but it would not test for a case in which a negative integer was passed in! Make sure that the tests you've written not only cover the code, but test all the required functionality of the solution as well.
NOTE
Load testing is another type of test, specifically for the testers in your organization. These types of tests can be used to stress test your unit tests. You will learn more about this kind of test in Chapter 7.
Static Analysis
Creating quality code often involves analyzing code for known defects. In Visual Studio 2005 Team System, this is done through the use of static analysis. The static analysis tool found in Team System that analyzes .NET code is an evolution of FxCop. The static code analyzer runs against compiled code, looking for a large number of known defects and poor programming practices. In addition, it can be used to enforce corporate naming conventions.
The rules used by the static analyzer are fully extensible, and it's possible to add a new rule relatively quickly. It's also possible to enable and disable rules that will be run against the code. For instance, you might choose not to run the rules that enforce naming conventions but be very interested in the results of the tests that check for known security issues. Finally, you can choose whether a violation of a rule generates a warning or a compile time error. For coding conventions that absolutely must not be violated, using an error is the best practice and is one of the easiest to implement. Setting a violation of code analysis to an error, coupled with the built-in check-in policy that prevents code from being checked in unless it has compiled without error, result in an easy-to-implement yet very powerful technique for guaranteeing a certain level of code quality.
To use static analysis, it must first be enabled. It is enabled in the Project Properties window, under the Code Analysis tab. (See Figure 6-20.) Notice that you can enable and disable rule categories or even individual rules.
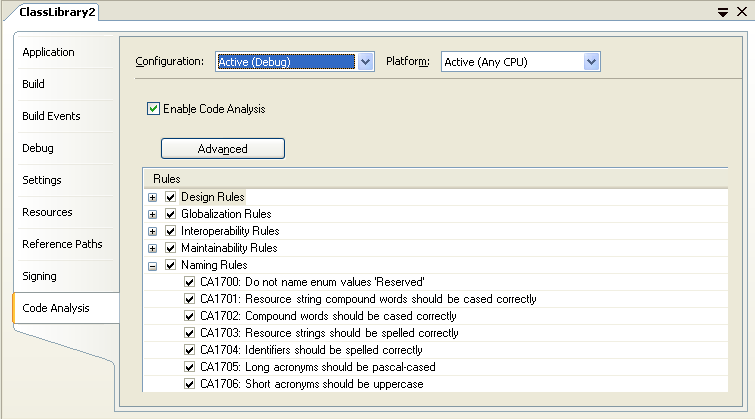
Figure 6-20 Configuring static analysis in project properties
Once you have the project set up for code analysis, all you need to do is recompile your application. This will cause the static code analyzer to run. The results can then be seen by looking at the Errors window. If a particular line of code caused the error, double-clicking the error in the Error window will open the appropriate code window and bring you to the offending line of code. In addition, the results are saved to CodeAnalysisLog.xml. Opening this file will show all the issues discovered during the compilation. (See Figure 6-21.) You can use this file to compare compilations across time.
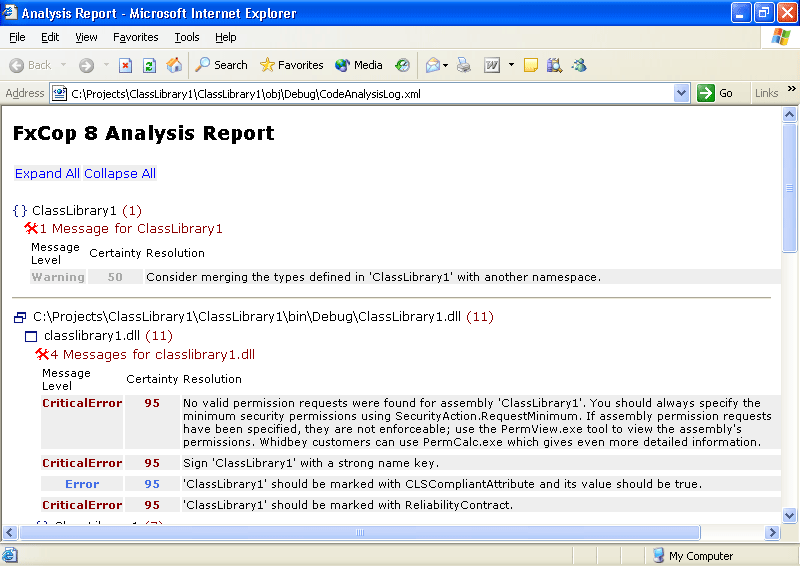
Figure 6-21 Results of the static analysis test
Profiling
After the code has been written, tested, and checked for known defects, it's time to profile your code. Code profiling is the process of analyzing how your code executes and where the majority of time is spent inside your code. Code profiling enables developers to measure the performance of an application and identify performance-related issues in the source code. You might have some relatively small method that is executed so often that the majority of time spent executing your code is spent in that method. Conversely, you might have a large, slow method that is called so infrequently that optimizing the performance of that code is virtually worthless. Determining where to spend valuable development time is critical!
To determine where to spend your time improving your code, you can use one of the two profiling engines built into Visual Studio. The two profiling methods are sampling and instrumentation.
In the sampling method, the profiler interrupts a running application at periodic intervals to determine which function is being executed. The profiler keeps track of the number of times that it was in that function by incrementing a counter. It also looks at the stack trace to determine which functions were called prior to that method. By interrupting the application hundreds, thousands, or millions of times, a statistical view of the application is generated. Although this method is not deterministic, it's a fairly reliable method of determining where an application spends the majority of its time. Once the application is stopped, a report is generated that provides the profile data.
The instrumentation method is more intrusive than the sampling method. In this method, the profiler inserts enter and exit probes into specific functions of an application. These functions are now monitored when the application runs. The probes capture the deterministic performance metrics for the functions. This means that you get information about how long a method takes to execute. This method also provides a relatively complete numeric look at how often various methods are called. Once the application is stopped, a report can be generated based on the data gathered by the instrumentation profiler.
Determining which profiling engine to use is somewhat of an art, but there are good rules of thumb. The sampling method is far less intrusive than the instrumentation method, and thus allows the application to run at more normal speeds. It doesn't, however, provide a complete look at the data. For instance, although you can see how often the code appears inside a particular method, you cannot determine how long that particular piece of code takes to execute. Thus, the sampling method is often used as a first look at an application. With it, a developer can quickly determine where to focus attention in the short term.
The instrumentation profiles, on the other hand, provide for very specific performance metrics. However, this is very intrusive. This makes it appear as though the application is crawling when it is executed. Therefore, this method takes much longer to run enough functionality to fully profile the application. Thus, you'll generally use the instrumentation profiler at fewer intervals than the sampling profiler. However, the instrumentation profiler provides more specific and reliable information than the sampling method, and thus is an excellent tool to use at critical intervals during the development process.
Load testing should also be mentioned. It's somewhat related to profiling in that it deals with software performance. Load testing can also determine when an application might see a serious degradation of performance, or break altogether due to a peak number of requests per second or total number of users. This is highly useful for capacity planning, especially when a project starts to get popular with the users. In load testing, a developer tests the performance of an application when it's stressed by the expected average number and expected peak numbers of users. This form of testing is not available in Team Edition for Developers, only in the Team Edition for Testers and Team Suite editions of Visual Studio 2005 Team System.
EAN: 2147483647
Pages: 97