Defining the Market
|
| < Day Day Up > |
|
A successful BI implementation must be driven by business requirements and how well a tool can meet the architectural and functional needs of both IT and business users. However, it's helpful to understand the vendor's position in the marketplace as an indicator of financial stability, product innovation, and ability to drive and conform to industry standards. If you have implemented BusinessObjects at the departmental level and are now looking to deploy it across the enterprise, the company's position as an industry leader makes it easier to justify it as a corporate standard. Further, if your IT department is strapped for resources, Business Objects leadership position gives you greater flexibility in getting assistance from contractors, specialty consulting firms, and big-four management consultants. The sheer number of users means you have many third-party resources available to you, including regional user groups and a user-run discussion group, BOB (http://www.forumtopics.com/busobj/about.php).
As you evaluate market shares and leadership positions, it's important to understand in which context an analyst is speaking of BusinessObjects or its competitors. No two analysts define the market the same way. IDC defines the BI market as revenues from licenses and maintenance fees of query and reporting tools used in either a data warehouse environment or against a transaction system, OLAP, EIS, data mining, or packaged data marts such as SAP BW; it specifically excludes ETL tools and analytic applications. As shown in Figure 1-4, the BI market has grown from less than $1 billion in the early 1990s to close to $5 billion today, according to IDC. At its peak, the market grew at 38 percent per year from 1997 to 1998, but it has slowed significantly, to a meager 2 percent today. While Business Objects' growth has in part been due to general market growth, Figure 1-4 clearly shows that the company's growth has exceeded the market's. Business Objects' peak growth was also in 1997-1998, at 46 percent. However, even in 2002's economic downturn, Business Objects' revenue increased by 9 percent compared to the BI market's meager 2 percent growth and compared to other BI vendors who suffered declining revenues and losses.
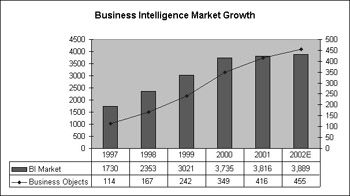
Figure 1-4: Business Objects' growth has outpaced BI market growth.
Since its inception, the BI market has been highly fragmented. Companies that used to operate in only one segment now operate in several, making it harder to determine how much of a company's revenues account for a particular segment share. One thing that is clear is that business intelligence is Business Objects' sole focus. It is not in the businesses of databases, ERPs, or operating systems, unlike other players in the BI space. While such a narrow focus could be a risk for small companies, Business Objects is financially solid. Its revenues for fiscal year 2002 were $454,800, comparable only to that of chief competitor Cognos and more than double the revenue of other BI-focused companies. While IDC does not publish exact market positions, it cites Business Objects as one of the top three, along with SAS and Cognos.
The sections that follow describe some of the main market segments. Figure 1-5 shows how some of the market segments relate to components of a BusinessObjects architecture.
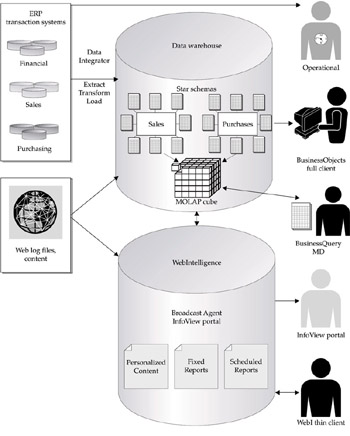
Figure 1-5: Business intelligence architecture
Extract Transform Load (ETL)
Extract Transform Load (ETL) tools used to be a distinct tool set. Their job was to take the data from the source ERP or transaction system and then to cleanse and aggregate it to load in a data warehouse or data mart. Simply getting the data into a cube or RDBMS does not in itself provide business value. As business users attempt to answer questions with the data, often the ETL process changes, either to extract more data or to add robust business calculations. A tight integration between the ETL tool and end-user analysis has the potential to provide better business insight. Further, tired of gluing together products from multiple vendors, companies increasingly look to buy one product set from one vendor. Vendors from both sides of the divide, illustrated in Figure 1-5, have expanded their tool sets. Oracle, traditionally an RDBMS and ERP vendor, offers Oracle Warehouse Builder as its ETL solution. In 1995, the company moved into the BI space with its acquisition of IRI's Express, a leading MOLAP tool and offers Oracle Discoverer, a query and reporting tool. In 1998, Cognos was one of the first major BI vendors to begin offering ETL functionality with DecisionStream. Informatica, long a leader in the ETL segment, began offering its own web-based BI tool, PowerAnalyzer, in 2002. In 2002, Business Objects acquired Acta Technology, another leading ETL vendor, and rebranded the product as BusinessObjects Data Integrator. While most ETL tools allow for scheduled extraction of data from the OLTP into a data warehouse, Data Integrator also facilitates real-time access. As of Q4 2002, sales from Data Integrator account for less than 5 percent of Business Objects' overall revenues but have been higher than expected. With Informatica and Business Objects both encroaching on one another's core market segments, there is bound to be some friction. However, Business Objects consistently claims it will continue to support integration with third-party ETL vendors such as Ascential and Informatica. Its goals for acquiring Acta were to offer a complete solution for companies that want to buy from one vendor and to provide turnkey analytic applications.
Query and Reporting
Query and reporting is the process of querying a database, then formatting it for readability and analysis. This is the segment in which Business Objects initially was launched and its origins help explain why its SQL generation is so robust. Within query and reporting, users may query a data mart or a data warehouse, or they may query a transaction system. Some industry analysts would say the latter is not really BI, it is simply operational reporting. Recall, though, that the purpose of BI is to explore and analyze data to improve profitability or manage costs. Companies can do this with summary data (data warehouse) or detail data (transaction system). Many mid-sized and small companies may not have the skills, budget, or time to implement a data warehouse. The robust functionality of BusinessObjects along with smaller data volumes allow these companies to accomplish BI directly against the transaction system. Further, ERP vendors are satisfying their users' demand for real-time, flexible reporting and analysis by embedding BI products into the ERP. For example, i2 and PeopleSoft embed BusinessObjects into their products.
Some define 'reporting' as the process of formatting a report to enable analysis, while others define reporting as the delivery and distribution of standard reports throughout an organization. This latter definition would encompass Broadcast Agent and Broadcast Agent Publisher. In 1992, Business Objects was one of the first companies to have a repository that allowed users to store standard reports. Over time, this repository has grown to accommodate standard reports grouped by departments and navigatable by categories and subcategories.
On Line Analytical Processing (OLAP)
Many BI vendors provide both query and reporting solutions as well as an OLAP tool. Some BI vendors provide it via one integrated product; others offer separate products. For example, Oracle Express is a MOLAP database; whereas Oracle Discoverer is a query and reporting tool; Cognos Powerplay is a MOLAP database, while Cognos Impromptu is a query and reporting tool. Business Objects provides query, reporting, and OLAP in one tool set, generating a dynamic microcube with each query that can reside on the desktop or the mid-tier server. BusinessObjects can also access server- based MOLAP and ROLAP cubes.
In its broadest sense, OLAP provides multidimensional analysis with different dimensions and different levels of detail. Functions such as drill-down, rotate, and swap are OLAP functions. OLAP, though, has some clear definitions set forth by E.F. Codd (the father of the RDBMS) in 1993. Arbor Software, the original makers of Essbase, later acquired by Hyperion, hired Codd to bring clarity to how Essbase was different from then-competing EISs. OLAP itself can be further divided into different approaches, either relational (ROLAP), multidimensional (MOLAP), or desktop (DOLAP). These approaches differ in where the aggregations, calculations, and processing are performed. The following table compares some of the vendors and their different approaches to OLAP:
| Architecture | Primary Difference | Vendor |
|---|---|---|
| ROLAP | Calculations done in a relational database. | MicroStrategy, IBM DB2 OLAP. Microsoft Analysis Services can also act as ROLAP but most often uses MOLAP |
| MOLAP | Calculations performed in a server-based multidimensional database. Cubes provide write- access for inputting budget data or performing what-if analysis. | Hyperion Essbase, Cognos Powerplay, Oracle Express, MicroSoft Analysis Services |
| DOLAP | Calculations performed on the desktop or Web midtier to build a microcube. Cubes are read-only. | BusinessObjects/WebIntelligence (WebI) |
Data Mining
Data mining is a particular kind of analysis that discovers patterns in data using specific algorithms. Whereas standard query and reporting tools require you to ask a specific question, data mining does not. A famous data mining discovery is that beer and diaper sales are closely correlated; a standard query tool would force a user to ask a more precise question such as, 'what do beer consumers purchase in the same store visit?' Data mining is used in predictive analysis, fraud detection, customer scoring, and so on. Business Objects previously sold Business Miner, which used a decision tree algorithm to enable users to mine results from a standard query; this product was discontinued at the end of 2002. With Application Foundation 3.0, released in July 2002, the company embedding stronger mining capabilities from a third-party data mining company, KXEN. Results from other data mining packages, such as SAS and IBM, can also be passed to Application Foundation.
Analytic Applications
Henry Morris of International Data Corporation (IDC) coined the term analytic application. For software to be considered an analytic application, it must have the following characteristics:
-
It must function independently of the transaction or source systems.
-
It must extract, transform, and integrate data from multiple sources and allow for time-based analysis.
-
It must automate a group of tasks related to optimizing particular business processes.
The hype around analytic applications has muddied the waters for BI vendors, and each has taken a slightly different approach.
With Application Foundation, Business Objects provides a development platform for companies to build their own analytic applications and management dashboards, specifying their own process rules and best practices. Although analysts like to refer to this as the 'build versus buy' approach, I hesitate to use the term 'build,' as it is reminiscent of developing an application from scratch, coding in a programming language. The 'build' approach with analytic applications is more like a 'customize' approach in which developers choose objects and templates that generate underlying code. With Application Foundation, the 'customized' applications still use the universe, BusinessObjects and WebI report engines to deliver the functionality. In addition, Application Foundation has five integrated analytic engines (Segmentation, Metrics, Rules and Alerts, Predictive, and Statistical Process Control) that allow for more sophisticated analysis.
IDC's Dan Vesset sees the 'build' or 'customize' strategy as a good one for BI vendors. He explains that analytic applications require a different selling process than straightforward BI tools, requiring much more process- and business-specific knowledge, and are sold directly to the business users. On the other hand, BI tools require less process- specific knowledge and are sold most often to IT. Frank Sparacino of First Analysis, a financial analyst who tracks the BI market for investors, believes 'the pursuit of both strategies (buy and build) creates a number of inherent conflicts-for instance, in channel strategy and R&D focus that ultimately limit success.... Business Objects gives a greater focus-the right decision in our mind-on the build option.' In 2002, Wayne Eckerson, Research Director for The Data Warehouse Institute, found that 62 percent of surveyed companies plan to build analytic applications, versus 34 percent who plan to buy. The biggest justification for building versus buying an analytic application is to obtain functionality (84 percent) that may not be available in a built application.
In addition to Application Foundation, Business Objects sells four analytic applications (the 'buy' approach), all built with Application Foundation: Customer Intelligence, Product and Service Intelligence, Supply Chain Intelligence, and Operations Intelligence. A primary difference between these applications and applications from vendors that provide a buy-only approach is that Application Foundation allows customers to further customize the applications.
|
| < Day Day Up > |
|
EAN: 2147483647
Pages: 206