Logging the Debug Statements
| < Day Day Up > |
| Debug statements provide a way for the developer to log important information while a driver executes. In order to log the messages, you need a debug message capturing tool. A useful tool for capturing debug statements is called Debug View, and is available from www.sysinternals.com. This tool is free. Debug statements can be used to print tombstones, markers to indicate that particular lines of code have executed. Using debug statements can sometimes be easier than using a single-step debugger like SoftIce or WinDbg. This is because running a tool to capture debug statements is very easy, while configuring and using a debugger is complex. With debug statements, return codes can be printed or error conditions detailed. Figure 2-2 shows an example of a call-hooking rootkit sending debug output to the system. Figure 2-2. DebugView captures output from a kernel rootkit.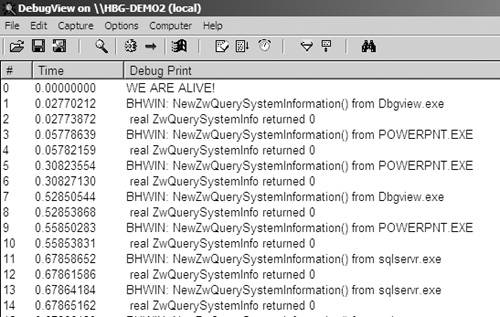 You can print debug statements with Windows drivers by using the following call: DbgPrint("some string"); Many debug or kernel-level logging functions such as DbgPrint are available with most operating systems. For example, under Linux, a loadable module can use the printk(...) function. |
| < Day Day Up > |
EAN: 2147483647
Pages: 111