Using Alerts in Performance Monitor
|
|
Performance Monitor has configurable thresholds that, when reached, will trigger a response. This allows you to monitor the health of a server, letting you know if something is amiss.
Here's how to create an alert:
-
In the Performance Monitor, click Alerts in the left pane under Performance Logs and Alerts.
-
Choose Action | New Alert Settings.
-
In the New Alert Settings window, type in the name of the alert settings you wish to create-this is a friendly name.
-
Click OK.
-
After you click OK, the Properties window will open. Use the three tabs (General, Action, and Schedule) of the Properties window to configure the alerts you wish to create.
The General Tab
The General tab, shown in Figure 20-6, allows you to choose which counters you want to monitor and set the threshold. You can select specific counters from an object to monitor here.
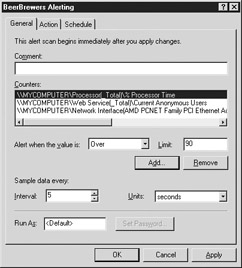
Figure 20-6: The Alerting General tab
Comment Type a description for this counter. This is a friendly name, so type in a name that will help you remember this counter later.
Counters View the counters that have been selected and to which instance that each counter applies, if applicable.
Alert When The Value Is Over/Under Limit Configure the threshold for this counter. For example, for the % Processor Time, you can choose to alert when the value is larger than a certain percentage, such as 90 percent. When this threshold is reached, the action specified on the Action tab is triggered. This threshold is a one-time trigger, rather than occurring over a specific time period. If the processor utilization reaches 90 percent just once, the threshold is triggered. Because of this, processor triggers may not be the best use of the alerting feature, because momentary spikes up to 100 percent are normal. A sustained 100 percent processor, however, would be a good alert trigger.
Sample Data Every Change the interval at which data is collected. At every interval, Performance Monitor queries all the defined performance counters to get their data at that moment.
Run As Specify a user account under which to run the Performance Monitor. This allows Performance Monitor to run regardless of who is logged in.
The Action Tab
The Action tab, shown in Figure 20-7, lets you configure which action is performed when an event is triggered. You can select one or multiple events to perform.
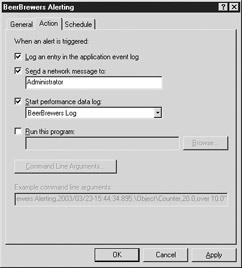
Figure 20-7: The Action tab
Log An Entry in the Application Event Log Writes an event detailing the alert counter, the value that triggered the alert, and the threshold. The source of the event is SysmonLog.
Send A Network Message To Sends a network message using the messenger service to the name you enter in the text field.
Start Performance Data Log Starts the defined log specified in the drop-down box. That log will run until schedule to stop, or until stopped manually.
Run This Program Executes the specified command. You can use this to start a debugger, run a script, send an e-mail, or really do just about anything. The application is started with the command line arguments you specify. A great use of this would be to run a VBSript with some specified arguments, and that VBScript could be written to do just about anything you needed to have done.
Command Line Arguments Click this button to configure which parameters are sent to the application when it is run. Seven arguments are available:
-
Single argument string
-
Date/time
-
Measured value
-
Alert name
-
Counter name
-
Limit value
-
Text message
The Single argument string option puts the string into a comma-separated format, instead of listing each variable individually. The Text message allows you to type in any text you want to send. This is great; since you're configuring the alert, you know what is being triggered and you add in the text message for the variable you need to kick off the VBScript you wrote to fix this issue.
The Schedule Tab
The Schedule tab is used exactly as it is used in the other areas of Performance Monitor. Since it's been covered already, it won't be covered here as well. Turn back a few pages to see the details about the Schedule tab.
|
|
EAN: 2147483647
Pages: 193