Performance Monitoring
|
|
Monitoring the performance of your IIS server is important. You can have the best-written code in the world, but if the server hosting that code is underpowered, you will have performance issues. The Windows Performance Monitor, shown in Figure 20-2, allows you to log data to a file and then crunch that data later to see if you experience performance problems. Windows has more than 50 performance objects you can monitor. Performance Monitor allows you to monitor your system in real-time, generate logs to view later, and generate alerts based on thresholds you set. The counters you'll be most interested in logging for an IIS server are discussed next.
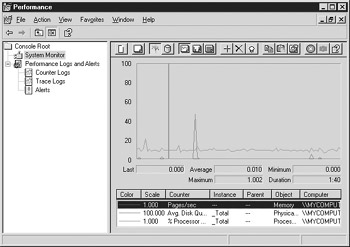
Figure 20-2: Performance Monitor
Active Server Pages The Active Server Pages counters help you count errors in ASP scripts, template caches, various statistics regarding requests, and much more.
FTP Service The FTP Service counters keep track of total bytes, connections broken down by users and logons, and file transfers.
Internet Information Services Global The IIS global counters keep track of such information as binary large objects (BLOBs) and file and URI caching statistics.
Memory The Memory counters keep vital statistics on system memory usage, along with how well paging is performing on the system.
Network Interface The Network Interface counters keep track of the bytes transferred, bandwidth used, and how well packets are being transferred, including errors.
NNTP Commands The Network News Transfer Protocol (NNTP) Commands counters keep statistics on how many of each type of NNTP commands are being received by the server.
NNTP Server The NNTP Server counters keep track of information such as bytes, users, connections, and feed statistics.
Physical Disk The Physical Disk counters keep track of vital statistics on the hard disk data transfers. These statistics can help you determine whether you are becoming I/O bound on the server.
Processor The Processor counters keep track of the percentage of time the processor is working on commands, and which state the processor is in.
Server The Server counters keep statistics on the page file, logon traffic, errors, and more.
SMTP NTFS Store Driver The Simple Mail Transfer Protocol (SMTP) NTFS Store Driver keeps track of the number of messages allocated, deleted, enumerated, and queued.
SMTP Server The SMTP Server object has more than 100 counters to log information on a large number of message statistics.
Web Service The Web Service object has about 85 counters that track all the different types of HTTP requests and errors, CGI/ISAPI requests, and connection statistics.
Web Service Cache The Web Service Cache counters keep track of all the caching statistics for the web server component, including hits and misses for each of the various types of items the web service uses. Most of the counters deal with URI caching.
Real-Time Monitoring
You can monitor your server in real-time using the System Monitor:
-
Open the Performance MMC by choosing Start | Administrative Tools | Performance.
-
Click System Monitor (it should be selected by default).
-
On the toolbar at the top of the monitor, click the plus (+) sign.
-
In the Add Counters dialog box, choose which computer you want to monitor; the default is this computer.
-
Use the drop-down box to choose which Performance object to use.
-
Select the individual counter from the list.
-
If more than one instance is possible (for example, if you have multiple processors), choose the instance you wish to monitor, or choose Total for all the instances.
-
Click Add. The counter will be added, even though the Add Counters dialog box is still active.
-
Repeat steps 3-7 for each counter you wish to add.
-
When you have added all the appropriate counters, click Close.
This will help you to monitor in real-time, but it doesn't give you any long-term information. That is what counter logs are for.
Using Counter Logs
Counter logs allow you to monitor a system over a great length of time and keep the data in log files that you can analyze later. This makes counter logs useful in determining intermittent performance issues. Here's how to set up a counter log:
-
In the Performance MMC, highlight Counter Logs under Performance Logs and Alerts.
-
Choose Action | New Log settings.
-
In the New Log Settings window, type in a name for the log you wish to create.
-
Click OK. The properties window will open.
At this point, you are in the Properties window for this log, which offers three tabs: General, Log Files, and Schedule.
The General Tab
In the General tab, shown in Figure 20-3, you can add objects and counters to this log file, and configure how it gathers data.
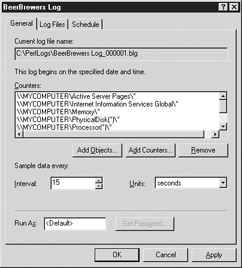
Figure 20-3: The General tab
Objects are the performance objects that Windows has defined. You can add an entire object to the log file, and it will automatically gather data for every counter in that object. It also takes more disk space that way. To add an object, click the Add Objects button, and select all the objects that you wish to monitor in the Add Objects dialog box. When you have added all the objects, click Close.
Counters are individual performance counters that are contained in an object. You can choose to monitor an individual counter, and it will take less disk space. Your log file will not be as detailed as it would be if you monitored the entire object. To add a counter, click the Add Counters button, and in the Add Counters dialog box, select all the counters from the objects that you wish to monitor. When you have added all the counters, click Close.
Typically, if you have the disk space and spare CPU cycles, add objects rather than counters. You can't go back after the fact and gather data on additional counters, so just get the information right up front. If you're after something specific, use the counters; otherwise, use the objects.
The Sample Data Every area allows you to change the interval at which data is collected. At every interval, performance monitor queries all the defined performance counters to get their data at that moment. It then puts that data into the log file. As you might guess, the more often you gather data, the larger your log file will be-and the more detailed your data will be. Choose a time interval that gives you a good balance between size and detail. You can choose any interval between 1 second and 45 days. (Just a tip: 45 days might be a little weak on the detail side of that equation.)
In the Run As text box, you can specify a user account under which to run the Performance Monitor. This allows Performance Monitor to run, regardless of who is logged in.
The Log Files Tab
The Log Files tab, shown in Figure 20-4, allows you to configure the type of file that Performance Monitor will log data to.
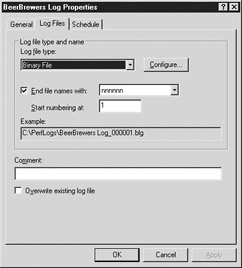
Figure 20-4: The Log Files tab
Your choices are as follows:
-
Text File (Comma Delimited)
-
Text File (Tab Delimited)
-
Binary File
-
Binary Circular File
-
SQL Database
You can also choose how to increment the log files. This is especially helpful when you are logging on a periodic basis. You can choose to append the log file with various forms of the date and time, or just use incremented numbers for each log file. You can also add a log file comment and choose to overwrite existing log files.
The Schedule Tab
The Schedule tab, shown in Figure 20-5, allows you to configure the time period when the log file will collect data.
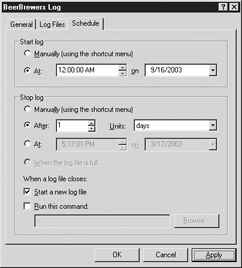
Figure 20-5: The Schedule tab
In the Start Log area, you can either kick off the log file manually or start it at a scheduled date and time.
In the Stop Log area, you can stop the log based on one of four criteria:
-
Manually
-
After a certain time period has passed
-
At a specific data and time
-
When the log file is full
When the log file closes, you can opt to start a new log file. If Start A New Log File is enabled, a new log file will be created based on the increment specified in the Schedule tab. You can also specify a certain command to run when the log file closes. This could be a script that processes the data-or anything you want, really.
After you've collected the data, it can help you determine system bottlenecks and thereby help you ensure that your IIS server is meeting the system needs.
|
|
EAN: 2147483647
Pages: 193