7.2 Using Bridges to Adjust the Network
7.2 Using Bridges to Adjust the Network
One of the most valuable indicators of poor network response time, other than user complaints, is a high level of utilization. When Ethernet utilization climbs above 50 to 60 percent for long periods of time, either a large number of file transfers are hogging the network or network traffic has grown to the point where you may wish to modify the LAN to increase its performance. One of the most common methods used to improve LAN performance is to split the network into smaller segments through the use of one or more bridges.
Figure 7.3 illustrates the potential use of a local bridge to split an Ethernet into two smaller segments, thereby reducing the traffic on each of the resulting subnets. The maximum number of devices placed on each subnet depends on the traffic generated by each device, with a higher level of device traffic resulting in a lower limit on the number of devices per segment prior to network performance becoming unacceptable. By using a LAN protocol analyzer, you can obtain an accurate measurement of traffic per device, which can assist you in determining both when and where to subdivide the LAN. However, once a decision is made to employ the use of one or more local bridges, you should estimate their performance requirements to ensure the equipment you acquire does not become a bottleneck. To do so, you should ensure that the filtering and forwarding rate of a bridge under consideration at a minimum exceeds the frame processing rate associated with the average frame length monitored or estimated to be carried on your linked networks. As previously discussed in this chapter, most modern Ethernet bridges fabricated using high-performance Intel Pentium microprocessors or similar hardware will provide a level of frame processing that provides the ability to filter and forward frames under 100-percent loading without becoming a bottleneck. However, if you are using or considering the use of 100-Mbps Fast Ethernet or Gigabit Ethernet, you should carefully check the filtering and forwarding rates of bridges against the 100-percent frame load that a Fast Ethernet or Gigabit Ethernet network can provide. With a load rate ten times that of 10-Mbps Ethernet, many bridges are only capable of supporting a percentage of the maximum frame rate of a Fast Ethernet network. Similarly, some modern bridges and many of the latest network switches may not be capable of supporting the maximum Gigabit frame load. This situation also holds true for some servers that use the 32-bit Peripheral Component Interface (PCI) bus, which is severely taxed to achieve a frame transfer rate approaching the maximum Gigabit Ethernet frame transfer rate.
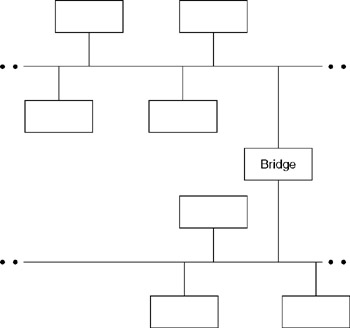
Figure 7.3: Using a Bridge to Improve Ethernet LAN Performance
7.2.1 Predicting Throughput
Until now, it was assumed that the operating rate of each LAN linked by a bridge is the same. However, in many organizations, this may not be true due to the implementation of LANs at different times using different technology. Thus, the accounting department could be using a 10-Mbps Ethernet 10BASE-T LAN, while the personnel department might be using a Fast Ethernet CSMA/CD network operating at 100 Mbps.
7.2.2 Linked LANs
Suppose you wanted to interconnect the two LANs via the use of a local bridge. To predict throughput between LANs, let us use the network configuration illustrated in Figure 7.4. Here, the operating rate of LAN A is assumed to be R 1 bps, while the operating rate of LAN B is assumed to be R 2 bps.
Figure 7.4: Linking LANs with Different Operating Rates
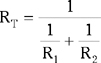
In one second, R 1 bits can be transferred on LAN A and R 2 bits can be transferred on LAN B. Similarly, it takes 1/R 1 seconds to transfer one bit on LAN A and 1/R 2 seconds to transfer one bit on LAN B. Thus, the time, 1/R T , to transfer one bit across the bridge from LAN A to LAN B, ignoring the transfer time at the bridge, is given by:
or
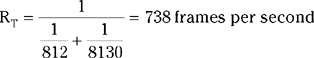
Previously, we computed that a 10-Mbps Ethernet would support a maximum transfer of 812 maximum-sized frames per second. If we assume that the second LAN operating at 100 Mbps is a Fast Ethernet network, we would compute its transfer rate to be approximately 8130 maximum- sized frames per second. Thus, the throughput in frames per second would become:
It should be noted that the preceding computation represents a best-case scenario in which it is assumed that one station has full access to the bandwidth of each network as well as the resources of the bridge. Unfortunately, this is usually the exception rather than the rule, unless some inter-LAN activity is performed at 3 a.m.! Thus, you will want to adjust this frame transfer rate and the key question becomes how to do so. Fortunately, there are a number of low-cost LAN monitoring software products, such as Triticom Corporation's EtherVision and TokenVision software programs and WildPackets Etherpeek. Using such products, you can determine the average number of stations active on a network.
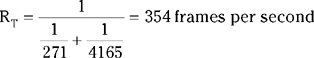
Suppose there were three users on LAN A transmitting data at any given time and two users on LAN B. Then you would adjust the previous computations to reflect the fact that several users share the bandwidth of each linked network. To do so, the maximum transfer rate on LAN A would become 812/3, or about 271 frames per second, while the maximum transfer rate on LAN B would become 8130/2, or approximately 4065 frames per second. Then, the expected throughput, which considers the fact that the bandwidth on each network is shared, becomes:
7.2.3 Estimating Data Transfer Time
Knowing the transfer rate between LANs can help us answer many common questions as well as provide us with a mechanism for determining whether or not the location of application programs on different servers should be altered . For example, suppose a program was located on a server on LAN B which suddenly became popular for use by workstations on LAN A. If the program required 768 Kbytes of storage, we could estimate the minimum transfer time required to load that program and, depending on the results of our calculation, we might want to move the program onto a server on LAN A. For this example, the data transfer rate would be 738 frames/second * 1500 bytes/frame, or 1,107,000 bytes per second. Dividing the data to be transferred by the data transfer rate, we obtain:
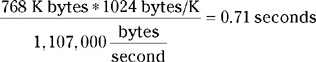
Similar to our prior notation concerning the computation of the frame rate between linked LANs, the above transfer time computation represents a best-case scenario. That is, it would take 0.71 seconds to transfer the 768-Kbyte file if no other users required the bandwidth of each LAN during the file transfer activity. However, as previously noted, it was assumed that the use of a software monitoring program indicated that three users were actively performing network-related activities on LAN A and two users were performing network- related activities on LAN B. Thus, a more realistic transfer time computation would use a frame rate of 369 frames per second. In modifying our computations, the transfer rate would be 369 frames/second * 1500 bytes/frame, or 553,500 bytes per second. By dividing the data to be transferred by the data transfer rate, we obtain:
Here, 1.42 seconds represents the average transfer time between networks, while the 0.71-second transfer time represents the optimum transfer time.
7.2.4 Considering Remote Connections
We can extend our analysis of Ethernet frames and the process by which we can estimate data transfer time by considering the frame rate supported by different wide area network (WAN) line speeds. For example, let us consider a pair of remote bridges or routers connected by a 9.6-Kbps line. The time per frame for a 72-byte frame at 9.6 Kbps is:
Thus, in one second, the number of frames is 1/0.0599712, or 16.67 frames per second. Table 7.12 compares the frame-per-second rate supported by different link speeds for minimum- and maximum-size Ethernet frames. As expected, the frame transmission rate supported by a 10-Mbps link for minimum- and maximum- size frames is exactly the same as the frame processing requirements under 100 percent loading as previously indicated in Table 7.2.
| Frames Per Second | ||
|---|---|---|
| Link Speed | Minimum | Maximum |
| 9.6 Kbps | 16.67 | .79 |
| 19.2 Kbps | 33.38 | 1.58 |
| 56.0 Kbps | 97.44 | 4.60 |
| 64.0 Kbps | 111.17 | 5.25 |
| 1.536 Mbps | 2815.31 | 136.34 |
| 10 Mbps | 14880 | 812 |
In examining Table 7.12, readers should note that the entries in this table do not consider the effect of the overhead of a protocol used to transport frames between two networks. Thus, readers should decrease the frame-per-second rate by approximately 20 percent for all link speeds through 1.536 Mbps. The reason the 10-Mbps rate should not be adjusted is because it represents a local bridge connection that does not require the use of a WAN protocol to transport frames. Readers should also note that the link speed of 1.536 Mbps represents a T1 transmission facility that operates at 1.544 Mbps. However, because the framing bits on a T1 circuit use 8 Kbps, the effective line speed available for the transmission of data is 1.536 Mbps.
Another note concerning the entries in Table 7.12 are their applicabiltiy to different types of Ethernet networks. Because Fast Ethernet frames vary in length from a minimum of 72 bytes to a maximum of 1526 bytes, the entries in the referenced table for link speeds up through 1.536 Mbps are also applicable to Fast Ethernet. Although Gigabit Ethernet requires a minimum frame length of 520 bytes to include the preamble and start of frame delimiter fields, when transferred via a WAN, carrier extension symbols are stripped from the frame. Thus, the frames-per-second rates for minimum- and maximum-length frames shown in Table 7.12 for WAN speeds up to 1.536 Mbps are also applicable for Gigabit Ethernet frames.
Once you determine the frame transfer rate supported by a remote connection, you can use a precise value based on knowledge of the average frame rate monitored or estimated to be carried by the network only if that rate falls between the frame rate range noted in Table 7.12. Otherwise, you would use the range of frame rates listed in Table 7.12 in your computations to obtain a range of transfer times. For example, assume you wish to link two LANs via the use of remote bridges, as illustrated in Figure 7.5a. If the DSUs operate at 56 Kbps, they are able to support a frame transmission rate between 4.6 and 97.44 frames per second prior to adjusting the rate downward by 20 percent to account for the WAN protocol overhead. If you monitored LAN A and determined that the average frame rate was 250, you could not use that value as the potential frame rate between LANs because it would exceed the transmission capacity of the circuit. Without prior knowledge obtained from monitoring the circuit, you would also use the range of frame rates listed in Table 7.12 and adjust them downward by 20 percent to account for the WAN protocol overhead. For either situation, you would then estimate the data transfer time between stations on one network from another by considering the operating rate of each network and the remote connection. Figure 7.5b illustrates the operating rate components for the network topology shown in Figure 7.5a.
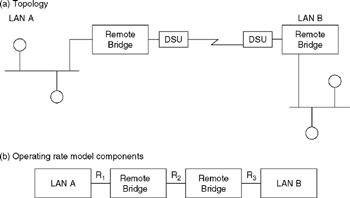
Figure 7.5: Linking Remote Networks
To determine the frame transfer rate between remotely connected networks, you would then solve the following equation:
Solving for R T , we obtain:
Using specific values for R 1 , R 2 , and R 3 , you would determine R T , which would provide the frame transfer rate between networks. Then, knowing the file size and average frame rate, you could compute the transfer time in the same manner as previously computed.
As indicated in this chapter, you can use your knowledge of the structure and operation of Ethernet LANs to compute a number of performance measurements. Some of those measurements provide a basis for selecting an appropriately performing bridge or router, while other calculations provide the ability to estimate the time required to load programs across a bridge connecting LANs operating at different data rates. These calculations also provide the tools necessary to adjust the configuration of LANs and recognize the need to move application programs to different servers to increase network performance.
7.2.4.1 The Excel Model LANTRUPT
To facilitate LAN throughput computations, an Excel model was developed that is stored on the file LANTRUPT located in the Excel directory at the Web URL indicated in this book and an example of the model is shown in Figure 7.6. In examining the LAN throughput predictor model shown in Figure 7.6, note that you can adjust LAN operating rates and the average number of network users on each network. Also note that you can enter specific frame rates for each LAN in the cells that currently contain the entry #na. Those two entries were used to prevent a division by zero computation and should be replaced by specific frame rates if you wish to determine an expected throughput based upon specific Ethernet frame rates determined from monitoring each network.
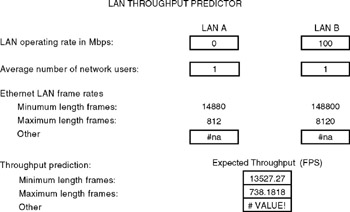
Figure 7.6: LAN Throughput Predictor
EAN: 2147483647
Pages: 111