Conceptual Model Reports
Overview
This chapter shows you how to prepare ORM reports by printing model diagrams directly and by using the New Report Wizard for ORM to prepare reports on constraints, fact types, object types, and supertypes. This chapter describes four reports, each of which extracts a different set of properties from your model using customizable filters and attributes.
You can prepare ORM reports from within an ORM source model or from within a Database Model Diagram. There are three additional reports for logical models: Statistics, Table, and Data type. These are described in Chapter 15.
You can create, print, preview, and export comprehensive reports based on the properties stored in an ORM source model. For example, you can create a report that fully documents your conceptual design, or you can prepare a selective report for review with a domain expert. You can preview your report to ensure that you have chosen the right filters, attributes, and formatting options to create a report that precisely meets your needs. You can export your report to an .RTF file for further editing with a word processing application.
In the Database Model Diagram, you can merge several models into a single project and use the reports described in this chapter to report on the merged project file. The "merge and report" is facility is useful for tasks such as creating organization wide data dictionaries.
From within an ORM source model, you can preview or print your model's diagrams directly. You can choose to print all the pages, the current page, or a range of pages.
You can choose from 29 filters and 61 attributes (Table 9-1), and after sorting the contents, you can customize the title, subtitle , and group headers.
|
Tabs |
Reports |
|||
|---|---|---|---|---|
|
Object Types |
Constraints |
Fact Types |
Supertypes |
|
|
Filters |
10 |
12 |
7 |
|
|
Attributes |
23 |
6 |
16 |
16 |
Many features in each report type are similar to those in other report types. Some features are identical. Some of the features described in this chapter also apply to the logical model reports described in Chapter 15. For example, the pagination window shown in Figure 9-7 is the same in all reports. All the other report options have some unique features that are explained in each report.
New Report Wizard How to Prepare ORM Reports
When you want to create reports from an ORM Source Model, you must first open the ORM source model and display it on the Visio drawing surface.
| Hint |
In the ORM Source Model solution, you may have several models open at once. However, the New Report Wizard operates only on the model displayed in the active window. To use ORM reports on merged models, you must use the reports with a project in the Database Model Diagram. |
To start the New Report Wizard choose Database > Report from the main menu, and click on the Report option shown in Figure 9-1.
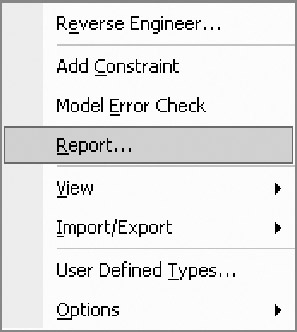
Figure 9-1: Start New Report Wizard.
The New Report Wizard dialog then appears as shown in Figure 9-2. The next four sections describe what you can do with each of the four options.
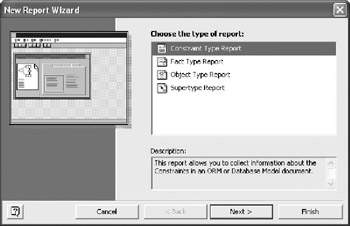
Figure 9-2: New Report Wizard dialog.
Object Type Reports
Choose the Object Type report when you want to report on ORM object types and their definitions. For example, you can use this report to help domain experts to agree on the names and meaning of ORM object types, or to find synonyms and homonyms. You can issue Object Type reports from an ORM source model or from a Data Model Diagram.
To run an Object Type report , ensure that the model on which you want to report is the active window, then choose Database > Report to open the New Report Wizard selection list shown in Figure 9-2. "Highlight Object Type Report" in the list, and then click the "Finish" button. The Object Type Report dialog shown in Figure 9-3 now appears.
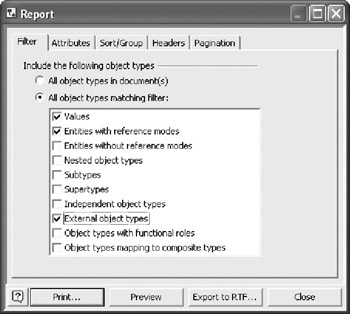
Figure 9-3: Object Type Report ”Filters.
Object Type Report Filter Tab
To select the object types on which you want to report: click the Filter tab shown in Figure 9-3. To restrict the object types that appear in the report, click the radio button All object types matching filter and then check the object types of interest. For example, to report on entity object types that don't have a reference mode, choose the check box for that option. You can choose any combination of filters by clicking one or more of the check boxes. Figure 9-3 shows the ten available filters, with three of them checked.
If all your filter options are grayed out, the radio button All object types in document(s) may be selected. This option causes all filter check boxes to be selected but grayed out. Table 9-2 gives some examples of when you might use each filter.
|
Filter |
Usage example |
|---|---|
|
Values |
Review consolidation of Value Object Types. Generally, ORM models have relatively few Value Object Types. |
|
Entities with reference modes |
Review appropriateness of reference modes. |
|
Entities without reference modes |
Review externally identified objects with the aim of introducing standard identification schemes. |
|
Nested object types |
Review definitions and candidates for flattening or co-referencing. |
|
Subtypes |
Review "is a" relationships (e.g., Car is a Vehicle) with subject matter experts. Review subtype definitions. |
|
Supertypes |
Review "is a" (e.g., Car is a Vehicle) relationships. Review roles attached to supertypes and ensure they are shared by all subtypes. Agree on classification rules with domain experts. |
|
Independent object types |
Unless an object type is an objectified association, it is rare for it to be independent. Reporting only Independent object types makes it easy to review these cases. |
|
External object types |
Use this option when to review Object Types that are used in your displayed model but which are defined in a different model. |
|
Object types with functional roles |
Functional roles have simple uniqueness constraints. Selecting only this filter reports on object types that are often involved in keys. |
|
Object types mapping to composite types |
To compare candidates for flattening, co-referencing, and nesting. Composite types are object/relational types as defined in SQL:1999. |
Object Type Report Attributes
You can select one or more of the fifteen selectable attributes shown in Figure 9-4. To report on all attributes, click the Select All button, and all check boxes will be ticked as shown in Figure 9-4. To report on fewer attributes, click the Deselect All button and click those checkboxes of interest. You can also choose Select All and then deselect the attributes you don't want by clicking on each checkbox
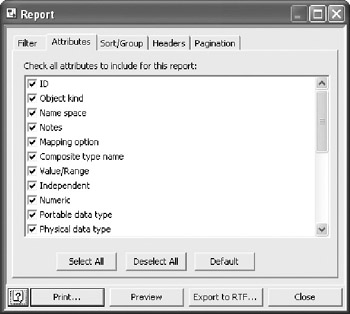
Figure 9-4: Object Type Report ”Attributes.
Table 9-3 gives examples of when you might want to report on each attribute.
|
Filter |
Usage Example |
|---|---|
|
ID |
ID is a system assigned number that VEA uses to uniquely identify each object type. |
|
Object kind |
Check that you have chosen the correct kind of object type (Entity or Value) |
|
Name space |
When you need to uniquely identify objects with the same conceptual name but a different meaning (homonyms.) For example, the word "Right" can be used to mean "correct" or it can be used to mean "the opposite to left." |
|
Notes |
Review object type definitions with one or more domain experts. You put object definitions in the "Notes" field by right clicking an object type and choosing Database Properties > Definition > Notes. |
|
Mapping option |
Does not result in a composite type: The most common case. |
|
Composite-type name |
Use this to review composite object names with domain experts. |
|
Value/Range |
Review allowed ranges with domain expert. |
|
Independent |
Review entity types that are used to create separate tables. |
|
Numeric |
Compare all numeric data types to see if any can be combined. |
|
Portable data type |
Review the database independent data types that you have chosen. Portable data types are mapped to a physical data type in a DBMS. |
|
Physical data type |
Check that a target physical data type can accept the range of values you have set as a domain constraint on an ORM object type. |
|
Referencing facts |
Domain expert review. |
|
Fact count |
Review the number of roles played by each object type. |
|
Pages |
Review subject areas with a domain expert. Paginating a model adds structure and makes it easier for domain experts to understand. |
|
Personal pronoun |
Review the verbalization options to check that you have correctly applied "his/her" or "its" in the verbalization. |
Object Type Report Sort Group
Use the Sort/Group tab shown in Figure 9-5 to choose a sorting sequence and to format the result into groups. The Group sorted records by drop-down menu displays only those items that you have added to the Selected sort keys: list. Table 9-4 provides details on using sort keys.
|
Sort Key |
Usage example |
|---|---|
|
Object Kind |
Sorts by the three object kinds (Entity, Value, External) |
|
Object Name |
Sorts by the conceptual name of the object type. |
|
Type Name |
Review data types. |
|
Type Mapping Option |
Reports on the mapping option selected for each object type. |
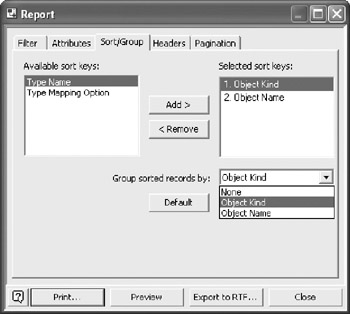
Figure 9-5: Object Type Reports ”Sort/Group tab.
You can choose one of three grouping options from a drop-down list as shown in Figure 9-5. For example, to identify homonyms (same name, different meaning), you use the Attribute tab shown in Figure 9-4 to select Name space, Notes, Object Kind and Object Name. Then you add Object Name to the selected sort keys, choose sort by Object Name and Group by Object Name. This generates a report in alphabetic sequence of Object Name with duplicate objects grouped together. An ideal report for homonym trapping!
Object Type Report Headers
You use the headers dialog box shown in Figure 9-6 to set the values for the three parts of your report's header. The grayed sub-window headed Sample report title shows the contents of the text that appears in the active sub-window. Clicking a sub-window makes it the active sub-window and changes the content accordingly .
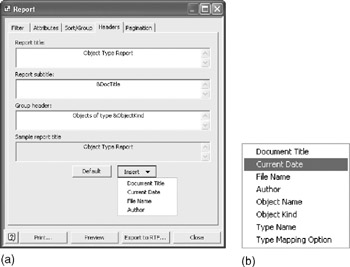
Figure 9-6: Object Type Report ”Headers.
The Default button at the bottom resets the three sub- windows : Report title, Report subtitle , and Group header . The default values are shown in Figure 9-6(a). You can type your own text into each window, and you can use the Insert button to add macros from the drop down list. Click the sub-window into which you want to insert a macro, then click the insert button and choose one or more fields from the drop down list.
When you click on the Report title or Report subtitle sub-windows, the Insert button shows the four options in Figure 9-6(a). Clicking on the Group header sub-window and then on the Insert button shows the four extra options in Figure 9-6(b).
| Hint |
The Insert button shows a different list for the Group header sub-window. |
Report title: The default is "Object Type Report." You can change the title by typing any text that you want. There is no practical limit to the size of your title. You can add a title that covers several pages and you can cut and paste symbols from Microsoft Word such as those for currency or mathematical formulae. The sub-windows do not accept diagrams.
Report subtitle: The default is the model file name, for example, "Patient_CS.vsd." You can add free text, symbols, or one of the insert menu options.
Group header: The fields that initially appear in the group header sub-window are those that you chose for your group header in the Sort/Group tab (see Figure 9-5). If you chose to group sorted records by "none," then this sub-window is grayed out. If you want to add some text, you must return to the Sort/Group tab and choose any selection other than "none." You can then add free text and one or more of the eight macros from the insert menu in Figure 9-6(b).
Object Type Report Pagination Tab
The pagination tab has identical features in all reports. The pagination tab features are described once here. All other report descriptions, including the reports described in Chapter 15, refer back to this section.
Each report type has three levels: Document, Group, and Record.
- Document level is for reports based on multiple documents.
- Group level refers to those parts of your report that you have chosen as groups in the Sort/Group dialog box.
- Record level refers to a part of your report. For example, in a report showing many ORM object types a record is the information for one object type. In an ORM Fact Type report, a record holds the information for one fact type.
Document separator: The word "document" refers to the separate subsections of the report that include (for example) ORM entity types and ORM value types. The ORM entity types are collected into one "document" and the ORM value types appear in a connected but separate "document." The document separator specifies what will appear between the subsections of your report. The drop-down menu has four options: New Page; Single Line, Double Line, and None.
You can apply a separator between each Document, Group, and Record by selecting from the drop-down list shown in Figure 9-8. The meaning of each separator is shown below.
|
None: |
You don't get a separator between each section of your report. |
|
Single Line: |
Inserts a single horizontal line from margin to margin. |
|
Double Line: |
Inserts two horizontal lines from margin to margin. |
|
New Page: |
Starts each section of your report on a new page. |
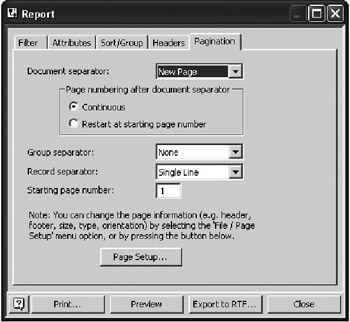
Figure 9-7: Object Type Report ”Pagination tab.
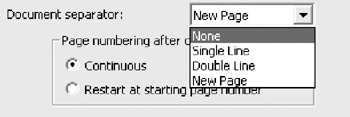
Figure 9-8: Document separator drop-down list (see Figure 9-7).
Page numbering after document separator
Continuous (Radio button). Select this option to number your report pages consecutively from front to back. If you deselect this option, your page numbers start at 1 for each subsection of your document.
Restart at starting page number (Radio button). This option starts the page numbering with 1 for each new source document in a report based on multiple source documents. If you don't select this option, each report page is numbered consecutively from front to back. This will also apply to multiple documents.
Group separator. Specifies the formatting to use to separate groups in the report. You choose groups with the Sort/Group tab.
Record separator. Specifies the formatting to use to separate records in the report. In this report, a "record" refers to all the information about one object type.
Starting page number. Sets the starting page number for the report.
Report Pagination tab ”Page Setup button
Clicking on the Page Setup button shown at the bottom of Figure 9-7 opens a Page Setup dialog box with three tabs. You use this dialog box to control page size, type, margins, headers and footers.
Header/Footer tab. Figure 9-9 shows the Header/Footer tab that you use to change the contents of the page header and footer. Click on the page image at the right to change the headings and values of the two windows on the left. Figure 9-9 shows the result of clicking on the left footer region of the page image. The top scroll window shows the macro code and the bottom window shows the result of the macro so you can see when this example was created.
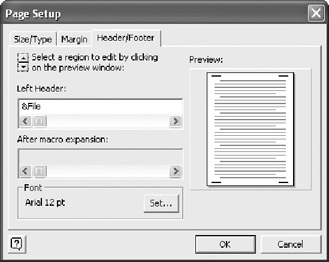
Figure 9-9: Page Setup Window ”Header/Footer tab.
Size/Type tab. You can use the Size/Type tab to adjust page sizes with the controls shown in Figure 9-10.
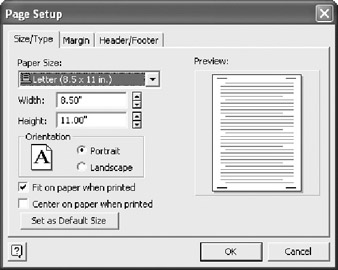
Figure 9-10: Page Setup Window ”Size/Type tab.
Margin tab. You can use the margin tab to adjust page margins with the controls shown in Figure 9-11.
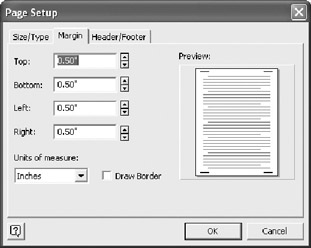
Figure 9-11: Page Setup Window ”Margin tab.
Report Window bottom row of buttons
Along the bottom of every report dialog, you will see the four buttons shown in Figure 9-12. The following paragraphs discuss the functions of each button.
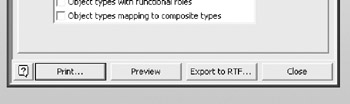
Figure 9-12: Report window ”bottom row of buttons.
Print button
Clicking on the print button at the bottom left of the report window (Figure 9-12) reveals the print button dialog as shown in Figure 9-13. The succeeding paragraphs explain the options in this dialog.
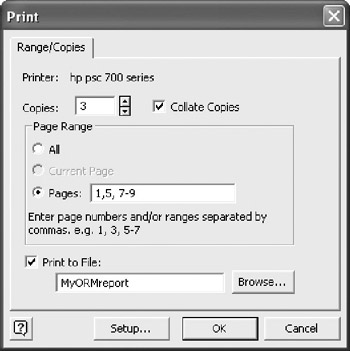
Figure 9-13: The print button dialog.
Copies. Use the print dialog box to set print options and printer properties. If you select more than one copy the collate checkbox appears. When you check this box, your printer will print each copy as a separate document. If you don't check this box then the pages will print in the sequence. For example, three copies will be printed in the sequence 1, 1, 1, 2, 2, 2, and so on.
Page range. You can select individual pagers or groups of pages. For example, clicking the "Pages" radio button and entering 2, 5, 7 “9 will print page 2, page 5, and pages 7,8, and 9.
Print to file. To print to a file, click the Print to File radio button, and enter a filename, for example, "MyORMreport." If you click the Browse button you will see a file location window that helps you to choose where to store your report.
Setup button (printer)
You can directly change your printer settings by clicking the Setup button at the bottom of the print button dialog shown in Figure 9-13. This button opens the Print Setup dialog shown in Figure 9-14 which allows you to change your printer settings. The Network button allows you to locate a shared printer on your network.
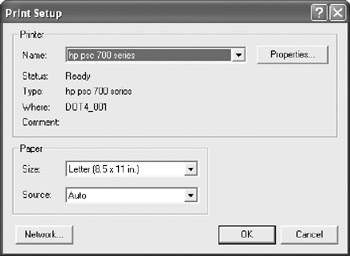
Figure 9-14: Print Setup dialog.
Preview button
Clicking the Preview button displays a preview of your report. This feature works only if you have a printer driver installed. The following paragraphs explain the functions of each button in the preview window (see Figure 9-15).
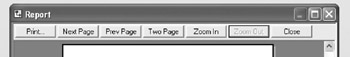
Figure 9-15: Preview dialog.
Print. Clicking the Print button in the preview dialog box reveals the Print dialog shown in Figure 9-9.
Next Page. When you click the Next Page button, you will see the next page of your previewed report in the preview window.
Prev Page. This button takes you to the previous page in your previewed report.
Two Page. When you click the Two Page button, you will see two consecutive pages of your report in the preview window.
Zoom In. When you click the Zoom in button you can less of your report on screen but what you can see is magnified.
Zoom Out. This button displays more of the report on screen but at a smaller scale.
Close. When you click the Close button you are returned to the Report window shown in Figure 9-12. Note: If you close this window using the X control, you also close the New Report Wizard and your earlier selections are lost. This can be annoying if you wanted to return to the New Report Wizard to continue to work with the report that you were preparing. Always use the Close button!
Export to RTF button
Clicking on the Export to RTF button at the bottom of Figure 9-12 opens the Export to RTF dialog box shown in Figure 9-16, which asks you for a file name and location. If you are connected to a network, you can save the file in any accessible folder on the network. There is a "save as type" option with a single *.rtf option. After you have saved your report in rich text format, you can edit it with a word-processing program.
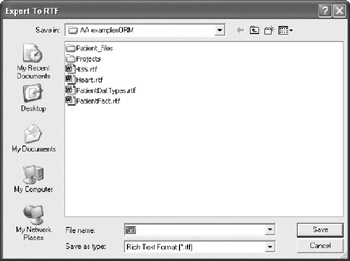
Figure 9-16: Export to RTF button.
Save in. Choose the windows folder in which you want to save your file.
File name. Type in a filename then click on the Save button.
Close button
Clicking the Close button ends New Report Wizard and returns you to the drawing page.
Constraint Type Reports
Constraint type reports describe the business rules in an ORM Source Model or in a project in the Database Model Diagram. A constraint type report helps you to navigate through a large model by including information about the location of the constraint with the constraint description that appears in the Verbalizer window.
Constraint Type Report Filter
You use the filter tab to choose which constraint types that you want in your report. The Constraint Type report Filter tab has twelve constraint checkboxes as shown in Figure 9-17. To add a constraint to your report, just click the appropriate checkbox. You may select all, one or a just a few. You can learn about constraints in Chapters 4 and 5.
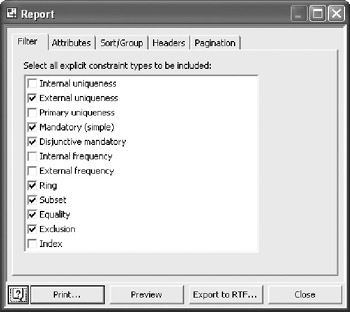
Figure 9-17: Constraint Type Report ”Filters.
Constraint Type Report Attributes
Use the attribute tab shown in Figure 9-18 to choose the attributes that you want in your constraints report. The record counter number is used to give a sequence number to the constraints in your report and it has no other significance. The constraint type appears as "constraint kind" on the report and you normally use this property to group the records in your report. "ID" is an internal VEA number and you will rarely use it.
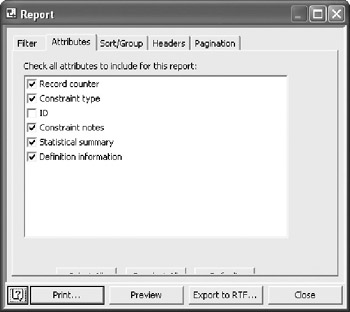
Figure 9-18: Constraint type report ”Attributes.
Constraint notes are entered during the ORM modeling process and are not processed by VEA. The Statistical summary shows how relationships and roles are affected by a constraint. Definition information shows which domains are affected by each constraint.
The last attribute shows the constraints verbalization. Your report includes verbalization whether you want it or not, so it does not appear as an optional attribute.
Constraint Type Report Sort Group
The Constraint type report Sort/Group is similar to that of the Object Type report explained in the text associated with Figure 9-5. The difference being that here you have a take it or leave it option. You can choose to sort and group by Constraint kind or choose not to sort at all. You would normally use the default and sort by Constraint kind.
Constraint Type Report Headers
The header tab is similar to the Object Type report header shown in Figure 9-6 and you have the same four basic options: Document Title, Current Date, File Name , and Author. The only difference being that in the Group header sub-window you have an option to insert Constraint kind. For an explanation of the other header windows you can refer to the text associated with Figure 9-6.
Constraint Type Report Pagination
This works in exactly the same way as the Object Type report pagination described in the text associated with Figure 9-7.
Fact Type Reports
Fact Type reports show information about the fact types in an ORM source model or in a project containing an ORM source model. When you want to review all or just a selection of the fact types in a single ORM model you can choose the Fact Type report from within an ORM Source Model. If you want to report on the fact types across merged models in a project, you must open your merged model from within the Database Design Diagram and use the Fact Type report from there.
You can use the Fact Type report to bridge the gap between a domain expert's perception of the application domain and the keys in a derived logical model. The Fact Type report is also helpful in finding out which ORM are used in groups of Fact Types.
To run a Fact Type report, make sure that the model on which you want to report is the active window, then choose Database > Report to open the New Report Wizard selection list (see Figure 9-2). Then highlight Fact Type Report in the list and click the Finish button. The Fact Type Report dialog shown in Figure 9-19 will then appear.
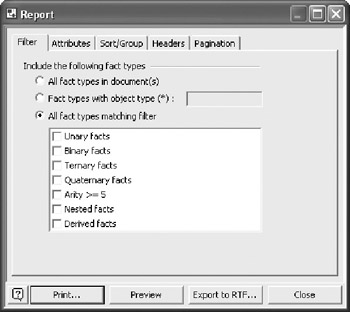
Figure 9-19: Fact Type Report ”filter tab.
Fact Type Report Filter Tab
The filter tab shown in Figure 9-19 allows you to choose which facts to include in your report. You can use the radio buttons to choose one of the following three options:
All fact types in the document(s). This is useful for completely documenting all the assertions made in your model(s).
Fact types with object type(*). Allows you to select just those facts that contain the Object Type whose name you put into the option box. Figure 9-20 shows this option selected with "Patient" as the Object Type name . This feature helps you to keep track of all statements that are made about a domain or set of domains.
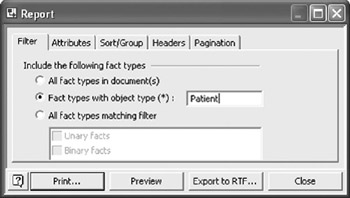
Figure 9-20: Facts with object type(*).
All fact types matching filter. Refer to Figure 9-19. With this option, you can choose any combination from the seven options: Unary, Binary, Ternary, Quaternary, Arity >=5, Nested, and Derived.
Recall that the arity of a fact type is the number of roles in it. Sometimes, you can use a single role to uniquely identify an object type. For example, social security number can be used to uniquely identify a person. However, in some cases you need to use two or more roles to uniquely identify a fact instance. For example, the code "DL 058" is the Delta Airlines code for the flight from Atlanta (USA) to Gatwick (UK). However, if you try to reserve a seat on DL 058, you will be asked to choose the date on which you want to fly. Flight number is really a code for a route flown by a particular airline on specific days such as Monday, Wednesday, and Friday. To uniquely identify a specific flight instance, you also have to specify a date. So, the minimum number of roles needed to uniquely identify a flight instance is two: flight number and date of flight.
In summary, this filter helps you to review your fact types to make sure that they contain the lowest possible number of roles but no fewer than that! In other words, this filter helps you to answer the question "Are all my facts as simple as they should be, and not simpler?"
Fact Type Report Attributes Tab
You can choose any combination of the sixteen options shown in Figure 9-21 by clicking the appropriate checkbox. The window size is fixed so you can only see twelve of the available sixteen attributes. To see the other four attributes, use the vertical scroll bar on the right of the window. The hidden attributes are for derivation, mapping option, composite type name, and collection types.
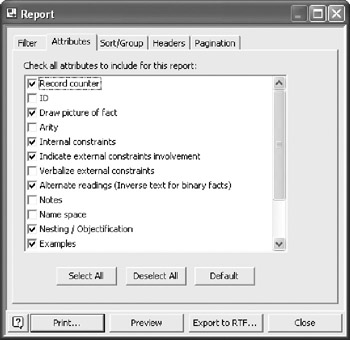
Figure 9-21: Fact Type Report ”Attributes tab.
The Select All and Deselect All buttons do exactly what they say. The default button selects eleven of the check boxes and deselects the remaining five (ID, Arity, Verbalize external constraints, Notes, and Name Space). Figure 9-15 shows the default selection.
Fact Type Report Sort Group tab
Figure 9-22 shows the Fact Type report's Sort/Group tab. This tab works in the same way as the Object Type's Sort/Group tab shown in Figure 9-5.
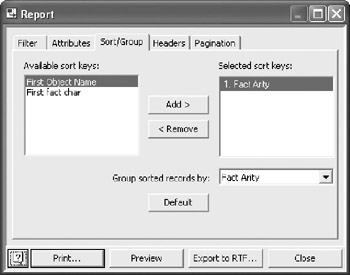
Figure 9-22: Fact Type Report ”Sort/Group tab.
You can sort by Fact arity, First Object Name, or First fact character. Whatever sort key you add to the Selected sort keys window appears in the Group sorted records by drop-down list.
The option "First fact char" sorts your report in alphabetic order of Fact Type name. For example consider the four fact types Country has CountryName, Country has Population, Country has President , and Country has Area . The "First fact char" option would sort them in strict alphabetical sequence thus: Country has Area, Country has CountryName, Country has Population, Country has President . These facts would appear together under a group header entitled: Facts starting with "C."
Using a good domain naming convention will help you to get best value from this feature.
Fact Type Report Headers tab
As you might expect, the Fact Type report headers tab works in the same way as the Object Type header tab shown in Figure 9-6. As with the other reports, you can add the fields for Document Title, Current Date, File name, and Author. When the Group header window is active, you can also add First Object Name, Fact Arity, First fact char, and Fact Verbalization as shown in the drop down insert menu in Figure 9-23.
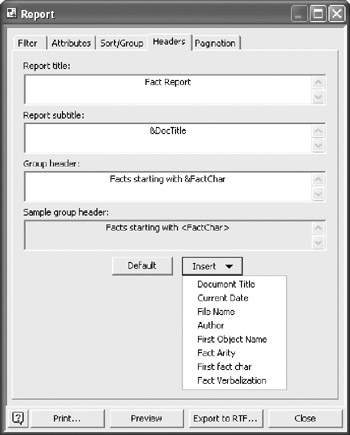
Figure 9-23: Fact Type Report ”Headers tab.
If you want a detailed explanation of the other header windows , you will find one in the text associated with Figure 9-6.
Fact Type Report Pagination
This works in exactly the same way as the Object Type report pagination described in the text associated with Figure 9-7.
Supertype Reports
As the title implies, supertype reports provide information about the subtype and supertype definitions in your ORM source model or in a project in a Database Model Diagram.
Supertype Report Attributes Tab
You can choose any combination of the sixteen attribute options by clicking on the appropriate checkbox. The window has a fixed size which shows twelve attributes when you open it so this prevents you from viewing all of the attributes at one time. If you want to see the other four attributes you have to use the vertical scroll bar on the right of the window. Figure 9-24 shows the lower part of the window with the default drop down list extended.
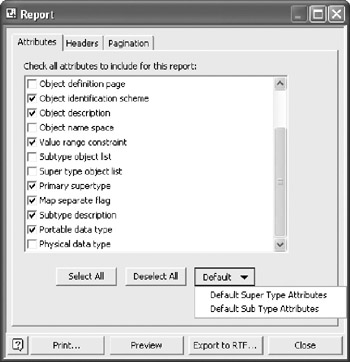
Figure 9-24: Supertype Report ”Attributes.
The Select All and Deselect All buttons do what they say. The default button gives you the two option sets shown by the bullets listed in Table 9-5.
|
Attribute |
Supertype default |
Subtype default |
|---|---|---|
|
Draw graphical supertype tree |
||
|
Subtype line definition page |
||
|
ID |
||
|
Object verbalization |
||
|
Object definition page |
||
|
Object identification scheme |
||
|
Object description |
||
|
Object name space |
||
|
Value range constraint |
||
|
Subtype object list |
||
|
Super type object list |
||
|
Primary supertype |
||
|
Map separate flag |
||
|
Subtype description |
||
|
Portable data type |
||
|
Physical data type |
Supertype Report Headers Tab
This tab is similar to the tab shown in Figure 9-6. The Report title and Report subtitle windows have macro options for Document Title, Current Date, File name, and Author. Unlike the other report headers tab, the Supertype header tab does not have a Group header, and there are no sorting options.
Supertype Report Pagination Tab
This works in exactly the same way as the Object Type report pagination described in the text associated with Figure 9-7.
Copying Diagrams and Text
Copying an Object from Another Program to a Visio Drawing
Start in the source program. Select the object you want to copy and choose Edit > Copy . In Visio, make sure that the Visio document in which you want to paste the object is the active Visio document. Choose Edit > Paste Special . The Paste Special function allows you to choose the format of the pasted object. A dialog box similar to Figure 9-25 will appear. The options in this dialog depend on the properties of the object you want to paste. Choose the format you want from the list in the Paste as window then click OK.
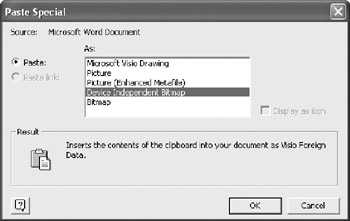
Figure 9-25: Paste Special dialog.
If you paste a bitmap into Visio, it may arrive in Visio as an image that is ten or more times bigger than your model. If this happens, your Visio window will be filled with the pasted image. If you have a scroll mouse, rotate the mouse wheel to rescale the drawing surface until the pasted image is a small object. Then click the image to make it the active object with its handles displayed. Click on a corner handle, hold the left mouse button down and drag the corner handle to proportionally resize the image to meet your needs. If you don't want proportional resizing, use a handle that is not at a corner of the object.
| Caution |
Using Visio Diagrams in Reports: Images and other objects that you paste onto the drawing surface will not appear in an *.rtf file generated by the New Report Wizard. If you want a report that includes diagrams from your model then you must first generate an *.rtf file, open it in Word and then copy your Visio diagrams into the Word document. You can then open your Visio diagrams directly from within Word using "Edit Visio Object." |
Copying or Moving a Single Item from Visio to Visio or to Another Program
Select the Visio object(s) that you want to move or copy by clicking to make control handles appear. Then right-click, and a menu similar to Figure 9-26 will appear. Figure 9-26 is the result of right-clicking an object type in an ORM source model. Some objects have different menus .
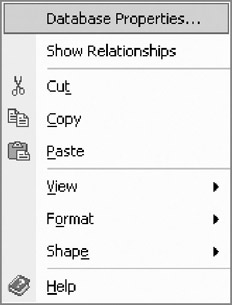
Figure 9-26: Visio right click menu.
The next step is to do one of the following:
To move the item, click Cut on the menu
To copy the item, click Copy on the menu
If you want to move or copy the item to another document, switch to the other document and click where you want the item to appear. Then choose Edit > Paste Special, and choose the relevant format for pasting.
Copying from Visio to Word
It is easy to copy all or part of a Visio diagram to Microsoft Word. First select the relevant part of the diagram to copy by dragging the mouse over the relevant diagram area. Then copy the selection to the clipboard, either by typing Ctrl+C or choosing Edit > Copy from the main menu.
Then place the cursor in the relevant place in the Word document where you wish to place the copy. Then choose Edit > Paste Special from Word's main menu. The Paste Special dialog shown in Figure 9-27 then appears.
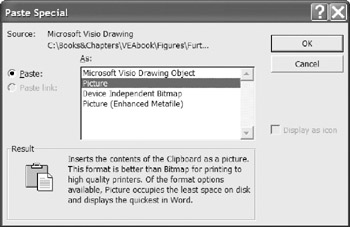
Figure 9-27: Pasting a Visio drawing into Word.
To paste an image of the copied drawing, you have four options. For most purposes, we recommend the Picture option. This adds only a little to the size of your Word document, but still gives a good quality image.
If the model fragment you want to copy is spread over more than one page in Visio, you can insert a new page in Visio and drag the relevant model elements onto that page so that you can copy just the model fragment you want.
Overview of Database Modeling and the Database Modeling Tool
The Conceptual Modeling Solution (ORM)
- Object Types, Predicates, and Basic Constraints
- ORM Constraints
- Configuring, Manipulating, and Reusing ORM Models
- Mapping ORM Models to Logical Database Models
- Reverse Engineering and Importing to ORM
- Conceptual Model Reports
The Logical Modeling Solution (ER and Relational)
- Creating a Basic Logical Database Model
- Generating a Physical Database Schema
- Editing Logical Models”Intermediate Aspects
- Editing Logical Models”Advanced Aspects
- Reverse Engineering Physical Schemas to Logical Models
- Logical Database Model Reports
Managing Database Projects
EAN: 2147483647
Pages: 150
