A Practical Approach to Profiling
You need to first understand what it is you're trying to achieve; there are a number of reasons why you may want to profile your application:
-
To reactively analyze a problem with an existing application (for example, a suspected memory leak, poor performance, and so on)
-
To do proactive/periodic analysis to benchmark and profile an application or an application's key components
-
To do preproduction or development phase testing to gain statistical analysis on the operations of an application
-
To baseline or qualify existing capacity model estimates and calculations
In earlier chapters, you looked at performance management and what constitutes a performance improvement. Profiling and benchmarking are key aspects of performance management. In Figure 14-1, you'll see benchmarking and profiling listed on the left of the performance management model.
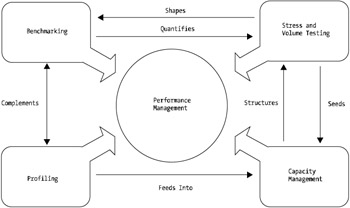
Figure 14-1: Performance management methodogy
Although this figure shows what initiatives make up performance management, it doesn't indicate at what stage of your application environment's life cycle each stage should be undertaken. It should be obvious that SVT should be done before going live in a production environment. As you saw earlier, you should carry out SVT in a production-like environment when there are new major capabilities or infrastructure changes.
On the other end of the life cycle, profiling, shouldn't be performed in a live production environment either. Although profiling will give you a profile of your environment and application characteristics under load, it'll impact your customers or end users if you're conducting the profiling in a live environment. The same problem applies with benchmarking.
As also discussed in Chapter 2, constant and proactive monitoring and analyzing of your WebSphere environment should be a high priority within your operational processes.
So how does this relate to profiling? Look at it this way: performance management, as discussed, is about taking control and proactively managing the performance, scalability, and optimization of your WebSphere environment. In other words, profiling is the process that provides you with a key statistical measurement of the specific components within your platform in order to model and analyze the platform trends. That is, are things getting slower (lower performing), or are things getting faster (higher performing)?
Benchmarking is more of a quantitative measurement that looks at overall performance. You may use a broad-sword approach and benchmark your application every hour to model the key performance indicators such as access and response time, login time, transaction completion time, and so forth. You can then feed this data into your performance management process, which is mastered or governed by a capacity model of some sort . It's all very theoretical, so refer to Figure 14-1 to see how all these processes fit together.
Capacity management is the key to all things related to performance and scalability. Without this, you have no process, and you have no structure. When considering a profiling and benchmarking approach to your WebSphere environment, you should always start out with a plan of what it is you're trying to achieve. This forms the basis of capacity management. Whether this is in the form of a spreadsheet or some other medium doesn't matter; however, Table 14-1 summarizes the basic format of a capacity management approach.
| Management Phase | Development Phase |
|---|---|
| Benchmarking | Development and systems integration environments |
| Profiling | Systems integration, quality assurance, and production shadow environments |
| SVT | Production shadow or preproduction environments |
As mentioned, you'll need to understand what it is you're trying to achieve. That is, what do you want to measure and manage? Are you looking to measure a static environment to manage performance within a fixed, known set of boundaries? Or, are you looking to measure a dynamic environment that changes from day to day based on marketing campaigns , product releases, and organic growth?
The following key points should make up your approach:
-
Plan approach: What is it you're trying to measure and why? As I mentioned earlier, you need to understand what your motive is for managing your capacity of your environment. Is it cost, performance, scalability, or process driven?
-
Create plan and model: After planning your approach, invest time and effort into creating your environment capacity and performance models. The best tool to use in this case is a spreadsheet. They can be powerful tools for modeling and statistical analysis purposes. The model should be a representation of the approach you created. The approach should therefore include the key inputs, key items to measure (in other words, processor, network, disk capacity) and how you plan to measure. For example, what's the frequency of your sampling of performance input or profiling? The model should include a performance, capacity, and scalability baseline from initial benchmarking and profiling or, better still, proper SVT.
-
Implement approach: Roll out your approach, including your measurement, profiling, and benchmarking tools to start feeding into your capacity model. At this point, you'll iterate on a defined period or frequency, inputting the data from profiling and benchmarking into your model.
This is a high-level approach, but it gives you an idea of the steps involved and where profiling and benchmarking fit into a capacity management process.
EAN: 2147483647
Pages: 111