Monitoring Network Performance
Network performance is the third of the "big ticket performance items" mentioned in this chapter. Because WebSphere is by nature a distributed computing platform, network connectivity is an important aspect of the overall WebSphere performance model.
This is more important for local area networking communications. That is, components such as database servers and Web servers must be able to communicate to one another with little latency and high throughput.
In the following sections, you'll look at system tools that allow you to monitor and diagnose network bottleneck issues within your WebSphere application server environment.
Network Performance: Unix
A number of commands within Unix operating systems provide an output or view on the status of the network interfaces and their utilization. In fact, this part of monitoring a Unix system's performance is relatively straightforward. There are two groupings of features you'll want to know about. First, you'll want to know about the network utilization in and out from your WebSphere server network interface ports. Second, you'll want to know what errors are occurring on the network (physical and logical).
Network Utilization: Unix
Network utilization is just like any other form of utilization calculation. It's the percentage used of the practical (or theoretical) maximum available. That is, if you have a 10 megabits per second (Mbps) network, you can theoretically support a throughput rate of approximately 80 percent of the network capacity. In reality, however, your mileage will vary considerably because of your network interface card quality, switch or hub quality and load, distances, wire quality, packet and protocol overhead, and so on.
As a rough guide, using 10 percent of the Mbps ratio will give you a fairly practical throughput rate. For example, a 100Mbps network would mean that you can reach 10 megabytes per second (MBps). Therefore, if you were transferring at 300 kilobytes per second (KBps), which is 0.3MBps, over a 10Mbps network, you'd be operating at a rate of approximately 33 percent of the network capacity.
For Linux, Solaris, and AIX, it's possible to use the netstat -i command to obtain network performance statistics. You'll look at this command in more detail shortly for errors; however, it's limited when it comes to calculating network traffic in and out (it only shows packets in and out for most Unix operating systems).
So, what you need to monitor is the ability to capture periodically the amount of traffic transferred in and out of a network interface.
Therefore, for three Unix operating systems, the following commands are available on each Unix flavor to obtain the network traffic in and out:
-
AIX: You can use entstat (in usage, it's entstat -d ent x ). This tool shows a range of network interface statistics for Ethernet-based interfaces on AIX.
-
Solaris: You can use netstat (in usage, it's netstat -k grep bytes ). Using the netstat command and an undocumented feature of Solaris netstat , you can obtain network bytes in and out of an interface. You'll only care about the rbytes and obytes (receive and send) elements.
-
Linux: Linux, by its nature, has a number of tools to use. The more popular methods are to use the Internet Protocol (IP) firewall accounting polices included in the kernel or to use a third-party GNU product such as IPTraf.
You'll now look at how to calculate the utilization rate of a network. As I've said, it's very straightforward. Based on a ten-second interval and what you know about the practical speed of a 100Mbps network, you can assume that over ten seconds, the practical maximum that can be transferred (half-duplex) is approximately 89MBps.
So, if you had a network that at the epoch of your test was baselined at "x" for inbound bytes and "y" for outbound bytes, then obtained the reading for epoch +10 seconds, and took the derivative of those results over the practical maximum of our network, you'd have a utilization figure. Table 13-2 shows the results.
| Test | In Bytes | Out Bytes |
|---|---|---|
| Epoch + 0 | 857,660,792 | 2,605,030,577 |
| Epoch + 10 | 858,013,025 | 2,605,091,769 |
The difference between the first and second test for the in bytes is 352,233KB and 61,192KB for the out bytes. Therefore, the utilization of the network (in other words, the difference of epoch + 0 in and out and epoch + 10 in and out) is 44 percent. Over time, this test could be refined and fed into a tool such as Multi Router Traffic Grapher (MRTG), discussed in Chapter 14, for graphing or exported to Microsoft Excel for analysis.
The key with this test is to use one of the Unix tools to obtain the in and out bytes, place them in a script, and loop the script indefinitely for monitoring and historical analysis. The script might look like this:
#!/bin/ksh logfile=/tmp/networkStatistics.log while : <run your network data collection script here> >>$logfile sleep 10 done
It seems simple, but it'll provide you with the raw data to graph and model.
| Note | You could send the output from this script to MRTG to plot the utilization over time. |
So, what constitutes a high utilization? From my experience, as soon as a network starts to exceed 40 percent utilization, there will be performance loss.
This is evident with the ping tool that, although not the most scientific of tools, does provide a fairly good gauge of when a network is underperforming. On a local area network, pinging a remote machine (such as the database server) will produce a timing result that should be no higher than 5ms for Ethernet networks. Beyond this, there's something in the network that's not right. Where the ping tool falls down is that the undesired result could manifest from the remote server being underloaded or a network or router being overloaded. Use the ping tool as a secondary tool and be careful not to place all your bets on it.
To summarize, although these tools are helpful and can help you get an understanding of what the state of play is with your network, they need to be used constantly. Running these network utilization tools on an ad-hoc basis starts to decrease their reporting value. What you want is to be able to have an always-running test that's logging and tracking the network utilization so you can build up a historic view of how your network performs . By having the historic view of the network's performance, you can then go and run the scripts on an ad-hoc basis if you want to get a snapshot of the current utilization and compare it with averages or historic utilization information.
Finally, many Unix vendors have centralized management software packages that come with network monitors and utilization trackers (AIX has the Tivoli Performance tool, and Sun has Sun Management Center). It's worth taking a look at these tools to see if they fit your needs.
Network Errors: Windows and Unix
Errors on a network are going to be caused by a huge range of issues. The most common form of error is the physical error. This type of error is typically caused by poor or faulty cabling, by bad connectors in your Fibre or CATx network cabling, or by running your cabling via noisy electronic interference ”for example, Universal Power Supplies (UPSs), air-conditioning units, lift motors, generators, and so on.
There are also the software-based errors. These are sometimes caused by the physical errors or are a side effect to the physical errors but can be attributed to the operating system's network stack, driver problems, collisions, and other anomalies.
When looking at your network performance reactively (probably because of an overall application performance issue), you should check if there are any reported errors with your network interfaces. The netstat command on all operating systems will allow you to output a high-level view of all network- related errors. For example, using the netstat command on Unix with the -i parameter will show the interface statistics on your server. On Windows-based platforms, you can use the netstat command with the -e parameter.
The output will show columns labeled Ierrs and Oerrs for AIX and Solaris, respectively, TX-ERR and RX-ERR for Linux and for Windows, respectively, or an output entry called Errors for both received and sent data.
There's no golden rule for error figures. As long as your error rate isn't constantly increasing, there's no error or problem with your network. If it's increasing, there's an issue somewhere within your network infrastructure ” either local to your server or somewhere out on the wire (for example, cabling, the switch or hub, and so on).
Table 13-3 highlights some additional commands that will provide more information in your environment to probe for network-related errors.
| Command | Operating System | Purpose |
|---|---|---|
| kstat -p -s "*err*" | Solaris 8+ | Shows all network-related errors on all interfaces. |
| netstat -d interface_name | AIX 4.2+ | Shows all network-related errors on specific interfaces ( interface_name ). |
| netstat -i interface_name | Linux | Shows all network-related errors on specific interfaces ( interface_name ). Other commands exist in Linux depending on your kernel build that provide more information. |
To test and view a Windows-based server for network errors, you'll want to use the Performance tool once again. Figure 13-7 highlights the Add Counters dialog box with the Packets Outbound Errors and Packets Received Errors counters being selected.
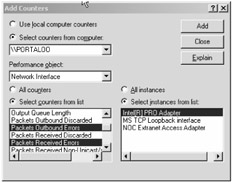
Figure 13-7: Adding network error counters
The output of the Windows server performance console is fairly self-explanatory. Similar to the Unix environments, a random error every once in a while isn't a major problem. It's only a problem if you monitor the console and see a constant rise in errors.
Be sure not to confuse these types of errors with collisions. To determine this, you'll need to obtain a more advanced application or tool to break up the different types of errors into the likes of carrier, collisions, protocol, and so forth or use the TCP and IP Performance Monitoring counters available. These two elements will provide TCP and IP monitoring that includes factors such as connection failures, correct datagrams, and socket retries. This may be helpful if you're trying to diagnose problems with your WebSphere application server dropping connections from a remote system (for example, running out of available local sockets).
If you're on a network that's based on a switched infrastructure (switched as opposed to shared via a hub) and you see errors increasing, chances are that the problem is a legitimate concern. Collisions are rare on switched networks but are common on shared networks.
| |
Many network interface cards and switches support a setting known as Auto-Negotiate or Autosensing configuration. This allows your network hardware to determine the optimal settings of your network infrastructure and autoconfigure the settings.
Although this is great for desktop or laptop computer network environments, for server environments this is a poor networking implementation or design. Using autonegotiated configurations can lead to performance and availability issues under high-load environments or when networking manufacturers' equipment isn't fully compatible with one another.
Always configure your network interface cards and network switches to force a particular network configuration, including duplex settings and network fabric speed.
| |
Network Utilization: Windows
As you saw previously, activating monitoring for network analysis under a Windows environment is straightforward. Looking at Figure 13-7 again, in order to activate network utilization monitoring, instead of selecting the Packets Outbound Errors and Packets Received Errors counters, select Bytes Total/sec counter.
This counter will give you an approximate utilization reading of your network interface. Be sure to change the scale of your plotting to 1 to ensure that you can match the network traffic against a 100 percent graph.
Networking in Windows is no different from Unix. In other words, network utilization shouldn't exceed 40 percent for sustained periods of time, and you should look at additional network interfaces or a faster network infrastructure if this limit starts to become a common occurrence.
Figure 13-8 shows example output from the Performance tool where a WebSphere application server is running in a Windows 2000 Server environment. The lab network for this example is a 10Mbps shared network environment.
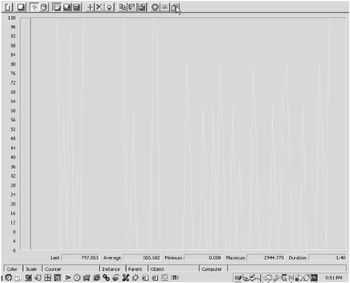
Figure 13-8: Network utilization output
If you look at the bottom of the figure, you'll see these four key values:
-
Last
-
Average
-
Minimum
-
Maximum
These values are helpful to get the accurate reading of the network's utilization statistics. You'll also see a fifth element, Duration. This final field is useful if you're tracking against a time factor. For example, it's useful to determine the number of collisions over a specific period of time.
| Tip | Remember to use the Log Report view of the Performance tool. This will allow you to view multiple systems at the same time (multiple WebSphere servers in a cluster, for example) to compare, log, and study the network statistics in a list format. |
EAN: 2147483647
Pages: 111