Tuning and Optimization
Let's now look at actually tuning the EJB and Web containers. Because of subtle differences between WebSphere versions 4 and 5, I've broken the discussion out by version. Generally speaking, both versions are quite similar, but WebSphere version 5's interface is different from WebSphere version 4's interface.
Before I begin, remember the golden rule about optimization: Tune/change one parameter at a time, test, document, and then start again. The worst thing you can do during a tuning and optimization effort is to go in and change a whole range of settings, save, restart, and test. This not only tunes settings that you may not need to tune (if it ain't broke, don't fix it), but also removes any clarity around what setting may have made the difference. For future reference, you want to be able to know what settings attributed to what performance improvements (or degradations!).
In the next section you'll examine the EJB container. It's important to note that the object request broker (ORB) is a key part of the EJB container's overall performance. This is primarily because client transaction requests are queued by the ORB (and routed) before being delivered to the EJB container itself.
EJB Container Tuning
To a point, you should really only bother with the EJB container if you are, in fact, using EJBs or EJB-JARs within your deployed applications. There are only a handful of "EJB container" settings, with most of the performance tuning from an EJB container perspective being carried out in other parts of the WebSphere configuration interfaces.
| Note | Remember that there's no use tuning something that's not being used ”it's a waste of your time! |
In fact, the ORB itself plays a key role in the performance of the EJB container. The ORB receives requests from EJB clients and the requests are queued in the ORB thread pool (which I discussed in Chapter 7).
The next sections cover the minimal tuning aspect of the EJB container for WebSphere versions 4 and 5. I discuss the settings, what they mean, and where they're located. Following that, I discuss the tuning aspects of the various settings, most of which are common between WebSphere versions 4 and 5.
WebSphere Version 4 EJB Container Tuning
The EJB container in WebSphere version 4 doesn't provide a vast range of available options. As I noted before, the EJB container is really not optionable. Most of the settings that affect EJB performance are driven by the JVM. Further, remember that one of the powerful features about EJBs is that they allow the developer to focus on the development of application code, rather than the plumbing. Therefore, in theory and in line with the transparent, automagical EJB container layered interface between EJBs and EJB clients, the WebSphere "engine" should take care of the plumbing and dynamic tuning for you.
Let's first look at where to find the settings. Figure 9-4 is a screen shot of the WebSphere version 4 administration console. Notice on the right side of the screen the section highlighting the EJB container option under the Services selection tab.
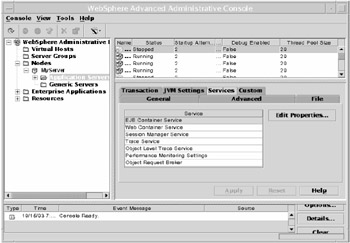
Figure 9-4: WebSphere version 4 administration console
You'll note that you can access the EJB container for any application server by following these steps:
-
Right-click the application server you want to view or modify.
-
Select Properties from the pull-down tab or click the desired application server, which changes the right administration console pane to offer the main configuration items available.
-
Select EJB Container Service.
-
Click Set Properties.
Once the EJB Container Service dialog box appears, you'll notice just how few settings there are, as shown in Figure 9-5.
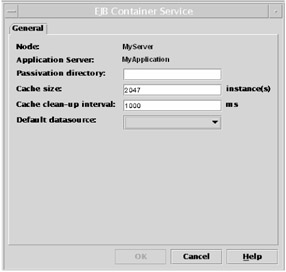
Figure 9-5: EJB Container Service dialog box in WebSphere version 4
As you can see, there are three settings available. Table 9-1 lists these settings and provides a brief description of each.
| Option | Description |
|---|---|
| Passivation directory | Directory used by WebSphere to store passivated session enterprise beans |
| Cache size | Value that determines how many cached EJBs can be resident in the local EJB cache at any one time |
| Cache cleanup interval | Value that determines the threshold when cache cleanup will occur by the EJB container cache manager |
I discuss tuning these settings shortly. Let's now look at what is available and where in the WebSphere version 5 EJB container settings.
WebSphere Version 5 EJB Container Tuning
WebSphere version 5 operates in much the same way as version 4 in terms of the EJB container. Most of the tuning and dynamics of the container are managed by the application server itself, which is in turn managed by other defined settings, such as those from the ORB, the JVM, and so forth.
To access the EJB container settings in WebSphere version 5, simply follow these steps:
-
Ensure that the server's node is expanded and showing the link to Application Servers.
-
Click the application server item of your choice.
-
In the right pane, select the application server you want to modify.
-
Halfway down the screen, you'll see a link labeled EJB Container. Click this link.
-
You'll then be presented with the various options for the EJB container.
Figure 9-6 highlights the WebSphere version 5 console after the preceding selections have been made.
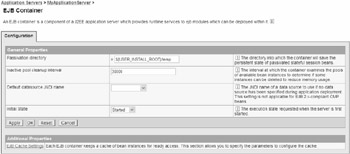
Figure 9-6: EJB container services in WebSphere version 5
Let's now look at what to tune and when.
Tuning the EJB Container
Both versions of WebSphere are fairly similar in their EJB container configurations. Essentially , you have four primary options you can use to optimize or tune the container:
-
Passivation directory
-
Inactive pool cleanup variable
-
Cache size
-
Cache cleanup interval
Let's look at each option and the most appropriate ways to optimize it.
Passivation Directory
The passivation directory is the location or directory where WebSphere will persist (save) stateful session EJBs.
When the EJB container needs to reclaim memory space, the container spawns a thread that serializes the appropriate session EJBs and persists them to a file on disk. In the event that a request is made to reuse the passivated session EJB, the EJB container deserializes it and pushes it back into the EJB container cache.
The key performance point here is where those persisted EJBs are stored and what they're stored on. If you set this option to use slow spinning disks or disks that are already heavily used by other I/O- intensive processes, you'll find that your EJB container, when under load, will perform badly .
Some rules of thumb for using the passivation directory are as follows :
-
Ensure that this directory is on a relatively low-load disk or series of disks.
-
Configure your file system, if possible, to use small file byte size allocations (e.g., in Unix, smaller bytes-per-inode are good for this setting, such as 1024 or 2048). This setting really depends on the size of your passivated session EJBs. Try to match them up if you're expecting a high passivation rate.
-
Don't store this directory on a shared file system, such a Network File System (NFS) or Server Message Block (SMB) file system.
You should avoid having a high passivation rate. This means that there's some sort of memory shortfall somewhere, most likely in the cache settings for the EJB container. Memory is faster than passivation, so look to increase memory rather than rely on passivation.
At the end of the day, passivation is analogous to swap or virtual memory. It's good to have and useful to implement, but you want to avoid using it on a regular basis. Doing so means that there is a shortfall elsewhere and overall performance will be degraded.
Inactive Pool Cleanup Variable
Over the course of an EJB container or application server operating, you'll invariably build up junk that isn't needed. This includes enterprise bean instances that may be left lying around for one reason or another. You use this setting to help reclaim memory space by clearing out pooled bean instances that aren't used or haven't been used within a period of time.
This setting has an effect on the utilization of passivation. If bean instances ” specifically , session bean instances ”are lying around in container memory space, they'll be persisted, which will consume processing resources. It's best to set this value to an integer setting greater than 0 milliseconds to make sure that housecleaning is performed.
The catch is that you don't want to set this value too low, which will clear out instances that will only be re-created from scratch again shortly. At the same time, though, you want to ensure that you do clean out the space so that you don't consume valuable cache memory.
As a rule of thumb, set this value to be 10 times that of the cleanup interval setting. For example, if you set your cleanup interval to 5 seconds (5,000 milliseconds), you should set your inactive pool cleanup variable to 50 seconds (50,000 milliseconds).
| Note | Because of the transactional nature of stateful EJBs and the manner in which the EJB container will passivate their state, it's important to consider time-out settings. Understand that incorrectly setting a time-out value will affect the capability of the EJB container "reaper" thread to satisfactorily clean up unwanted stateful session beans. You can set the time-out value within the Application Assembly Tool (ATT) prior to deployment of your EJBs or via manual modification of the EJB deployment descriptors once the stateful EJBs have been deployed. |
Cache Size
The cache size setting refers to the number of cacheable objects in memory at any one time. WebSphere terminology refers to this as buckets , with buckets indicating the number of buckets being consumed by cached EJBs. This bucket list is, in fact, a hash table of sorts. Each bucket is just an entry to another EJB in the so-called cache.
As you can appreciate, the more buckets you have, the more memory is consumed by cached EJBs. If you set this value to, say, 5,000, and it's full, this will consume a great deal more memory than if you set it to 2,000. This comes back to the need for careful capacity planning and modeling. If you know that your EJBs will consume 200KB of memory each, and you have 10,000 of them in memory, you'll need at least 1.9GB of memory to store these EJBs.
The way to work this value out is to determine how many concurrent users you'll have active on your system at any one time and then multiply that number by the number of EJBs required or used within each user 's functional transaction. If you're using session EJBs, add into this figure the number of active session EJBs at any one time. For example, you may have 1,000 concurrent users, and each standard transaction uses two EJBs. Occasionally, other EJBs are used, so you can use a value of three EJBs per functional transaction, which with 1,000 concurrent users would require 3,000 buckets in the cache size.
Cache Cleanup Interval
The cache cleanup interval is analogous to garbage collection within the JVM. This interval setting is used to clean out unwanted (as opposed to unused) items from the EJB container cache. Similar to the previous settings, this directive should be run only when appropriate ”that is, not too frequently, but frequently enough so that when the job operates, your container isn't spending too much time processing old cache data.
As a guide, this setting should be 10 times less than the inactive pool cleanup variable. Therefore, if the inactive pool cleanup variable is set to 50,000 milliseconds, the cleanup interval setting should be 5,000 milliseconds.
You may find that tuning this setting slightly by 10 times either side of the value (e.g., 10 times less or more) may make subtle differences to the operational performance of your platform, but for most cases this thumb rule will work well.
Web Container Tuning
The Web container provides several more configuration items as standard, with the Session Manager settings being a separate component. Compared with the basic settings of the EJB container, the Web container provides more options for tuning the performance and processing characteristics.
The main types of elements that the Web container allows you to alter are directives around network queues and associated settings. These types of settings allow you to limit and control (and ultimately tune) how many connections your Web container should handle and what sort of transaction characteristic it should expect.
Let's take a look at the various options and configuration items available within the Web container.
WebSphere Version 4 Web Container Tuning
The WebSphere version 4 Web container settings are found via the same path as the EJB container settings. There are two ways to access them (through the console). Note that you can access the Web container for any application server by following these steps:
-
Right-click the application server you want to view or modify.
-
Select Properties from the pull-down tab or click the desired application server, which changes the right administration console pane to offer the main configuration items available.
-
Select Web Container Service from the list components .
-
Click Set Properties.
At this point, a dialog box will appear with three tabs at the top, as shown in Figure 9-7.
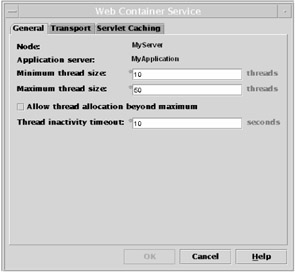
Figure 9-7: The Web Container Service dialog box in WebSphere version 4
The tabs General, Transport, and Servlet Caching provide the links to the main controls of the Web container configuration. I discuss the optimization and tuning approach for these settings shortly. First, though, the next section presents an overview of the WebSphere Web container settings for WebSphere version 5.
WebSphere Version 5 Web Container Tuning
Like the WebSphere version 4 configuration dialog box entry screens, the WebSphere version 5 HTTP-based console provides an easy way to configure your Web container settings. The key difference is that the Web container settings for WebSphere version 5 now encompass the session management settings. This section, however, excludes the session management settings, as I discussed them in Chapter 7.
Let's look at how you can access the container settings. Figure 9-8 shows a screen shot of a WebSphere version 5 console.
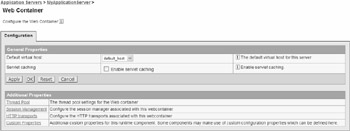
Figure 9-8: Web container services in WebSphere version 5
Figure 9-8 shows the right side of the WebSphere administration console after drilling down to the example application server's Web container settings. Follow the next steps to access the Web container settings. Use Figure 9-8 as a guide and use the breadcrumb navigation at the top of the right pane to help you understand where you're situated within the console.
-
Click the Application Servers link in the left pane.
-
Click the application server whose Web container you want to view or modify.
-
Scroll down the screen. In the right pane, you'll see a link labeled Web Container. Click this link.
At this stage, you're located in the Web container for your chosen application server. Keep an eye on the breadcrumb navigation at the top of pane to orientate you.
Instead of tabs, as in WebSphere version 4, you have four option links that provide access to Thread Pool, Session Management, HTTP Transports, and Custom Properties. I'll focus on the Thread Pool and HTTP Transports settings here.
Let's now look at modifying and optimizing the Web container.
Tuning the Web Container
As discussed earlier, the Web container is a fairly tunable component within your WebSphere application server. In this section, I discuss several key items that you should tune in order to maximize performance for Web-based components.
Keep in mind that because the Web container is "up the line" from heavy components such as EJBs and the database, if the Web container is performing poorly, then the rest of the environment will also perform poorly.
There are four key items you should tune to improve Web container performance:
-
Thread size/thread pool
-
Maximum keep- alive connections
-
Maximum keep-alive requests
-
Keep-alive I/O time-out
Configuring these four items is slightly different in each version of WebSphere. In the following sections, I highlight the configuration method for each of the settings.
Thread Size
As I discussed in earlier chapters relating to queues, thread size refers to the number of threads that are being processed by the Web container. In theory, this value is the number of elements, such as servlets and JSPs, being processed by the Web container.
With the value set to 25, your Web container can be processing a maximum of 25 JSPs and/or servlets at any one time. This value is arbitrary by itself and can only be set while within the context of your application's performance and transaction characteristics. This means that setting this value is about understanding the results of the queue modeling you did back in Chapter 6 as well as understanding your concurrent user load.
If you have a single WebSphere application server operating a single application server (hence, a single Web container), this value will be straightforward to set. If, on the other hand, you're running multiple WebSphere application servers, all of which are operating multiple cloned application servers (hence, many Web containers), this thread size value will be harder to set because you'll need to understand your total transaction rate, the rate at which requests are being sent to each server (e.g., are you using a weighted configuration in your HTTP plug-in?), and the length of time that the transactions are taking place.
To understand this value better, ensure that you use the Resource Analyzer (WebSphere version 4) or the Tivoli Performance Viewer (WebSphere version 5) to monitor both the Percent Maxed and Active Threads values.
| Note | See Chapters 13 and 14 for information on how to use the Resource Analyzer and Tivoli Performance Viewer tools. |
My recommendation is to set this value to a setting 50 percent greater than your estimated number of concurrent users and, by using the Resource Analyzer or the Tivoli Performance Viewer, work your way down until your active threads are within 80 percent of the maximum thread size. Operating at 80 percent thread pool size means that you have room to move if you have an unforeseen peak, but at the same time you aren't wasting previous CPU cycles or memory.
As a rule of thumb, if your thread size looks like it will exceed 100, consider cloning and running multiple application servers instead. Trying to push too many threads through your Web container (i.e., your JVM) could result in bigger picture performance issues.
Keep in mind that your EJB container, with a setting of 100 threads in your Web container, will typically require between 50 and 75 threads. Therefore, with 100 threads active in your Web container and up to 75 in your EJB container, plus in-flight threads from the ORB and other resources, your JVM will be fully occupied.
To set the thread size value in WebSphere version 4, follow these steps:
-
From the Web Container Service dialog box, select the General tab.
-
In the Maximum thread size directive entry section, enter your desired value.
-
Select OK and then Apply. You'll need to restart your application server for the changes to take effect.
To set the thread size value in WebSphere version 5, follow these steps:
-
From the Web container section in the right pane, click the Thread Pool link.
-
In the Maximum Size directive entry box, enter your desired value.
-
Select Apply and OK, and ensure that you save your settings.
You'll notice a check box that allows you to let the threads go beyond the maximum limit. I recommend you never use this setting. Doing so will only open up your applications to bigger problems, and it's better for your customers to be able to sit in the network queue than experience a flaky or crashed environment.
| Caution | In WebSphere version 4, the default manner in which the ORB handles threads is to let them grow uncontrollably ” there's no limit. To ensure that the threads don't run away and bring a system down, you can use specific JVM parameters to curb this undesired characteristic. The value for curbing this problem is -Dcom.ibm.ws.OrbThreadPoolGrowable=false . |
| Tip | You can use an additional WebSphere version 4-specific parameter to help improve the ORB performance: -Djavax.rmi.CORBA.UtilClass=com.ibm.CORBA.iiop.Util . This parameter will essentially replace the standard UtilClass that comes as part of the core J2EE class packages with an IBM optimized version. |
Maximum Keep-Alive Connections
This setting drives the number of keep-alive connections held open between the Web server plug-in and the Web container, or any other direct connecting Web-based interfacing client. Using keep-alive connections means that your server operating system (and, to an extent, WebSphere) isn't having to open and close connections constantly between the Web server tier . The purpose here is to ensure that connections are maintained for as long as possible. The key is to avoid having your server bogged down with TIME_WAIT states.
A rule of thumb here is to ensure that the number of TIME_WAITs between your Web tier and your application server doesn't exceed 15 to 20 percent of the total Web container thread pool. For example, if your thread size is set to 50, you shouldn't see any more than ten connections in a TIME_WAIT state.
| Tip | You can find out the value of how many connections are in TIME_WAIT state by using the netstat command in both Unix and Windows. Make sure you select values only from the output between your Web server(s) and your application server. |
This setting works similarly to pooled connections to engines such as databases and legacy systems, in which the opening and closing of connections is expensive (resource-wise). Therefore, the best approach is to try to keep connections open for a longer period of time and reuse them.
Overall, this value can't exceed 80 to 90 percent of your Web container thread size. Each connection will consume a thread, and to ensure that you always have spare threads available, keep this value within those bounds. For example, on a system with a thread size of 50, the maximum keep-alive connections value should be set between 40 and 45 (80 percent and 90 percent, respectively). For a system with a thread size of 75, this value should be set between 60 and 67.
To set this value in WebSphere version 4, follow these steps:
-
From the Web Container Service dialog box, select the Transport tab.
-
In the Maximum keep-alives per request option, enter your desired value.
-
Select OK and then Apply. You'll need to restart your application server for the changes to take effect.
To set this value in WebSphere version 5, follow these steps:
-
From the Web Container section in the right pane, click the HTTP Transports link.
-
Select the Host Line Entry applicable to the Web container you want to modify.
-
Scroll down the right pane and select Custom Properties.
-
If you don't already have a value in the right pane labeled MaxKeepAliveConnections, click the New button. If you already have the value there and want to change it, click the MaxKeepAliveConnections setting.
-
A new screen will appear with three empty boxes. In the Name field, enter the directive property MaxKeepAliveConnections .
-
In the Value field, enter the setting for this option (e.g., 60 ).
-
Click Apply and OK, and then save your settings. You'll need to restart your application server for the changes to take effect.
This is an easy setting to monitor and test using the Resource Analyzer or Tivoli Performance Viewer tool. Ensure that you've stress-tested and volume- tested this setting before moving into production.
Maximum Keep-Alive Requests
This setting ultimately determines how many connections can be open to process and transfer data, such as HTML, images, and so forth. Over each keep-alive connection, it's possible to send many requests.
After the defined number of requests has been sent over the keep-alive connection, the connection is terminated and reestablished. This helps to ensure that resource or connection starvation doesn't take place and that there isn't an "open door" to resource utilization. Indirectly, this also helps prevent various DoS attacks, by ensuring that there isn't a constant open connection available.
If you're able to ensure that only requests from a specific Web server and plug-in will connect to your Web container (via the use of port blocking, stringent controls, etc.), this setting can be increased to quite a high value to improve performance. By default, the value is set to 100, which means that at full utilization, there will be x number of keep-alive connections active, with y number of requests, or x multiplied by y .
If your WebSphere applications are fairly Web intensive and have a lot of components within the presentation such as images and other items, increasing this setting will increase the performance, because the container won't be closing the keep-alive connections down as frequently.
My recommendation is to use a rule of setting this value to 2.5 times that of the thread size ”meaning that with a thread size of 50, you would set this setting to 125. There is no upper recommended limit. However, be aware that the higher this value is, the more requests can come through from a DoS attack. Be sure to consider port and or route blocking so that only known servers can connect to this interface.
You need to be aware also of the fact that if your presentation consists of many images and elements in your interface output, you may need to look at the number of open files available to the operating WebSphere user process (e.g., ulimit on Unix). If this setting is too low and there are too many requests being made over the keep-alive connections, your output will quickly become broken with missing images and elements.
To make the changes to this setting in WebSphere version 4, follow these steps:
-
From the Web Container Service dialog box, select the Transport tab.
-
In the Maximum requests per keep-alive directive entry section, enter your desired value.
-
Select OK and then Apply. You'll need to restart your application server for the changes to take effect.
To make the changes to this setting in WebSphere version 5, follow these steps:
-
From the Web Container section in the right pane, click the HTTP Transports link.
-
Select the Host Line Entry applicable to the Web container you want to modify.
-
Scroll down the right pane and select Custom Properties.
-
If you don't already have a value in the right pane labeled MaxKeepAliveRequests, click the New button. If you already have the value there and want to change it, click the MaxKeepAliveRequests setting.
-
A new screen will appear with three empty boxes. In the Name field, enter the directive property MaxKeepAliveRequests .
-
In the Value field, enter in the setting for this option (e.g., 125 ).
-
Click Apply and OK, and then save your settings. You'll need to restart your application server for the changes to take effect.
Keep-Alive I/O Time-out
The keep-alive I/O time-out setting allows you to control how long keep-alive connections should wait for I/O before timing out and closing the keep-alive. This setting is closely coupled with the previous two settings, MaxKeepAliveRequests and MaxKeepAliveConnections. The time interval between I/O or data flow over a keep-alive connection constitutes the trigger for this setting.
If the value of the keep-alive I/O time-out is reached, that particular keep-alive connection will be closed. This helps prevent the available connection list from filling up and running out of free connections for new or additional customer requests. However, the opposite can also happen, whereby lengthy transactions may hold open a keep-alive for a longer period of time, in which case you don't want the connections to be closed prematurely.
Like most of these types of settings, it's a balancing act. On one side you have resource exhaustion, a situation in which you may be running out of free connections if the keep-alive I/O time-out is set too high, and on the other side, you have transactions failing or poorly performing as connections are prematurely closed on them. In most cases, applications with Web components will be able to complete their transactions in under 10 seconds. If, however, you have slow links, overloaded servers, or an unusual application transaction characteristic, this setting will be important.
You can use the Resource Analyzer or Tivoli Performance Viewer tool to understand if your Web transactions are triggering I/O time-outs on your keep-alive connections. In the Web Container drop-down of these tools, ensure that you are collecting data on the "aborted connections" data collection element.
If you see that the aborted connections value is greater than 5 to 10 percent of the total closed connections, you may need to look to increase the keep-alive I/O time-out setting. As a guide, for normal operations, the default setting of 5 (seconds) is usually sufficient. I've seen cases in which this setting has been required to be set higher than 15 seconds, but this is unusual.
The basic rule for this setting is to ensure that you have it correctly tuned for your application. There is no golden rule or magic calculation you should use other than testing and analysis. You can perform a sanity check by saying that with, for example, 100 connections available in your Web connection request pool and an idle time-out of 5 seconds, you can't exceed 1,200 lengthy transactions per minute (100 connections times 5 seconds, over 60 seconds). So, if you bank on the fact that all your connections will be completed within 50 percent of the I/O time-out, that being 2.5 seconds, you can say that your application environment is good for 2,400 requests per minute or 40 transactions per second (2,400 requests per minute divided by 60 seconds).
The point of this is that if you set your value too low, but your application does in fact have a long I/O interval as a normal operation, you'll need to increase the number of connection requests possible through your Web container and/or increase the I/O time-out value. If you don't do this, you'll have a bottleneck in your environment because it won't be able to process the required transaction rate.
As a guide, it's possible to set this value to 0, meaning that there will be no time-out whatsoever. However, like most infinite value settings, although it may be helpful from an operational point of view to set nonconstraining values, it does over time open the door to problems such as zombie connections. These types of issues will ultimately exhaust all available connections in your pools (this is analogous to a memory leak ”it isn't initially a problem, but over time it becomes one).
To make the changes to this setting in WebSphere version 4, follow these steps:
-
From the Web Container Service dialog box, select the Transport tab.
-
In the Keep-alive time-out directive entry section, enter your desired value.
-
Select OK and then Apply. You'll need to restart your application server for the changes to take effect.
To make the changes to this setting in WebSphere version 5, follow these steps:
-
From the Web Container section in the right pane, click the HTTP Transports link.
-
Select the Host Line Entry applicable to the Web container you want to modify.
-
Scroll down the right pane and select Custom Properties.
-
If you don't already have a value in the right pane labeled ConnectionKeepAliveTimeout, click the New button. If you already have the value there and want to change it, click the ConnectionKeepAliveTimeout setting.
-
A new screen will appear with three empty boxes. In the Name field, enter the directive property ConnectionKeepAliveTimeout .
-
In the Value field, enter the setting for this option (e.g., 5 ).
-
Click Apply and OK, and then save your settings. You'll need to restart your application server for the changes to take effect.
EAN: 2147483647
Pages: 111