| If you haven't figured it out already, the SBS world revolves around wizards that make your life simpler, and monitoring is no exception to that paradigm. Can you take a guess where such a wonderful wizard might be? On the To Do list, of course! Running the Monitoring Configuration Wizard To configure or modify the monitoring and alert features in SBS use the following steps: 1. | Open the Server Management Console. On the left pane expand Standard Management and then select To Do List. Scroll down to Management Tasks and click on Configure Monitoring to open the wizard, as shown in Figure 19.4. Alternatively, you can expand Monitoring and Reporting and click on Set Up Monitoring and Reports.
Figure 19.4. Monitoring Configuration Wizard welcome screen. 
| 2. | On the welcome screen click Next to open the Reporting Options screen (see Figure 19.5). To receive the daily performance reports via email, select the Receive a Daily Performance Report in Email check box.
Figure 19.5. Reporting Options screen in the Monitoring Configuration Wizard. 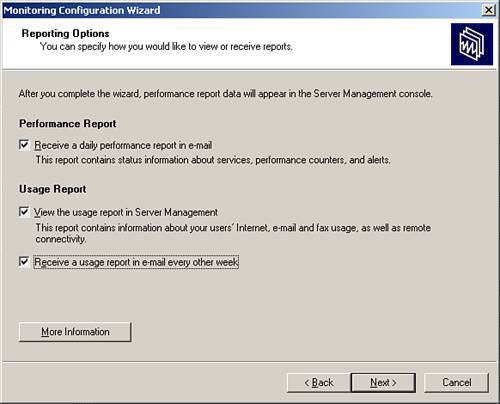
| 3. | To be able to see the usage reports in the Server Management Console, select the View the Usage Report in Server Management check box. If you also want to receive the reports every other week via email, select the Receive a Usage Report in Email Every Other Week check box, shown in Figure 19.5. Click Next.
| 4. | Type the email address that you want the reports sent to. If you want to send the report(s) to multiple addresses separate them using a semicolon. Click Next.
(Remember: Email addresses can be internal, external, or even distribution lists or public folders.)
| 5. | Select the groups that will have access to the usage reports over the intranet. By default only Domain Administrators have access to them. Click Next.
| 6. | To receive alerts via email, select the Send Me Notification of Performance Alerts by Email check box (see Figure 19.6). Type the email address that you want the alerts sent to. If you want to send the report(s) to multiple addresses, separate them using a semicolon. Click Next and finish the wizard.
Figure 19.6. Alerts screen in the Monitoring Configuration Wizard. 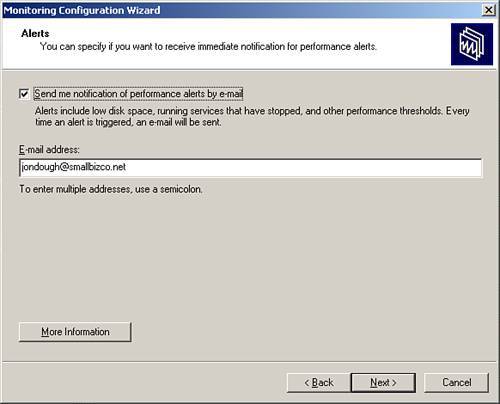
|
After you run the wizard for the first time, performance and usage data begins to be collected in a MSDE instance called SBSMONITORING. Depending on what reports you selected you will start receiving them by email soon. Alternatively, you can access the reports two other ways (if your user account has permissions to see them): From inside your network, open Internet Explorer and type http://sbs/monitoring/perf.aspx (for accessing the performance report) or type http://sbs/monitoring (for accessing the usage report). From outside your network, you can log in to RWW at http://mail.smallbizco.net/remote. Click on the last two icons in the main menu to see the reports (see Figure 19.7). Figure 19.7. Monitoring links on Remote Web Workplace. 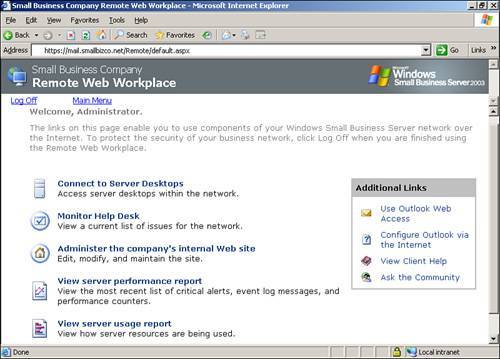
|