Creating a Presentation
When you first start PowerPoint, a blank presentation opens on your screen. Next you need to choose how you want the presentation to look by selecting a design, and add the content for your presentation.
| |
If you want to start a new presentation when you ve already been working with PowerPoint, click the task pane down arrow and choose New Presentation (or choose New from the File menu). In the New Presentation task pane, you can choose to start a new blank presentation, create one from a design template, use the AutoContent Wizard, or start a new presentation based on an existing presentation.
| |
Choosing a Design
Click the Design tool in the Formatting toolbar to display the Slide Design task pane (see Figure 10-3). This task pane presents you with a wealth of design talent you can apply to your own presentations. Scroll through the list, and click the one that fits the look and feel you want to portray.
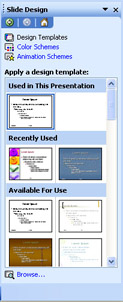
Figure 10-3: The Slide Design task pane displays all the professional designs you can use for your own presentation.
Adding Content
At any point in the process, you can begin to add content by clicking the Click To Add Here prompt and typing text. You can also add information by clicking the Slides tab in the Outline And Slides panel, and typing your slide text there. If you re relatively new to creating presentations, however, you may wonder what you should focus on. The AutoContent Wizard can help you create a general game plan for the details you ll fill in later yourself.
Getting Started with the AutoContent Wizard
But what if you re stumped about the type of information you want to include? The AutoContent Wizard can help you with that.
To start the AutoContent Wizard, display the New Presentation task pane and click From AutoContent Wizard. The wizard begins (see Figure 10-4) and walks you through the following four steps:
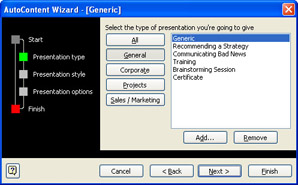
Figure 10-4: The AutoContent Wizard suggests topics, content, charts , and more for specific types of presentations.
-
Choose the category of presentation you want to create (General, Corporate, Projects, Sales/Marketing, or Carnegie Coach). Click Next.

Aha! ”Seeing Them All If you want to see all the types of presentations the AutoContent Wizard has to offer, simply click the All button to display the entire list. Click the one you want, then click Next.
-
Select the kind of output you will use for your presentation. Click your choice (for most presentations, you will likely use either On-Screen Presentation or Web Presentation), then click Next.
-
Enter a title for your presentation and, if you want to include a footer (which might include your company or department name ), type it in the Footer box. If you want the date and slide number to appear in the footer line, leave the options checked; otherwise , click the boxes to clear them and disable the options. Click Next.
-
Click Finish on the last page. The presentation is created and placed in the work area, ready for you to modify to your heart s content.
PowerPoint selects a design to fit the content of the presentation you ve selected, but you can change it to suit your tastes (see Choosing a Design, earlier in this chapter). Additionally, the wizard adds slide titles and suggested charts, bullet items, and more, to help spark your ideas about the specific content you d like to include.
Adding and Editing Your Own Text
When you start with a blank presentation, or choose a design template, the text prompts within individual slides say such things as Click To Add Title or Click To Add Text . To add text, simply click in the box and type whatever you want to add. Click outside the box to accept the addition. If you ve used the AutoContent Wizard to start the presentation, you ve got all kinds of text in your presentation. You can change the text in the presentation two ways:
-
On the slide, you can click the text you want to change. The text box highlights and the cursor appears. You can then highlight the text you want to replace and type the new text. The AutoContent text is replaced as you type.
-
When all the text for that slide is highlighted in the Outline pane, begin typing. This replaces all the text in that slide.
| |
If you accidentally erase more information than you intended to, press Ctrl+Z and PowerPoint will undo your last action.
| |
Adding Slides
The AutoContent Wizard fills up your presentation with slides of its choosing, but if you have created a blank presentation, or started with a design template, it s up to you to add your own slides. Here s how to do it:
-
Display the slide before which you want to add a slide.
-
Click New Slide on the Formatting toolbar. The Slide Layout task pane appears, offering you a collection of different text and content layouts (as shown in Figure 10-5). Click the layout you want to use.
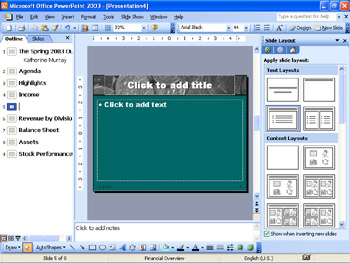
Figure 10-5: The Slide Layout task pane presents you with different slide choices for the one you add.
| |
You also can apply a new slide layout to slides you ve already got in your presentation. This is helpful as you go through and edit your AutoContent-generated presentation to convey the information that is important to you. To change the page layout using the Slide Layout task pane, simply display the slide you want to change and choose Slide Layout from the Format menu. When the Slide Layout task pane appears, click the layout you want to apply.
| |
Creating a Chart
Charts can be particularly helpful in presentations because they show data trends and concepts in easy-to-understand ways. When you want to add a chart to your presentation, follow these steps:
-
Begin by choosing a slide layout that has a chart placeholder in it.
-
Double-click the chart area to begin the chart-creation process. A bar chart is drawn by default, and a sample datasheet appears with dummy data already inserted.
-
Replace the data in the datasheet with your own information. Edit these cells the way you edit cells in Excel: click the cell and type the new information. Like an Excel spreadsheet, the column and row labels are used as the axis labels and the legend on the chart (see Figure 10-6).
-
Click the datasheet s close box to hide the datasheet and give yourself more room to work.
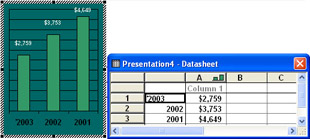
Figure 10-6: Enter chart data and labels in the datasheet.
| |
If you want to change the type of chart used to portray your data, click the Chart Type tool on the Standard toolbar. A palette of chart styles appears, and you can simply click the chart type you want to use.
| |
| |
PowerPoint allows you to import data into the datasheet if you want to use information you ve created in another program. Just click Import File on the Standard toolbar, and PowerPoint displays the Import File dialog box. Navigate to the folder storing the file you want to import, click the file, and then click Open .
In the Import Data Options dialog box, select the sheet you want to import; then tell PowerPoint whether you want to import the entire sheet, or only a selected range. (If you want to specify a range, enter it in the Range box.) Finally, if you want the incoming data to replace the existing data in the datasheet, leave the Overwrite Existing Cells check box selected. Click OK to import the data and have PowerPoint redraw the chart.
| |
Inserting Graphics
There are other types of visual aids you might want to add to your presentation. What about the architect s drawing of the new office? Or perhaps some clip art, or a few photos, would help liven things up a bit. Some people make the mistake of creating presentations that are simply pages and pages of text. But just as you need something now and then to break the monotony of reading page after page of this book, your audience will need a picture, a photo, or a splash of color every so often to give their eyes a rest, and help them pause a minute before they focus again on your words.
In other places in the book, you ve learned how to add clip art, so I ll just give you a quick refresher here:
-
Select or add a slide with a Content layout area. (The small cartoon fellow represents clip art on the layout choices.)
-
Click the Insert Clip Art tool in the Click Icon To Add Content area of the slide.
-
In the Select Picture dialog box, click the picture you want to use, and PowerPoint adds it to the slide.
| |
If you want to look for pictures that show something specific ”such as people, animals, or trees ”you can enter the topic in the Search text box and click Go. PowerPoint then displays all the clip art related to your subject. You can place the art by clicking it, and then clicking OK.
| |
EAN: 2147483647
Pages: 238