A High-Level Architecture for Reporting
| | ||
| | ||
| | ||
Remember, the initial step in any architecture effort is to understand the business requirements. The Lifecycle shows that business requirements determine the architecture, and the architecture defines product requirements. Standard report users business requirements should determine the functionality of the tool you use.
This section begins with an overview of the high-level business requirements for standard reporting and the architectural or functional implications of each of these requirements. With these requirements as a guide, we examine Reporting Services to see how well it fits into your reporting architecture. Its important to step back to consider reporting and analysis requirements because it may turn out that Reporting Services doesnt provide all the functionality your users need. You will need to gather detailed requirements for reporting and analysis as part of the requirements definition process. The functional list we provide here is not enough for you to do a rigorous product evaluation.
Reviewing Business Requirements for Reporting
The real, detailed business requirements will come from the requirements-gathering process. The steps outlined in this section are not a substitute for that process. However, its possible to identify some common, high-level business requirements for reporting. Create a mental image of your user community. The group includes people at all levels of the organization, with a broad range of technical skills. The common element is that theyre business focused. Theyre generally not that excited by technology and will rarely build their own queries from scratch. Theyre more interested in getting a quick answer to a specific business question than in working through an analysis process or figuring out the correct SQL syntax for a query.
Table 9.1 summarizes the major, high-level requirements of this group related to standard reports. A few of the major functional implications are listed for each requirement. Look at the second row of the table: In order to meet the business need to find reports , the DW/BI team will need to provide navigation, metadata, and search functions. Table 9.1 serves as a roadmap for describing the basic requirements for reporting and their architectural implications.
| BUSINESS REQUIREMENT | FUNCTIONAL IMPLICATIONS |
|---|---|
| Create reports | Variety of presentation formats (tables, charts , matrices, and so on) Powerful, easy, fast development tool to build reports |
| Find reports | Navigation framework Metadata Search |
| View reports | Access through a variety of methods User-initiated (for example, browser-based) System-initiated (for example, auto email) |
| Receive results in most useful way | Output to a variety of file types |
| Change report as needed | Parameters Drill down/additional attributes Linking |
| Solid, reliable system | Performance Scalability Management |
Lets look at each requirement in turn:
-
Create reports: As the business changes, business users will need new reports. These reports must present information in a way users can understand and use. Because we dont expect business users to create these reports themselves , the reporting tool must provide the developers with a range of alternative ways to display the information, including various tabular formats, pivots, and charts. The tool must be easy for the report developers and power users to use, allowing them to be as effective as possible. In most cases, only a few developers will be meeting the reporting needs of many users.
-
Find reports: Standard report users must be able to find the published report that answers the question at hand. The reports must be presented in an intuitive framework with good descriptions and clear, concise , easily accessible documentation. We described the idea of the navigation portal in Chapter 8, which provides the framework for users to navigate to the report theyre looking for. Users should be able to browse the metadata and search the report library for key words to identify reports that contain the information they seek.
-
View reports: Users must be able to view the information when and where they need it. At the very least, this means providing access to the reports on the organizations intranet. Users must be able to view a report in a browser, and print it out to take to a meeting. It might be important in some organizations to provide email delivery, saving to a file share, printing to a remote printer, or sending a fax. In some cases, the users come to the reporting environment and request, or pull, a report. In other cases, users want to have the report sent, or pushed , to them as soon as its ready or the underlying data has changed. Most organizations want both types of access.
-
Receive results: Users need to receive reports in the file format that is most appropriate for their needs. In many cases, this could simply be an HTML file. If a user wants to integrate the report with other information like a planning model, she may prefer a more sophisticated format like Excel. Users often want to view the report in one format and export it in another. There are at least a dozen common target file formats. Each DW/BI team will need to make sure it provides the ones that are important for its users.
-
Change reports: The term standard report doesnt mean completely fixed structure. Users need some flexibility in interacting with the reports. This is also true from a development point of viewit makes no sense to build a new report for every possible value of each attribute in the DW/BI system. The tool needs to provide the means to parameterize the report and customize its content to some degree. Parameters allow the user to enter a value or choose from a pulldown menu, and re-run the report to see the results based on the new selection. Parameterized reports let the user explore the data within the safety of the report structure.
Report linking provides a related level of flexibility. In a linked report, clicking on a row, column, or number will use the specific value selected to initiate a link to a related report or URL. The user can click on one of the product categories in a Sales by Product Category report that you have defined to link to a report displaying sales data for all the subcategories within the selected category.
The reporting tool should allow users to drill down to the next lower level of detail by letting them include additional attributes that were not displayed in the original presentation of the report. This drilldown may follow the natural hierarchies in the data, like drilling from year to month, or product category to product. It may also include the simple addition of another attribute, potentially even from another dimension in the business process dimensional model. For example, the report may start out showing sales by product. The user may want to include the gender attribute from the Customer table to see if certain products display gender preferences. A simple version of this drilldown involves showing and hiding data thats already included in the results set. A more complex approach allows the user to select additional attributes.
-
Solid, reliable system: All the requirements listed so far come from directly stated user requirements. Theres another list of requirements that users are generally unaware of, unless you fail to meet them. These requirements are about providing and managing an enterprise reporting service. They include functions like report library management, performance, and scheduling. Library management functions include providing ways for users to subscribe to a report (that is, sign up to have it pushed to them), and allowing users to check in their own reports (in a special area, of course). The reporting service must support processing functions like scheduling reports to run as soon as the data is available, and managing the performance of the report server. These management features are especially important if you have a heavy user load.
The business also has second-level requirements about things like security and reliability, but we are more concerned with direct business functionality at this point.
This brief business requirements and architectural implications review is one part of the architecture process described in this books Introduction. Clearly, this is only the initial pass at reporting requirements, and your organizations requirements will include additional functionality. In practice, you need to back up each requirements section with a more detailed description of the required functionality. For example, if you ask any tool vendor a question like Do you provide a variety of presentation formats? the answer, spoken in a loud, confident manner, will be Absolutely! Instead, list several detailed examples of how people need to see information. Make them tough, real-world examples and use them to test out the tools functionality and to give you a chance to see how difficult it is to work with the tool.
Examining the Reporting Services Architecture
The primary intent of Reporting Services is to provide a solid, scalable, extensible reporting infrastructure. This helps us understand the pieces of the architecture and how they fit together to become Reporting Services. Figure 9.2 shows the high-level architecture of Reporting Services and its operating environment.
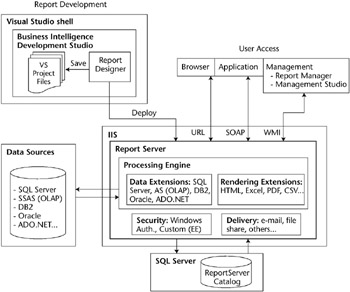
Figure 9.2: The Reporting Services architecture
The heart of Reporting Services is a stateless web service called the Report Server. It sits inside Internet Information Services (IIS) as an ASP.NET application. It was built from the ground up based on ASP.NET web services. (Web services are essentially applications hosted by a web server.) This means the functionality is accessible either through a browser pointed to the Report Server URL, or through an application using the SOAP API. The SOAP API allows developers to integrate reports seamlessly into other applications.
The Report Server communicates with its metadata store hosted in a SQL Server database called ReportServer. The ReportServer database stores all the information needed to define and manage reports. It is not the source for report data.
At the core of the Report Server is a Processing Engine that supports functions like sorting, filtering, aggregations, and conditional formatting. It has several components that are designed to be extensible: Data, Rendering, Security, and Delivery.
-
Data: A data extension allows the server to connect to a data source. Reporting Services ships with several data extensions, including SQL Server, Analysis Services, DB2, Oracle, and ADO.NET. ADO.NET indirectly provides access to a wide range of data sources that have OLE DB or ODBC drivers. Microsoft provides a set of APIs in the data extension space if you need to add a data extension of your own. If you have invested in an ADO.NET data extension, you can plug it into the Report Server.
-
Rendering: The rendering extension allows the processing engine to take a report defined in the Report Definition Language (RDL) and output it to any number of formats including HTML, Excel, PDF, CSV, and others. You can write your own rendering extension and add it to the list, but it is non-trivial because of the complexity of the formatting options in RDL. We expect third parties to develop rendering extensions for specific products like charting packages.
-
Security: The standard edition of Reporting Services relies on existing IIS and Windows authentication for security. If you have an application that is not using Windows Integrated security, you can support it through an extensible security component included in SQL Server 2005 Enterprise Edition.
-
Delivery: Reporting Services supports the distribution of reports in ways other than direct access to the web server. The delivery function allows you to send reports through file shares and email. This, too, is extensible, and partners have built other delivery options like fax and networked printers.
From a user access perspective, the upper-right corner of Figure 9.2 shows how Reporting Services provides three major methods for directly interacting with the server. Most users access the server through the web browser using a URL that points to the reporting service. As we described earlier, it is also possible to access the server through an application using SOAP APIs. The management functions are accessible through the Windows Management Instrumentation (WMI) provider objects. This is what the Report Manager uses from the browser or from the Management Studio to manage Reporting Services.
Overall, the Reporting Services architecture accomplishes its primary intentit is an extensible, scalable reporting infrastructure designed to meet the technical needs of a broad range of organizations, from small companies to large enterprises . While good technology is important, technical products succeed only if they meet business users needs. The next section examines the architecture from a business requirements perspective.
Using Reporting Services as a Standard Reporting Tool
The first section in this chapter outlined the business requirements for standard reporting and the architectural implications of those requirements. The next section described the basic architecture of Reporting Services. This section uses the list of functional implications in Table 9.1 as a means to examine the Reporting Services architecture from a business requirements point of view. Each section that follows takes a row in the table and explores how Reporting Services provides the needed functionality.
Creating Reports
The Report Designer in BI Studio is Microsofts primary development tool for creating Reporting Services reports. As we discussed in Chapter 3, the BI Studio lives in, and leverages the power of, the Visual Studio development environment. This means the person creating the reports is working in a software development environment. The report creator needs to know about words like debug, build, and deploy. Hell need to be able to create a data connection and write SQL. Its not a place for the faint of heart, and certainly not a place for the vast majority of end users. Report Designer allows developers to create reports, save them to the file system, and publish them up to the report server.
After the report is defined in Report Designer, the definition is saved in Report Definition Language (RDL), which is an open XML schema for defining all the components of the report. This includes the definition of the datasets; calculations like totals, expressions, conditional formatting, sorts, and filters; and layout of information including tables, pivots, charts, text, and formatting. When you publish, or deploy, a report to the Report Server, it writes the RDL out to the Reporting Services Catalog in an XML data type field in one of the metadata tables.
| |
You can see what the Report Definition Language looks like by opening up a report in a browser (look for files ending in .rdl). If you want to see the full XML schema, go to the beginning of the .rdl file and look for the URL of the namespace. It should be right after xmlns=. Copy the URL you see there into the address box of another browser window. You can see the entire XML schema of the Report Definition Language.
| |
| |
Microsoft includes Report Builder in Reporting Services. Report Builder is designed to allow business users to create simple ad hoc reports. Report chart. Are you seeing a simple pattern here? As Microsoft says in its marketing Builder limits users to a simple tabular report, a simple matrix, or a simple materials, Report Builder is not designed to be a full-featured data analysis tool. However, Report Builder reports are RDL files, so users can create reports and publish them to the Report Server (if they have permission). Reports created using Report Builder can be scheduled and managed just like any other Reporting Services reports. You can also use Report Builder as a query design tool to create the input datasets inside the Report Designer.
| |
Using a standard like RDL has huge implications for the reporting architecture: It separates report design from report execution. It means that anyone can create a tool that saves its report definition in RDL. At that point, the tool writer can take advantage of the Reporting Services infrastructure to manage, publish, distribute, and render the report. In fact, there are already several alternative report design tools available, including one from Microsoft called Report Builder.
The Report Designer meets the basic requirements for creating reports. Because Report Designer is oriented toward programmers, the solution to many problems is to write code of some sort rather than making a selection, dragging and dropping, or checking a box, as with the more end user-oriented tools used for creating reports. Of course, this is the universal tradeoff: power and flexibility versus ease of use. The nature of this tradeoff will become clearer later in this chapter when we create an example report. It will become (painfully) obvious when you begin working with the tool firsthand.
Finding Reports
After the developers have created and deployed a set of standard reports, users need to be able to find a report they want when they want it. Start by organizing the reports into categories that make sense to users, as we described in the section on creating the navigation framework in Chapter 8.
Microsoft has included a basic navigation framework as part of the Reporting Services product called Report Manager. The Report Manager plays two roles. It allows the developer to set some of the parameters and properties of the report server and the reports themselves. It can also serve as a simple vehicle to deliver standard reports interactively to the users.
Figure 9.3 shows the top level of a simple Report Manager home page. The interface is essentially a list of directories that follow the basic tree structure of the projects that have been deployed to the report server. This simple three-level hierarchy (Home/Project/Report) serves as the navigation framework for the user. You can add levels to this hierarchy by adding folders in the Report Manager or in the TargetReportFolder property of the Project Properties under the View menu of the Report Designer. When the report is deployed to the server, the project name is used to create a directory. To view a report, the user clicks on the project name and then on the report name .
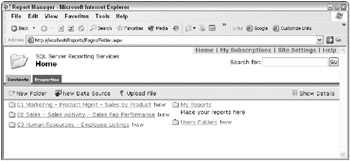
Figure 9.3: Report Manager home page
Figure 9.4 shows the three Sales by Product reports available when the user clicks on the 01 Marketing - Product Mgmt - Sales by Product directory shown in Figure 9.4.
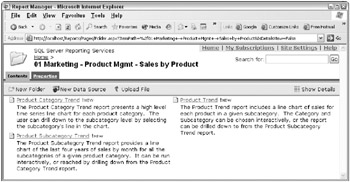
Figure 9.4: Reports in the Sales by Product directory
Under the covers, Report Manager is a web application that uses the SOAP and WMI protocols to provide access to the Report Server and its contents. Management Studio provides the same basic report management functionality for the developer as Report Manager does, but in the server manager interface. Accessing the Report Manager through Management Studio allows the developer to manage server and report properties, security, shared execution schedules, and jobs all through the object browser window. Used in this mode, Management Studio is strictly a management tool for the Report Serverit does not display the contents of the reports or provide the other user-oriented functions that Report Manager in the browser does.
Report Manager does provide many useful functions. Because its based on the file system directory structure, it allows the delivery of standard reports to the users as soon as theyve been deployed. It also provides some means for users to set up their own reports, subscribe to reports, and publish their own reports if they have appropriate permission. There is a search capability within the report site, which searches both the file names and description metadata in the Reporting Services catalog. Report Manager will also display parameter entry boxes and dropdown choice lists in the Report Manager header area, allowing users to enter their own choices and re-run the report. There is a Find function to search within the body of a report, which can be particularly helpful in large reports. Finally, users have the ability to export the report to a file in any of several formats.
In spite of all this useful stuff, Report Manager is a limited report delivery solution. You can customize its appearance by changing the color scheme and displaying your own logo. But at the end of the day the reports are still grouped by project and ordered by name. Beyond this, all of the features and functions described earlier are available through the API. The web service nature of the product will allow ambitious customers or third-party companies to write better navigation portals to the report library.
While it is far from a full-featured information portal, it does provide enough functionality to be considered a viable delivery solution. Even in the face of these (and other) limitations, many companies have successfully employed Report Manager as their standard report delivery vehicle.
Viewing Reports
After a user has found a report that seems like it might contain the needed information, he has to have a way to view its contents. This is known as a pull model, where the user finds the reports and interactively pulls the data from the server.
Users can view reports through any application that can access the report server, either through a URL with an Internet browser or through an application that uses the SOAP methods, like the Report Manager interface. Both allow easy integration of Reporting Services reports into existing portals or into custom-built or third-party applications.
The browser is the most popular tool for viewing reports. Using a browser means users dont need additional software installed on their machines and IT doesnt need to manage the software distribution and upgrade process. (Unless, of course, your users have browsers other than Internet Explorer, or they have a version of Internet Explorer not supported by Reporting Services.)
Figure 9.5 shows what the user would see in the browser as a result of clicking on the Product Subcategory Trend link shown in Figure 9.4.
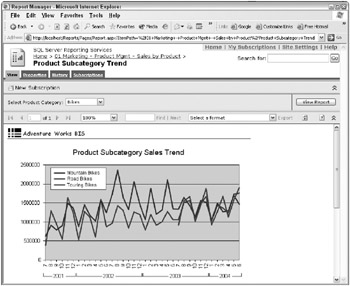
Figure 9.5: The Product Subcategory Sales Trend report
This example shows the report in the Report Manager interface. You can view the report directly in the browser without the Report Managers organizing structure. Youll see this direct access when we include a report in a simple portal structure later in this chapter.
The custom application approach to accessing reports might be something like an ASP.NET application built to integrate reports into a larger system that provides additional functionality. For example, a customer care system might use Reporting Services to display a customers purchasing and returns history to the customer care agent. On the same screen, there could be a button that would allow the agent to select a recent order and submit it to the transaction system to generate a Returned Merchandise Authorization.
Receiving Results
Reporting Services offers several delivery methods and file formats other than the pull approach described in the Viewing Reports section. Its helpful to look at these options in two separate categories: first in terms of delivery methods, and then in terms of formats.
The idea of the push model is to deliver the report to the user based on a predefined schedule. A user visits the reporting web site and finds a report that shed like to see on a regular basis. Clicking the New Subscription button takes the user to a set of pages for defining the nature and timing of the subscription. The subscription includes a schedule based on a time event or a data event. In the case of a time event, the report is distributed at a certain time on a periodic basis (at 8:00 a.m. every weekday, for example). In the case of a data event, the report is distributed whenever the underlying report snapshot is updated. The users can create their own subscriptions to reports theyd like pushed to them, or the Report Administrator can create shared schedules that send reports to a list of users. Initial releases of Reporting Services supported pushing reports out through email or to a file share. However, since this function is extensible, several companies are offering more push-style delivery options, like faxing and printing.
Reporting Services provides several output formats for exporting or subscribing to a report. These formats include Excel, XML, TIFF, PDF, CSV, and various HTML versions. Like the delivery mode, the format choices are extensible, although creating a new rendering extension is an involved project because the developer will need to translate the full set of RDL display capabilities into the target format.
Changing Reports
Static reports based on carefully identified business requirements often provide enough information to answer the question of the moment. In fact, some of the DW/BI projects weve been involved in provided user access only at the two ends of the flexibility spectrum: completely static HTML reports and blank slate ad hoc tools. This puts the BI front-end team in the business of continuously creating and publishing new reports to meet the changing needs of the business (but you often end up doing that anyway).
In many organizations, standard report users want the ability to make changes to a report without having to ask someone else to do it, or having to learn the complexities of the data model and the ad hoc tool. In most cases, it makes sense to provide users with the ability to customize the standard reports to meet their individual needs. Reporting Services includes several common functions that provide users with the ability to change a report, including parameters, report linking, drill-down, and content modification.
The report in Figure 9.5 includes a parameter at the top of the report section labeled Select Product Category. The parameter has been set to the value Bikes using a pull-down menu. A user can select a particular product category and then press the View Report button to re-execute the report. Well discuss some of the other functions for allowing users to interact with reports in the second half of this chapter when we step through the process of building a report.
| |
Once someone has removed a report from the Reporting Services environment, either through email or by directly exporting the report, access to the data is no longer managed by Reporting Services. Once users have the information in a file format, theres very little the DW/BI team can do to control what they do with it. This is one of the reasons the DW/BI system must have a clear security and privacy policy, and compliance with that policy must be monitored . See Chapter 12 for more details.
| |
Solid, Reliable System
Having a solid, reliable system is not the kind of business requirement you like to hear from your users. The only time they specifically mention this requirement is when previous efforts havent performed well or have been unreliable. Regardless of the history, you want the new version of the DW/BI system to meet expectations. This involves setting up the standard reporting process infrastructure, securing access to reports, and managing performance.
The process infrastructure is a combination of Reporting Services functions like shared schedules, and process metadata connections with the rest of the DW/BI system. You need to create a mechanism for initiating the execution of a set of standard reports when a particular ETL process completes. The process should implement simple logic like, When the nightly Orders update is finished, start these reports. Security is also part of a solid, reliable reporting system. After youve designed the report, you need to determine who has access to the report, when they can view it, and how they can interact with it. This can be accomplished through the Report Manager using role-based security. These roles can be managed through Windows security services in SQL Server 2005 Enterprise Edition, or through another security service by writing the appropriate extensions.
Performance is part of the system reliability job. If the report server is too slow, users will get frustrated. Reporting Services has several options for managing performance, including scheduling reports to be executed during low demand windows like early in the morning. You can set up a large report to execute on a regular schedule, and save its results in an intermediate snapshot structure. Users have fast access to the snapshot rather than re-executing the report itself. This option works well for the daily load cycle of the standard DW/BI system. Later in this chapter, we discuss ways to monitor performance over time to find opportunities for improvement.
Reporting Services Assessment
Overall, Reporting Services provides the basic functionality needed to create and deliver standard reports that will meet a majority of the business requirements. Because its oriented to developers, its more difficult to use than other reporting tools. Creating reports will take a bit longer. This is balanced by the flexibility of the programming paradigm. You can generally create a work-around to solve most any problem.
Reporting Services has limited functionality, particularly in the area of report layout controls. However, Reporting Services has already improved in its short existence and will continue to get better over time. Microsoft has competent folks who are interested in creating the best product they can. Theyre receiving feedback from a large number of users who have been more than happy to provide a long list of desired enhancements. One unfortunate side effect of this feedback loop is that most of the feedback comes from developers who want more programmatic functionality. We encourage you to provide your own business requirements-based feedback on how to improve the tool.
In a way, Reporting Services is a nobody ever got fired choice. The incremental cost and reasonable functionality make it an easy decision. With the addition of Report Builder, Reporting Services offers basic ad hoc query functionality to business users. However, most organizations will need another tool so business users can create advanced ad hoc queries and reports. The DW/BI team will need to support at least two tools and their associated metadata.
In some cases, bringing a second tool into the picture complicates the Reporting Services decision because the major ad hoc query and reporting tool vendors also provide similar reporting services functionality, usually at an extra price. Buying both ad hoc and reporting service functionality from the same vendor means you have to support only one toolset. Additionally, ad hoc reports built in the vendors front-end tool can generally be moved right into the tools standard report environment without any conversion. Any reports developed in a third-party tool must be converted to Reporting Services in order to take advantage of Reporting Services report server capabilities, unless they were designed to work with Reporting Services in the first place.
Some of the more focused tool vendors, like ProClarity and Panorama, are leveraging the Reporting Services infrastructure to provide enterprise report management for their products. In these cases, you can use these third-party query tools to create complex reports, and then save them out to Reporting Services for scheduling and distribution.
Selecting end-user tools is more than just a technical process. It is also highly political and personal. You need to get the end users deeply involved in this process.
| | ||
| | ||
| | ||
EAN: N/A
Pages: 125