High-Level Planning
| | ||
| | ||
| | ||
Now that youre familiar with the features and architecture of Integration Services, this chapter returns to the process of planning the ETL system. The end goal of this chapter is to describe how to write a detailed ETL specification. Before you dig into the details, its best to start at a high level, by developing the first draft high-level map from the information that was gathered during the business process dimensional modeling effort.
After you pull your very high-level thoughts together into a high-level map, its time to do detailed data profiling to learn about the characteristics of your data and what the transformation rules will need to be. These profiles will feed into the detailed source to target maps.
You will need to develop some system-wide approaches and rules, for example how to extract data and maintain conformed dimensions. For each fact table youll need to decide how much history to load initially, and how much historical data to keep live in the DW/BI system.
A summary of the high-level planning process includes the following items:
-
Develop a high-level map.
-
If helpful, build a sandbox source system.
-
Perform detailed data profiling and complete the source-to-target mapping.
-
Determine how often youll load each table.
-
Determine how much historical data youll load for each table.
-
Develop a strategy for partitioning the relational and Analysis Services fact tables.
-
Design a strategy for extracting data from each source system.
-
If necessary, de-duplicate key data elements like person and organization.
-
If necessary, develop a strategy for distributing dimension tables across multiple database servers.
Develop the First Draft High-Level Map
One of the early steps of the ETL system design process is to develop an overall map. Draft the map at a higher level of detail than the source-to-target mappings, with a box for each source table, file, spreadsheet, or other source, and a box for each table in the business process dimensional model. Visio, Power-Point, or even your whiteboard are good tools to use for illustrating the high-level map. We really mean for this map to be at a high level. As a rule of thumb, a map for a simple subject area consisting of a primary fact table and related dimensions can, with a small font, fit on a single sheet of paper.
The high-level map serves several goals:
-
It forces you to think about the big issues early. Which tables need to be populated first? What are the big and expensive transformation problems? What data are you missing? How will you create historical Type 2 dimension changes? Trying to fit everything on a page helps focus your attention on what is important and what is noise.
-
It provides a succinct mechanism for communicating with management, and other interested parties who arent all that interested. The ETL system is difficult and expensive to build. Its good to have an overview that helps explain why thats so, without overwhelming nontechnical folks with details.
-
It serves as an outline for the detailed ETL design specification.
-
If the detailed ETL design specification never gets written, it provides the bare minimum of direction to the ETL system development team. People tend to skimp on the design phase of the ETL system. If you cant take the time to think through and draw a one-page picture of what you plan to do, its hard to see how you can possibly pull together an ETL system that does whats necessary, in the time allotted and without errors.
The high-level map should be aligned around the business process dimensional model. It should illustrate which sources feed each table in the model, and highlight dependencies between tables. A fact table cant be populated before its associated dimension tables, and sometimes one dimension table has a dependency on another.
An example high-level map is included as Figure 5.4. This is a portion of the map for populating the case study database. This map illustrates the population of the Customer dimension table.
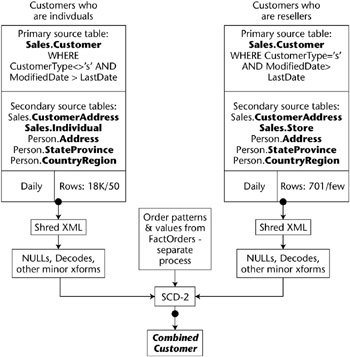
Figure 5.4: High-level map for Customer (both individual and reseller)
At the top we have a list of the tables that provide data to each dimension table. Customer uses data from seven tables in the transaction database. The shaded (source) box illustrates a condition on an extract from the main source table, including the method for finding new or changed rows.
Just below the shaded boxes are three small boxes that contain the same information for each table: What is its update cycle; what type of dimension change logic does it require; and approximately how many rows do you expect initially and during each periodic (daily) load? The rowcounts should be very approximate; the goal is to provide a pointer to any troubling data volumes .
The next section describes, at a very high level, what needs to be done to the data. Highlight steps that youre a little worried about, like shredding XML or applying complex logical rules. The high level model in Figure 5.4 shows that information on individuals and resellers flow into the final combined Customer dimension.
In Figure 5.4, the data flow arrows begin and end with a red dot (visible as a filled circle in this black-and-white figure). This dot represents a data quality check, which should be included in every tables processing. We discuss data quality checks in greater detail in Chapter 6. Even though every tables process should include data quality checks, we like to call them out in the high-level diagram because we find that people often forget this important step.
Figure 5.4 is a relatively small section of the full high-level ETL diagram for the case study. The complete diagram is available on the books web site.
Create the high-level map soon after youve developed your dimensional model. However, as we discuss in the next sections, you still have a lot of investigative work to do. Youll learn more about the requirements of the ETL system and will need to refresh the high-level map to reflect changed plans. At the end of this chapter we talk about what the detailed ETL specification should look like. That specification includes an accurate high-level map. Once the detailed specification is complete, the high-level map serves as a communication tool with people who are not fascinated by the gory details of the ETL system.
Build a Sandbox Source System
During the ETL development process, youll need to investigate the source system data. If your source system is heavily loaded, and you dont already have some kind of reporting instance for operational queries, the DBAs may be willing to set up a static snapshot of the database for the DW/BI team. Early in the ETL development process, its convenient to be able to poke around the source systems without worrying about launching the kind of killer query that, presumably, your project is supposed to prevent.
Some source systems require data to be extracted through their programming interfaces. In this situation you need to check with the vendor to ensure your sandbox system is not in violation of their license.
The simplest way to build the sandbox source is to restore the source database or databases from a consistent point-in-time backup. If your source data is very large, consider using Integration Services and the sampling transforms to grab a random subset of fact data. Many people pull over only the most recent few months of data into their sandbox, but this approach omits the inevitable problems that youll encounter with older data.
| Note | The Integration Services sampling transforms will pull over all the data and then perform the sampling on the Integration Services box. So dont try this on your laptop. If you have the computing resources and bandwidth, random sampling is a good idea. You really do want to pick data from throughout a wide range of time and other conditions. You can often make a first cut of sampling on the source system query by choosing something pretty random, like customer numbers that end in 7. Its a good idea to do a random sample of a core dimension, like customer, and then pull all transactions associated with only those customers. This helps you get a complete and consistent subset of the source system. |
Most large databases contain only a few tables that are very large. These usually feed fact tables, although they can become monster dimension tables. If you dont have the disk space to restore the entire source database and then prune away the unwanted data, instead create a consistent subset using a process like the following:
-
In Management Studio, script the creation of all relevant table and view objects in the source database, including keys and indexes. You probably do not want to script triggers.
-
Create the sandbox database and run the script to instantiate empty versions of all the objects.
-
In Management Studio, use the Import/Export Data Wizard to quickly generate an Integration Services package that will load data from each table in the source database to its corresponding table in the sandbox database. Be sure to omit moving data for the very large tables.
-
Enable identity insert if any column uses the IDENTITY keyword.
-
For the handful of very large tables, develop a custom Integration Services package that pulls over only the desired subset of data.
-
For the large tables, drop indexes and constraints so the load can proceed as fast as possible. Be sure to restore constraints and indexes later. If you dont restore constraints you may spend a lot of time chasing down referential integrity violations that exist only in your sandbox.
-
Check your work by generating a CREATE script for both the source and sandbox databases. Use windiff or your favorite tool to compare the two scripts. This will ensure all keys, indexes, and constraints are the same.
-
Further check your work by comparing table sizes and rowcounts.
You cant stick with the sandbox system throughout the entire ETL design and development process. Sooner or laterand better sooner than lateryoull need to tackle the issues surrounding the arrival of new and updated data.
You dont have to build a sandbox system. If your source system doesnt have major performance problems, and you coordinate with its DBAs about when and how to run queries, you dont need this extra step. In many small companies, the source system DBAs are intimately involved with the DW/BI team and can easily facilitate careful use of their operational databases.
Perform Data Profiling
Data profiling is a methodology for learning about the characteristics of your data. As we described in Chapter 2, you should have begun profiling your data during the dimensional modeling process. You should already have a good idea of domains, relationships, and data quality problems.
| Reference | The excellent book Data Quality: The Accuracy Dimension by Jack Olson (Morgan Kaufmann, 2003) is largely devoted to the subject of data profiling. You can also find a lot of information about data profiling by performing an Internet search on a term like data profiling tool. |
The best way to perform data profiling is to purchase a tool to run against your sandbox source system. An Internet search will show several good candidates, although youll notice that Microsoft is not currently included in the vendor list. Nor does SQL Server 2005 include data profiling technology.
Whether you profile your source data in a formal way at the start of your ETL project, or piece by piece after youve started developing, you will end up profiling your data. Perform this task at design time so that you can better scope your development effort.
Refer to Chapter 2 for a longer discussion of data profiling. The data profiling that you perform now, for the ETL system design, is similar to the data profiling performed earlier. Now, you focus exclusively on the data sources for the ETL system and keep working with the data until youre satisfied you completely understand it.
Include the results of your data profiling efforts in the ETL system detailed specification. As you work through the results of the data profiling effort, you should first consider if its possible to correct some of the data errors in the source systems.
Its often difficult to get the source system owners to pay attention to your concerns about data quality. Youll strengthen your negotiating position by presenting a complete data profile report that highlights where, when, and how often bad data has entered the system. We cant tell you how often source system DBAs have told us you just cant get that kind of error, only to wither into silence when presented with the evidence. It makes most sense to correct historical data in the source system if data checks are now in place, or can now be added, to prevent new errors of this sort from occurring. Theres not much use in correcting the historical data if tomorrows transactions are going to create new junk.
Youre unlikely to get all the problem data corrected historically, and even more unlikely to get the source systems modified to prevent all new data errors. The data profiling results will inform the design of your ETL system, both for the historical load and for where to expect and how to handle the inevitable errors that show up on the incremental load.
Complete the Source-to-Target Mapping
The source-to-target mapping is a textual description of how to populate each table and column in the business process dimensional model. The data profile analysis is the single most important input into the source-to-target mapping. The mapping outlines what needs to happen, without going into the details of how .
Most mappings are simple: CUSTNM in a source system gets mapped to CustomerLastName in the Customer dimension table. Make a note of any transformations that you know about already, like:
-
Parsing a source column into multiple target columns : for example, breaking out area code from phone number
-
Combining multiple source columns into a single target column: for example, constructing a customers full name
-
Correcting any data errors discovered during data profiling
-
Changing case: for example, changing a name field from all capitals to proper case
Make overall notes at the table level about sequencing, like noting that the Customer dimension must be processed after the Geography dimension.
In Chapter 2 we introduced an Excel workbook that illustrates a reasonable level of detail for the source-to-target mappings. At this point in the ETL system design process, ensure the map is completely and accurately filled in.
Load Frequency
Most people load their DW/BI system on a daily basis, and thats primarily what we talk about in this book. The design of your ETL system doesnt change significantly as long as youre loading in batches, be they monthly, weekly, or daily. As soon as you start loading more frequently than daily, the characteristics of your ETL system change. These real-time issues are discussed in Chapter 17.
The main reason to load data monthly rather than daily is if your source system performs some complex business logic at month-end, for example an accounting system. Even so, your business users will probably gain significant value from seeing numbers as they accrue during the month, even if the month-end load supersedes the daily increments . Other data sources, especially external data sources, may be available only monthly.
In our consulting practice we occasionally encounter companies that fully refresh their DW/BI system during each load. If you really had to perform a full refresh for each load, that would be a good reason for loading only monthly. A DW/BI system thats fully refreshed for each load is typically one that was developed as a prototype and moved directly into production. We have seen very few cases where such a design was truly necessary, and in fact, this design usually creates significant problems for the business users ability to track history.
Some companies load their DW/BI system weekly in order to have the entire weekend to complete processing. While its not unheard of to need so much time to perform processing, it ought not be necessary. If youre in this situation, and your business users are clamoring for yesterday s data, evaluate whether a redesign of the systemor, more to the point, the systems current bottleneckscan greatly reduce processing time.
More business users are asking for access to data at even lower latency than daily. Its much easier to deliver low latency data with SQL Server 2005 than ever before. However, as soon as you move to intraday processing, there are some user experience issues that you need to understand. These issues are discussed in Chapter 17. If you are working on Phase 1 of your first DW/BI system, you should load data no more frequently than daily.
How Much History?
There are two questions relating to history that affect the design of your ETL system. The first is forward-looking: How much history do you plan to keep in your DW/BI system on an ongoing basis? Analyze the costs and benefits of keeping data forever. The business community must provide the justification. The technical folks can formulate the costs, including not just hardware (storage, memory, and processors required to manipulate large datasets), but also the complexity of managing a large system.
| |
Kimball Group recently reviewed a large system that performs a full refresh of billions of rows every month. It takes seven days to reload the system at the end of the month. They cant track history: Everything, including facts, is treated as a Type 1 change and updated in place.
This design resulted from an ETL team taking shortcuts. They didnt want to take on the hard work of figuring out how to recognize incremental loads, and werent given enough time by management to do it right. Now they have tens of millions of dollars invested in a system that doesnt meet the users needs. Nobody wants to deliver the message that the ETL system needs to be redesigned, for millions more dollars.
| |
If you decide not to keep data indefinitely but instead to maintain a moving window of data, youand the business usersneed to decide what that time period is, how frequently data is pruned, and what happens to it when its pruned. Some systems keep a minimum of, say, 37 months of data and let it accumulate to 49 months before performing an annual pruning. Others prune monthly. (Note that the examples we provide are one month longer than a year. That extra month is valuable for month-to-month comparisons37 months of data provides a 36-month time series of deltas.)
A second decision is how much historical data to load into the DW/BI system for its launch. Some DW/BI systems begin with zero historical data, and simply start accruing information as time goes by. We find this approach difficult to justify, as the benefits from the DW/BI system come largely from having a reasonably long time series. It certainly has a negative impact on the projects ROI and user appeal .
Loading historical data can be quite expensive, as source systems may have changed multiple times over the years . You may end up writing several transformation steps to cover different time spans . Weve even seen companies whose historical data was completely unavailable, because their backup tapes wereand had always beenempty.
| Tip | Thoroughly test both backup and restore procedures. |
The DW/BI team cant make the decision about how much history to load. Develop a proposal and cost/benefit analysis based on the business requirements. Present the proposal to the project sponsor and business users, for their review and approval.
Using Partitions
The SQL Server 2005 RDBMS has a new feature that makes it much easier to maintain large fact tables: partitioned tables. Partitioned relational tables are especially useful in the rolling window scenario described earlier. Most medium to large fact tables should be partitioned, at least by year and typically by month. In Chapter 4, we discussed partitioned relational tables in some detail.
The Analysis Services database can also be partitioned, and its common although not required to partition along the same lines as the relational database. Most often the Analysis Services database keeps the same rolling window as the relational database, although sometimes the window is shorter. You typically wouldnt manage an Analysis Services database with a longer timeframe than the corresponding relational database because you always want to be able to reprocess the database if necessary. If you fully understand the conditions under which a partition may need to be reprocessed, and are willing to accept the risk of data lossor have developed plans for restoring the relational partitions if necessarythen you can leave orphaned Analysis Services partitions.
As far as the design of the ETL system is concerned , the use of partitioned tables and Analysis Services partitions requires that you implement logic to ensure the appropriate partitions exist before you try to load data into them. Because you almost always partition by date, for example month, you need to create a partition for each new date period before you try to load data into the partitioned table. Although you always define a failsafe partition to hold data that doesnt belong in any other partition, you really dont want to use that partition. Instead, you want to create a new partition before you need it.
Another issue to consider at design time is whether you can fill a relational partition in a single load. Doing so is highly desirable, especially during the historical data load, because you can use fast loading techniques that increase data load performance by an order of magnitude compared to inserts into an indexed table. If your daily fact table insert volume is extreme, you may want to define daily partitions for the most recent week of data, in order to benefit from these fast loads. On a weekly or monthly cycle, with virtually zero downtime, you can consolidate these daily partitions into weekly or monthly partitions. A table cant have more than 1,000 partitions, so you need to set up this consolidation process if you design daily partitions.
| Warning | Setting up a partition consolidation process is not a simple task. Although SQL Server will consolidate partitions for you automatically, it does so with intolerably slow performance, assuming your data is large enough that youre using daily partitions. Instead, write an Integration Services package or SQL script that bulk-copies data from multiple daily partitions into a weekly table and then switches the weekly table into the partitioned fact table. Chapter 4 describes this partition-switching process. |
Analysis Services performs incremental partition processing very swiftly so you shouldnt need to set up corresponding daily partitions in Analysis Services.
If your ETL system performs fast loads into relational partitions, presumably because you need the performance boost, you may still face a few thorny problems. The first is late-arriving data. Hopefully todays load contains all data for yesterday (or last month), and only data for that prior period. If data for earlier periods can show up in the current periods load, split the data flow to handle that late-arriving data in a different way. This situation is most likely to occur with distributed source systems. You will need to handle updates and deletes separately from inserts. But since Integration Services requires that anyway; this isnt an incremental burden . Late-arriving data is discussed in more detail in Chapter 6.
Historical and Incremental Loads
By the time youve developed the high-level plan, you should have a fairly good idea about how different the historical and incremental load processes need to be. Sometimes the ETL process for dimension tables can be the same for the historical and incremental loads. The simplest case is when your source, like a customer table, has been updated in place. You have a list of all customers since time began , but have information about only the current attributes of those customers. In this case, your customer dimension table will have to begin as of the date the DW/BI system goes live, and it can capture future Type 2 changes. You dont have the information to recreate history. If this is your situation, you should educate your business community about this issue.
Business users will be happier if history can be recreated. This may be possible if the source system archives changes in a history table, an older data warehouse, some other easily accessible store, or even old database backups . Recreating history is, be warned , a tedious and time-consuming task. It sounds difficult, and usually turns out to be even harder than expected. Nonetheless, its vital that the DW/BI team not make the decision about whether to recreate history without consulting with business users. The executive sponsor should make the decision based on the cost estimates you present, together with the benefits voiced by the business.
As hard as it may be to recreate history now, its far more difficult to do so after the DW/BI system is in production. All of the fact rows will be associated with the version of the dimension member as of the date the DW/BI system went live. If you later decide to go back and recreate history, your dimension table will have more members and different surrogate keys. You must rebuild any fact tables that use that dimension to ensure they get the correct keys. This is deeply unpleasant.
Fact table data is fairly likely to require different ETL logic for the historical and incremental processing. The most common differences youll encounter are:
-
Data volumes differ . This point is so obvious its hardly worth making. But the techniques for extracting, transferring, and loading huge volumes of data are substantially different than for the incremental loads, which are several orders of magnitude smaller. During the historical data loads, where you might be loading hundreds of gigabytes or terabytes of data, you should put the database in Simple or Bulk-Logged recovery mode, drop all indexes, and bulk load the data as swiftly as possible. Fast bulk loads are often impossible on incremental updates, for reasons we discussed in Chapter 4.
-
If you have any dimensions with Type 2 attributes, the historical load logic must associate each fact row with the correct dimension member. Build the full, historical dimension table first, before processing any facts. Then, you have a design choice. Either you can perform the fact table lookup by joining business keys where the fact transaction date is between the dimension row effective dates. Or, you can design the fact table package to process data a day at a time. During each iteration, create an image of the dimension mapping that would be current as of that date; the surrogate key lookup joins only on the natural key since the correct dates have already been selected.
-
Sources may differ. Historical data may be saved off in a separate area, like a previous generation data warehouse, a static sandbox as we described previously, a reporting instance, or another data store. Source data structures may differ as well.
-
Transformations may differ. As with dimensions, you sometimes can gain information about fact transactions as they occur, information that is lost when you examine the historical record. You may have to implement additional logic for the transformation of historical data. This is relatively uncommon, but it certainly happens.
A solidly designed ETL system parameterizes any value that might change. For small databases its often possible to use the same design and even the same Integration Services packages for the historical and incremental loads. For large databases or those with different transformations for historical and incremental data, design both ETL processes in tandem for maximum re-use of complex components .
Develop Strategies for Extracting Data
Youll use different strategies to extract data from different source systems, and even different entities in the same source system. Choosing the best extraction technique depends more on the characteristics of the source system than on the requirements of the ETL system.
From the ETL point of view, your ideal is an extraction systemwritten by someone elsethat identifies and passes into your world only the rows that have been inserted or changed since the last load. In the real world its seldom so simple.
Extracting Data from Packaged Source Systems
Most companies that are building BI systems these days use packaged systems for some, most, or all of their transaction systems. Some packaged systems require, or at least strongly recommend, that you use their custom API for accessing the data managed by their transaction system. We dont always like to use the APIs for extracting the data to load into the DW/BI system. First, we might not have (or want to pay for) the scarce talent thats familiar with those APIs. Second, even if were comfortable with the coding, these APIs were often developed for message-level traffic and perform quite poorly for bulk extracts , especially for the historic data.
Many of these packaged systems offer an analytic system, often as an add-on feature at additional expense. Most of these packaged analytic systems are not entirely satisfactory, which is probably why youre reading this book. However, they often excel at extracting the data from their own systems. The packaged analytic add-on to a transaction system can make a great source to your ETL system. You should investigate whether the advantages are worth the cost, but be sure to verify that the packaged system collects data at the grain you desire .
| |
The ideal Business Intelligence module of your packaged system should include the following characteristics:
-
Packaged BI data model is dimensional.
-
Data is stored at the atomic grain.
-
Data model is clear and comprehensible.
-
Attribute changes can be tracked over time (Type 2 slowly changing dimensions are supported). The attribute tracking method is something you should be able to change for each attribute.
-
Ability to easily integrate non-packaged data sources like external demographics or data from another transaction system.
-
Ability to act as a dimension subscriber or manager.
Weve never seen a packaged BI system implement all this functionality.
| |
| |
SQL Server 2005 ships with a .NET provider for SAP, which provides two methods of accessing SAP R/3 data:
-
Write a SQL statement against a single SAP table. You can access column data from all types of SAP tables.
-
Execute BAPI/RFC. With this access method you can execute a BAPI or custom RFC in the SAP server.
With either approach, the results of your query or call are surfaced by the ADO.NET DataReader interface. What this means to you is that the resulting rowset is available from within Integration Services, Reporting Services, or any other tool that consumes managed sources.
At initial release, the provider does not contain a user interface for constructing a query or a BAPI call. Its your job to type in the correct syntax.
We certainly expect to see Microsoft, and third-party vendors , create additional tools and functionality for integrating with packaged systems.
| |
An alternative to working directly with system APIs is to use a tool that simplifies the extraction of data from many popular source systems. Such a tool effectively substitutes for the expertise we described previously. Some ETL tools have packaged common source system mappings or wizards into their products, usually as connectors available at an extra cost. SQL Server 2005, at its initial release, offers basic connector functionality only for SAP.
If this basic functionality doesnt meet your requirementsclearly the case if your source system is not SAP R/3there are some third-party tools that you can use. Try an Internet search on business integration software for some likely candidates. Research possible tools carefully . Many, especially those that talk exclusively about Enterprise Application Integration (EAI), are oriented much more toward messaging than toward the large data volumes of the BI world.
For many packaged systems, you may be able to extract directly from the database tables. The vendors discourage this approach, but if your packaged system does not have a complete data access API, you have no choice but to extract directly from the database. The major risk in this approach is that the vendor will change the structure of the database in a future release, thereby breaking your extracts. A second risk is that the packaged system might hide some business logic that is difficult or impossible to reconstruct from the database alone.
We have helped to reverse-engineer any number of packaged systems, and it has always turned out to be harder than anticipated. Nonetheless, direct extracts can be a cost-effective approach, especially if you can find a consultant who has performed the task for your source system already.
| Warning | We strongly discourage this approach for complex, enterprise-class source systems. We know someonea smart guy!who managed a DW/BI system that pulled data from SAP tables. They never got the extract right. At the close of every month, the controller was in the managers office, screaming about how the data warehouse was wrong again. Do yourself a favor. Dont even try. |
Extracting Directly from the Source Databases
Many organizations have custom-built systems to manage a portion of their operations. Usually, these custom-built systems exist to support unique characteristics of the organization, often providing real competitive advantage. Sometimes, theyre just old, legacy systems that have not yet been migrated to more modern platforms. Many DW/BI systems are populated, wholly or in part, from these custom source systems. Custom extracts are the only way to pull data from a custom source.
If the custom source is relational, defining the custom extract is generally pretty easy. There are probably people in your organization who are expert on the system, data model, and data. They can help you define the queries to extract the desired data with minimal impact on the systems.
If you have very old, mainframe-based source systems, you may have to develop a custom extract in a language like COBOL. If youre in this situation, lets hope there is still someone around that knows the system. If not, be sure to add additional time to your ETL design and development estimates. Get your extracts written quickly before the last skilled programmer retires.
Most of the projects weve worked on have had a hidden source of data: business analysts desktops, usually Excel spreadsheets. For example, the interesting characteristics of promotions are very often not entered into the source system but instead are managed in Excel by a Marketing analyst. Its tempting, when you uncover these hidden systems, to design a small applet to better manage the data and process. We recommend that you keep your focus on building the DW/BI system, and accept these spreadsheets and similar sources as the raw material for Phase 1. Its not difficult to use Integration Services to pull data directly from spreadsheets. You should ask the spreadsheets owner to build an image of the interesting datausually in a separate sheet of the workbookthat has been structured in a simple table format with column names in the first row. Usually this can be done very simply with Excel formulae and references to the sheet(s) that the user maintains directly.
Weve worked with several teams who had huge data volumes fed from proprietary file formats. These were online systems or services, and the data source was system logs whose volume required a custom design for extremely efficient storage. In such cases, the systems developers will have to decode the proprietary file sources for you. They could write a program to consume log files and spit out nicely formatted flat files for Integration Services to pick up. A more elegant and scalable solution for SQL Server 2005 Integration Services would be to have the developers write a custom source adapter for Integration Services. The parsing logic would be exactly the same as before, but the source adapter would be embedded within Integration Services, eliminating the expensive middle step of writing data to flat files. SQL Server 2005 ships with a sample source adapter project, and Books Online includes extensive documentation on the subject. A third, similar alternative would be to write a custom ADO.NET provider. A custom adapter is easier to write and performs slightly better, so youd write a custom ADO.NET provider only if theres a second (non-Integration Services) use for the output data. With any of these approaches, the hardest programming effort and the most resource- intensive processing will be in the logic to parse the proprietary files.
You may be able to shift some of the burden of transformation to the query that extracts data from the source system, for example by defining the extraction query to join multiple tables or filter rows. This is a tempting path for those of us who are very comfortable with SQL, but it should be used judiciously. If you put transformations in the source query, those transformations can be hard to find. More important, the source queries should always be designed to place the minimum possible burden on the transaction systems. Best practice says to keep the source queries as simple as possible, and explicitly perform transformations in the Integration Services data flow.
As we described earlier in this chapter, Integration Services can extract data from practically any relational database system. The only requirement is that an OLE DB provider (or ADO.NET provider) be available. Because SQL Server includes an OLE DB provider for ODBC, practically every source is readily available. You should always look for a native OLE DB provider rather than use the double layer of middleware. A well-written OLE DB provider is only marginally less efficient than using the databases native interface, like Oracles SQL*Net. But poorly performing OLE DB providers definitely exist; weve seen instances where the OLE DB for ODBC combination actually performed better than the native OLE DB provider. Microsoft doesnt write most OLE DB providers; they are written and supported by the source database company or a third party.
| |
A recent client had a business-critical, production mainframe application that was over 30 years old and written in Assembler. Only one former employee, now retired , knew anything about the system. The DW/BI system development project timeline depended on how many hours a week this retired programmer cared to work.
| |
If your data volumes are quite large, and your source system extracts are a bottleneck, you should test alternative drivers and providers. For most situations, however, this isnt such a big problem and even the OLE DB for ODBC combination performs adequately for most systems incremental updates. If youre worried that your historical extract will not finish before the next ice age, consider dumping the large historical tables to flat files. Integration Services flat file source adapter performs very well.
Extracting Data for Incremental Loads
If youre lucky, your source systems are reasonably modern, well designed and carefully implemented. The ideal source system is ledgered, with updates entered as changes. For example, changes to order quantities after the order was created would be entered as new rows with positive or negative quantities , rather than updating in place the original order row. This is particularly important for fact data and large dimensions with more than a million members.
| Tip | In most systems, new rows are relatively easy to find. There is usually a transaction date that is trustworthy and we just pull those rows. The trick is finding the rows that have been updated or deleted in the source system. We particularly enjoy it when the source system folks tell us Oh, no, we never update facts. It cant happen. |
In the real world, we dont always have this situation. Usually we at least have a way to find which rows in the source system were changed yesterdaytypically a column that keeps the last modified date and time. In Integration Services, the source extract query for fact data should dynamically filter for rows changed yesterday.
If your source systems fact data doesnt keep track of when rows were last changed, incremental loads are extremely challenging. If the data volumes are small you can pull the entire dataset and compare it to the image in the DW/BI system. If changes are limited to recent months, you can do this comparison over a limited date range. We have also seen systems that do a full refresh of the fact table at certain intervals like quarterly, or whenever the DW/BI system deviates too far from the source system. All of these approaches are painful.
If data volumes are large, you should work with the source system DBAs to craft a solution. Alternative approaches include using change data capture tools on the source system, adding triggers to the source system tables, or defining transactional replication on the source system. Replication is a particularly effective option if your DBAs have expertise in managing a replicated system, or are willing to develop that expertise. Be careful about how to track source system deletes. We almost never delete data from the DW/BI system, with the exception of pruning sets of aged data from a rolling window.
It is much less of a problem to find dimension changes. Most dimensions are small enough that its perfectly fine to pull all the dimension data into the ETL system on each incremental load and compare with the existing dimension. Its more efficient to pull over only new and changed rows, but its generally not a problem if you have to extract the entire table. The Integration Services Slowly Changing Dimension Data Flow transform gracefully handles the full table comparisons for you and updates only dimension rows that have actually changed.
Extracting Historical Data
You may choose a different strategy for extracting data for the historical load than for the daily incremental load. Its common to extract the large datasets to flat files, usually one file for each month of data. Often, although not always, you need a different Integration Services package to extract and process historical data than the one that handles incremental loads.
Small datasets, especially the data for dimension tables, are usually extracted in the same Integration Services data flow task that performs transformations and loads the target tables in the data warehouse database.
De-Duplication of Person and Organization
One of the most valuable services that the DW/BI system can provide is de-duplication of people and organizations. De-duplication is particularly important when information about people comes from multiple source systems. Although we would love it if the source systems were modified to use a master person or organization directory service, in many cases thats just not realistic. Nor is developing that master data management part of the DW/BI project.
Some teams face severe data quality problems around the identification of unique people, organizations, and addresses. Although Integration Services includes valuable data cleansing technology, you may need to implement third-party name and address cleansing software. You should investigate this requirement during the ETL system design process.
Integration Services includes two general-purpose transforms that help you address data quality and de-duplication: Fuzzy Lookup and Fuzzy Grouping. These transforms do a surprisingly good job at identifying similar data and assigning a probability to the matchs correctness. However, these transforms work best if the data has been standardized first.
To standardize information about a persons name and address, break the source systems rows into tiny parts , like title, first name, middle name or names, last name, suffix, street number, street name, street type like Avenue, and so on. Weve all received mail addressed to strange permutations of our names, so even without the inevitable misspellings we all understand the various ways in which different source systems might hold similar information. Its not a trivial task to correctly parse a name that may be stored as Warren Thornthwaite in one system, Thornthwaite, Warren in a second, and Warren N. Thornthwaite, Jr. in a third. The mess related to addresses is even more profound. Add in country-specific standards for names and addresses, and you have a difficult problem indeed.
Some source systems standardize names and addresses for you already. For example, the Person.Contact table in AdventureWorks has broken the name into Title, First Name, Middle Name, Last Name, and Suffix. But the Person.Address table holds address as Address Line 1, Address Line 2, City, Postal Code, and State. To standardize the addresses in AdventureWorks, youd parse the address lines and change all instances of Ave. or Ave or Av to Avenue. Youd almost certainly find strange additional information in these fields, like Leave package at side door.
If de-duplication of person and organization is vital to your business, and especially if your source systems dont standardize names and addresses, use a third-party data-cleansing tool. These tools solve the standardization problem for you, and many include different rule sets for different countries . These tools will also de-duplicate the standardized data. They may do a better job than the fuzzy transforms of Integration Services if their algorithms are written specifically for name and address problems. The authors have found the Integration Services fuzzy transforms work well on standardized data.
If your source system data about person and organization are fairly clean, and the business users can accept less complete de-duplication, you can get away without purchasing a data-cleansing tool. For example, in the case of AdventureWorks, the person data looks pretty clean and standardized already. With a few days effort to write a script to standardize the addresses, you will have a high-quality set of data to feed into the Fuzzy Lookup and Fuzzy Grouping transforms. Note that the AdventureWorks data is not realistic enough to make a good case study for the fuzzy transforms.
Wed prefer to use a third-party data-cleansing tool that has been integrated into the Integration Services data flow pipeline. This integration is possible because Microsoft publishes an API for writing a custom transform. The data-cleansing tool vendor would need to write a wrapper around its tool that accepts a stream of dirty data and returns standardized and/or de- duplicated data. You should certainly ask prospective vendors if they have integrated with the Integration Services pipeline. If your tool of choice has not or cannot perform this integration, you can always write the data to a flat file or table and use the Execute External Process task to launch the data cleansing tool from the control flow.
Develop a Strategy for Dimension Distribution
The key to the Kimball Method architecture, and to designing an enterprise DW/BI system, is to conform dimensions across multiple business process dimensional models. This is easy if all the dimensional models are on the same system. We expect the majority of DW/BI teams can build their enterprise DW/BI system without having to distribute the relational data warehouse database.
In Chapter 4 we talked about distributing your system horizontally, with different business process dimensional models on different physical servers. If you must distribute the system horizontally, because of data volumes or political pressures, youll need to build a single ETL system that processes all dimensions. This system, called the dimension manager , is simply a set of Integration Services packages that manages the processing for all of your organizations dimension tables. Distributed databases use local copies of the master dimensions provided by the dimension manager. By isolating the processing of dimensions and facts as we described in this chapter, youll build a more solid, flexible, and scalable ETL system, even if you dont need to distribute dimensions.
If you have a horizontally distributed DW/BI system, you need to copy the completed dimensions to the distributed business process dimensional models that will use them for fact table processing. For the vast majority of dimensions, its easiest to just copy/replace the entire dimension to the distributed databases. You need some metadata that describes which databases subscribe to which dimensions, when the master version of a dimension was last updated, and when the master dimension was copied to each business process dimensional model. Then simply create an Integration Services process to push the dimensions out, or have the distributed databases Integration Services packages pull the dimensions when they are ready for them. Consider using an Integration Services OnPreExecute event handler to pull the dimension tables required by a dimensional model.
| Warning | To copy the entire dimension over to the distributed database, you need either to have no foreign key constraints defined between the fact table and dimension tables, or you need to disable and re-enable those constraints. For large dimensions, use replication to propagate only the changes. |
Its much easier to manage a non-distributed environment, so we certainly encourage you to challenge any political forces driving you toward complexity. Distributing your DW/BI system vertically, say by having a server devoted to ETL, to the relational data warehouse, to Analysis Services, or to Reporting Services, is nowhere near as complex as the horizontal distribution discussed here.
| | ||
| | ||
| | ||
EAN: N/A
Pages: 125