DB2 Performance Monitor (DB2 PM)

 <  Day Day Up  >  

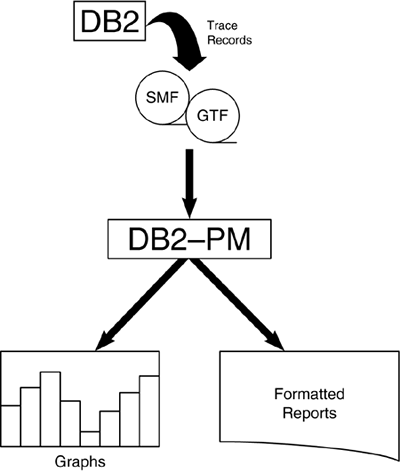
IBM's DB2 PM is the most widely used batch performance monitor for DB2. Although DB2 PM also provides an online component, it is not as widely used (though it has beensignificantly improved since its initial release). I discuss the online portion of DB2 PM briefly in the next section. In this section, I concentrate solely on the batch performance monitoring characteristics of DB2 PM. Other DB2 performance monitoring solutions offer similar reports and information, so you should be able to translate this information for the particular product in use at your site.

DB2 PM permits performance analysts to review formatted trace records to assist in evaluating the performance of not only the DB2 subsystem, but also DB2 applications (see Figure 24.1). As the DB2 subsystem executes, trace records are written to either GTF or SMF. Which trace records are written depends on which DB2 traces are active. The trace information is then funneled to DB2 PM, which creates requested reports and graphs.

Figure 24.1. DB2 PM operation.

graphics/24fig01.gif


DB2 PM can generate many categories of performance reports, known as report sets . A brief description of each report set follows :

Accounting

Summarizes the utilization of DB2 resources such as CPU and elapsed time, SQL use, buffer use, and locking.

Audit

Tracks the access of DB2 resources. Provides information on authorization failures, GRANT s and REVOKE s, access to auditable tables, SET SQLID executions, and utility execution.

I/O Activity

Summarizes DB2 reads and writes to the bufferpool, EDM pool, active and archive logs, and the BSDS.

Locking

Reports the level of lock suspension and contention in the DB2 subsystem.

Record Trace

Displays DB2 trace records from the input source.

SQL Trace

Reports on detailed activity associated with each SQL statement.

Statistics

Summarizes the statistics for an entire DB2 subsystem. Useful for obtaining a synopsis of DB2 activity.

Summary

Reports on the activity performed by DB2 PM to produce the requested reports.

System Parameters

Creates a report detailing the values assigned by DSNZPARMs.

Transit time

Produces a report detailing the average elapsed time for DB2 units of work by component.


Many types and styles of reports can be generated within each set. The following sections describe each DB2 PM report set.

Accounting Report Set

The DB2 PM accounting report set provides information on the performance of DB2 applications. Two basic layouts are provided for accounting reports: short and long. The accounting reports provide the following type of information about the performance of DB2 applications:

  • The start and stop time for each program

  • The number of commits and aborts encountered

  • The type of SQL statements used and how often each type was issued

  • The number of buffer manager requests

  • Use of locks

  • Amount of CPU resources consumed

  • Asynchronous and synchronous I/O wait time

  • Lock and latch wait time

  • RID pool processing

  • Distributed processing

  • Resource limit facility (RLF) statistics

For an example of the type of information provided on a short accounting report, refer to the accounting report excerpt shown in Listing 24.1. This report provides a host of summarized performance data for each plan, broken down by DBRM.

Listing 24.1. DB2 PM Accounting Report ”Short
 #OCCURS #ROLLBK SELECTS INSERTS UPDATES DELETES CLASS1 EL.TIME CLASS2 graphics/ccc.gif EL.TIME GETPAGES SYN.READ LOCK SUS PLANNAME           #DISTRS #COMMIT FETCHES   OPENS  CLOSES PREPARE CLASS1 TCBTIME CLASS2 graphics/ccc.gif TCBTIME BUF.UPDT TOT.PREF #LOCKOUT ------------------ ------- ------- ------- ------- ------- ------- -------------- graphics/ccc.gif -------------- -------- -------- -------- PRG00001                19       0    8.24    2.39    3.33    2.49       2.938984       2 graphics/ccc.gif .879021    81.29    12.29     0.49                          0      27    2.35    2.35    2.35    0.00       0.019870       0 graphics/ccc.gif .017809    30.42     0.59        0 ----------------------------------------------------------------------------------------------------- graphics/ccc.gif PROGRAM NAME     TYPE      #OCCUR  SQLSTMT  CL7 ELAP.TIME   CL7 TCB.TIME  CL8 SUSP.TIME graphics/ccc.gif CL8 SUSP   PRG00100         DBRM          10    12.00       3.298190       0.015465       3.198018 graphics/ccc.gif 9.71   PRG00150         DBRM           2     8.00       1.981201       0.017810       1.980012 graphics/ccc.gif 8.92   PRG00192         DBRM           7     7.00       2.010191       0.189153       1.702439 graphics/ccc.gif 9.28  ----------------------------------------------------------------------------------------------------- graphics/ccc.gif 

NOTE

Please note that the DB2 PM report excerpts shown in this chapter might not look exactly like the reports that you will generate using DB2 PM. The listings in this chapter are excerpts and are shown to highlight the performance information that can be gleaned from each type of report.


Each plan is reported in two rows. Refer to the first row of the report, the one for PRG00000 . Two rows of numbers belong to this plan. The first row corresponds to the first row of the header. For example, this row shows 19 occurrences of this plan ( #OCCUR ), 0 rollback requests ( #ROLLBK ), 8.24 SELECTS , and 2.39 INSERTS . The second row corresponds to the second row of the report header. For example, it has no distributed requests, 27 COMMITS , and 2.35 FETCHES .

The second component of this report details each of the packages and/or DBRMs for the plan. For each package or DBRM, DB2 PM reports the number of occurrences and SQL statements, along with elapsed, TCB, and suspension times and total number of suspensions . This information is provided only if Accounting Trace Classes 7 and 8 are specified.

The report shown was generated by requesting DB2 PM to sort the output by PLANNAME only. The following sort options are available:

  • CONNECT Connection ID

  • CONNTYPE Connection type

  • CORRNAME Correlation name

  • CORRNMBR Correlation number

  • ORIGAUTH Original authorization ID

  • PLANNAME Plan name

  • PRIMAUTH / AUTHID Primary authorization ID/authorization ID

  • REQLOC Requesting location

Likewise, you can combine these options together, such as PRIMAUTH-PLANNAME-REQLOC . This combination would cause a report to be generated containing a row for each unique combination of primary authorization ID, plan name, and requesting location.

The short accounting report is useful for monitoring the overall performance of your DB2 applications. Using this report, you can perform the following functions:

  • Determine how many times a plan was executed during a specific timeframe. The #OCCURS column specifies this information.

  • With the appropriate request, determine how many times a given user executed a given plan.

  • Investigate basic performance statistics, such as elapsed and CPU time, at the DBRM or package level.

  • Spot-check plans for average SQL activity. If you know the basic operations performed by your plans, you can use the short accounting report to determine whether the SQL being issued by your plans corresponds to your expectations. For example, you can determine whether update plans are actually updating. Columns 3 through 6 of this report contain basic SQL information. Remember, however, that this information is averaged. For example, plan PRG00000 issued 2.39 inserts on average, but the plan was executed 19 times. Obviously, the same number of inserts does not occur each time the plan is executed.

  • Determine dynamic SQL activity. By checking for PREPARE activity, you can determine which plans are issuing dynamic SQL.

  • Obtain an overall reflection of response time. The Class 1 and Class 2 Elapsed and TCB Time columns report the overall average elapsed and CPU time for the given plan. Class 1 is the overall application time; Class 2 is the time spent in DB2. If these numbers are very large or outside the normal expected response time range, further investigation might be warranted.

  • Review average I/O characteristics. The average number of GETPAGE s corresponds to requests for data from DB2. SYN.READ corresponds to a non-sequential prefetch direct read. You can skim these numbers quickly to obtain an overall idea of the efficiency of reading DB2 data.

  • Monitor other information such as lock suspensions ( LOCK SUS ) and timeouts and deadlocks ( #LOCKOUT ) using this report to determine whether contention problems exist.

At the end of the short accounting report, a synopsis of the plans on the report is presented. The plans are sorted in order by TCB time spent in DB2 and wait time spent in DB2. This synopsis is useful when you're analyzing which plan takes the longest time to execute.

If the short accounting report signals that potential problems exist, a long accounting report can be requested. This report provides much more detail for each entry on the short accounting report. The long accounting report documents performance information in great depth and is one of the most useful tools for performance analysis. The long accounting report is composed of eight distinct sections:

Part 1

CPU and elapsed time information, broken down by class, at the plan level

Part 2

Overall highlights for the particular plan

Part 3

In-depth SQL activity for the plan

Part 4

Detailed locking statistics for the plan

Part 5

Program status information for the plan

Part 6

Miscellaneous plan information, including data sharing, query parallelism information, and data capture processing

Part 7

Database code usage statistics (stored procedures, user-defined functions, and triggers)

Part 8

In-depth buffer pool (virtual pool and hiperpool) usage statistics

Part 9

DBRM and Package detail information


You should use the long accounting report to further analyze the performance of particular plans. The detail on this report can appear intimidating at first, but reading it is simple after you get used to it.

The first step after producing this report is to scan it quickly for obvious problems. In the following sections, you will examine each of the individual components of this report in more detail.

Long Accounting Report: CPU and Elapsed Time

The CPU and Elapsed Time portion of the long accounting report contains a breakdown of the amount of time the plan took to execute. Elapsed time, CPU time, I/O time, and locking time are displayed in great detail (see Listing 24.2).

Listing 24.2. Accounting Report ”Long (Part 1)
 PRIMAUTH: DBPCSM  PLANNAME: PROG0049 AVERAGE        APPL (CL.1)     DB2 (CL.2)  IFI (CL.5)  CLASS 3 SUSPENSIONS    AVERAGE TIME graphics/ccc.gif AV.EVENT ------------   -----------    -----------  ----------  --------------------   ------------ graphics/ccc.gif -------- ELAPSED TIME   1:01.092617    1:01.037903         N/P   LOCK/LATCH(DB2+IRLM)      4.143163 graphics/ccc.gif 31.83  NONNESTED     1:01.092617    1.01.037903         N/A   SYNCHRON. I/O             0.865210 graphics/ccc.gif 163.31  STORED PROC      0.000000       0.000000         N/A    DATABASE I/O             0.865210 graphics/ccc.gif 163.31  UDF              0.000000       0.000000         N/A    LOG WRITE I/O            0.000000 graphics/ccc.gif 0.00  TRIGGER          0.000000       0.000000         N/A   OTHER READ I/O            1.648050 graphics/ccc.gif 96.83                                                         OTHER WRTE I/O            0.021439 graphics/ccc.gif 0.64 CPU TIME         56.896970      56.883519         N/C   SER.TASK SWTCH            1.664584 graphics/ccc.gif 20.66  AGENT           13.210102      13.179621         N/A    UPDATE COMMIT            0.000000 graphics/ccc.gif 0.00   NONNESTED      13.210102      13.179621         N/C    OPEN/CLOSE               1.564075 graphics/ccc.gif 10.31   STORED PROC     0.000000       0.000000         N/A    SYSLGRNG REC             0.005812 graphics/ccc.gif 1.00   UDF             0.000000       0.000000         N/A    EXT/DEL/DEF              0.086883 graphics/ccc.gif 3.23   TRIGGER         0.000000       0.000000         N/A    OTHER SERVICE            0.007851 graphics/ccc.gif 6.00  PAR.TASKS       43.658789      43.658789         N/A   ARC.LOG(QUIES)            0.000000 graphics/ccc.gif 0.00                                                         ARC.LOG READ              0.000000 graphics/ccc.gif 0.00 SUSPEND TIME           N/A       8.359872         N/A   STOR.PRC SCHED            0.000000 graphics/ccc.gif 0.00  AGENT                 N/A       1.310241         N/A   UDF SCHEDULE              0.000000 graphics/ccc.gif 0.00  PAR.TASKS             N/A       7.049512         N/A   DRAIN LOCK                0.000000 graphics/ccc.gif 0.00                                                         CLAIM RELEASE             0.000000 graphics/ccc.gif 0.00 NOT ACCOUNT.           N/A      46.499738         N/A   PAGE LATCH                0.000000 graphics/ccc.gif 0.00 DB2 ENT/EXIT           N/A          19.00         N/A   NOTIFY MSGS               0.000000 graphics/ccc.gif 0.00 EN/EX-STPROC           N/A           0.00         N/A   GLOBAL CONTENTION         0.000000 graphics/ccc.gif 0.00 EN/EX-UDF              N/A           0.00         N/P   COMMIT PH1 WRITE I/O      0.000000 graphics/ccc.gif 0.00 DCAPT.DESCR.           N/A           N/A          N/P   ASYNCH IXL REQUESTS       0.000000 graphics/ccc.gif 0.00 LOG EXTRACT.           N/A           N/A          N/P   TOTAL CLASS 3             8.342446 graphics/ccc.gif 0.00 

When you're analyzing this section, first compare the application times (Class 1) to the DB2 times (Class 2). If a huge discrepancy exists between these numbers, the problem may be outside the realm of DB2 (for example, VSAM opens and closes, application loops , or waiting for synchronous I/O). Also, keep in mind that the DB2 times do not include:

  • The time before the first SQL statement, which for a distributed application includes the inbound network delivery time

  • The create and terminate time for the DB2 thread

  • The time to deliver the response to a commit if database access thread pooling is used (for distributed applications)

For IMS, CICS, and WebSphere transactions, compare the not-in DB2 time (class 1 minus class 2) against the time reported on your IMS, CICS, or WebSphere monitor report. Sometimes a performance culprit reveals itself by comparing the results of two different monitors (that is, DB2 versus IMS/CICS/WebSphere). Class 3 information reports wait time. Read and write suspensions are shown in the SYNCHRON. I/O , OTHER READ I/O , and WRITE I/O entries of this report. Of particular interest is the amount of time spent waiting for I/O. If the average SYNCHRON. I/O wait time is high, investigate the application for reasons that would cause additional reads, such as the following:

  • Was the program recently modified to perform more SELECT statements?

  • Was the plan recently rebound, causing a different access path to be chosen ?

  • Was query I/O parallelism recently "turned on" for this plan using DEGREE(ANY) ?

  • Was additional data added to the tables accessed by this plan?

If no additional data is being read, investigate other reasons such as insufficient buffers, insufficient EDM pool storage, or disk contention.

As a general rule of thumb, an asynchronous read (sequential prefetch or sequential detection) requires from 0.4 to 2 milliseconds per page. List prefetch reads range from 1 to 4 milliseconds. A synchronous write requires about 1 to 4 milliseconds per page.

Turning your attention to locking, if LOCK/LATCH(DB2+IRLM) suspension time is higher than expected, review the lock detail shown in Part 4 of the long accounting report. Potential causes of such a problem include a new inefficient access path, unclustered data, or a system problem.

The Long Accounting Report also breaks out time spent processing stored procedures, user-defined functions, and triggers.

Long Accounting Report: Highlights

After you peruse the execution times, a quick analysis of the highlights portion of the report is useful. The highlights section is located just to the right of the section containing execution times. It contains some basic details about the nature of the application that will be useful for subsequent performance analysis (see Listing 24.3).

Listing 24.3. Accounting Report ”Long (Part 2)
 HIGHLIGHTS -------------------------- #OCCURENCES     :        6 #ALLIEDS        :        6 #ALLIEDS DISTRIB:        0 #DBATS          :        0 #DBATS DISTRIB. :        0 #NO PROGRAM DATA:        6 #NORMAL TERMINAT:        6 #ABNORMAL TERMIN:        0 #CP/X PARALLEL. :        6 #IO PARALLELISM :        0 #INCREMENT. BIND:        0 #COMMITS        :       12 #SVPT REQUESTS  :        0 #SVPT RELEASE   :        0 #SVPT ROLLBACKS :        0 MAX SQL CASC LVL:        0 UPDATE/COMMIT   :      N/C SYNCH I/O AVG   : 0.005408 

You should review the following highlight fields:

  • To determine the number of times a plan was executed during the reported timeframe, review the total number of occurrences ( #OCCURENCES ).

  • If the number of commits is not higher than the number of normal terminations, the program did not perform more than one commit per execution. You might need to review the program to ensure that a proper commit strategy is in place. This situation is not necessarily bad, but it warrants further investigation.

  • Analyze the number of normal and abnormal terminations for each plan. Further investigation may be warranted if a particular plan has an inordinate number of aborts.

  • If the value for #INCREMENT. BIND is not , the plan is being automatically rebound before it is executed. This situation is referred to as an incremental bind. Either the plan is marked as invalid because an index was removed (or because of some other DDL change), causing an automatic rebind, or the plan was bound with VALIDATE(RUN) . To optimize performance, avoid these situations when possible.

  • Two fields can be examined to determine if the reported process is using parallelism. #CP/X PARALLEL shows CPU parallelism and #IO PARALLELISM shows I/O parallelism.

Long Accounting Report: SQL Activity

An understanding of the type of SQL being issued by the application is essential during performance analysis. The long accounting report provides a comprehensive summary of the SQL issued, grouped into DML, DCL, and DDL sections (see Listing 24.4).

Listing 24.4. Accounting Report ”Long (Part 3)
 SQL DML    AVERAGE      TOTAL    SQL DCL            TOTAL    SQL DDL     CREATE    DROP graphics/ccc.gif ALTER --------  --------  ---------    ---------------- -------    ----------  ------  ------ graphics/ccc.gif ------ SELECT        1.00         17    LOCK TABLE             0    TABLE            0       0 graphics/ccc.gif 0 INSERT        0.00          0    GRANT                  0    CRT TABLE        0     N/A graphics/ccc.gif N/A UPDATE        0.00          0    REVOKE                 0    DCL TABLE        0     N/A graphics/ccc.gif N/A DELETE        0.00          0    SET CURR.SQLID         0    AUX TABLE        0     N/A graphics/ccc.gif N/A                                  SET HOST VAR           0    INDEX            0       0 graphics/ccc.gif 0 DESCRIBE      0.00          0    SET CURR.DEGREE        0    TABLESPACE       0       0 graphics/ccc.gif 0 DESC.TBL      0.00          0    SET RULES              0    DATABASE         0       0 graphics/ccc.gif 0 PREPARE       0.00          0    SET CURR.PATH          0    STOGROUP         0       0 graphics/ccc.gif 0 OPEN          3.00         51    SET CURR.PREC.         0    SYNONYM          0       0 graphics/ccc.gif 0 FETCH      4553.00      77401    CONNECT TYPE 1         0    VIEW             0       0 graphics/ccc.gif N/A CLOSE         3.00         51    CONNECT TYPE 2         0    ALIAS            0       0 graphics/ccc.gif N/A                                  SET CONNECTION         0    PACKAGE        N/A       0 graphics/ccc.gif N/A                                  RELEASE                0    PROCEDURE        0       0 graphics/ccc.gif 0 DML-ALL    4559.00      77503    CALL                   0    FUNCTION         0       0 graphics/ccc.gif 0                                  ASSOC LOCATORS         0    TRIGGER          0       0 graphics/ccc.gif 0                                  ALLOC CURSOR           0    DIST TYPE        0       0 graphics/ccc.gif N/A                                  HOLD LOCATOR           0    SEQUENCE         0       0 graphics/ccc.gif N/A                                  FREE LOCATOR           0                                  DCL-ALL                0    TOTAL            0       0 graphics/ccc.gif 0                                                              RENAME TBL       0                                                              COMMENT ON       0                                                              LABEL ON         0 

Scan the DML section of the report to verify the type of processing that is occurring. You can quickly uncover a problem if the application is thought to be read-only but INSERT , UPDATE , and/or DELETE activity is not . Likewise, if DESCRIBE , DESC.TBL , and or PREPARE are not , the application is performing dynamic SQL statements and should be analyzed accordingly .

graphics/v7_icon.gif

Additionally, DDL is not generally permitted in application programs. When you spot unplanned DDL activity within an application program, you should consider it a problem. The only exception to this "rule of thumb" is for declared temporary tables, as reported under DCL TTABLE , which must be created using a DECLARE statement in an application program.


I can say the same about DCL GRANT and REVOKE statements. They are not generally coded in application programs, either. However, LOCK TABLE , SET , and CONNECT are valid and useful statements that will show up from time to time. When they do, ensure that they have valid uses, as follows:

  • LOCK TABLE should be used with caution because it takes a lock on the entire table (or tablespace) instead of page locking. It reduces concurrency but can improve performance.

  • SET is used to control aspects of program execution. For example, SET CURR.DEGREE is specified for dynamic SQL query I/O parallelism.

  • CONNECT activity indicates distributed processing.

Long Accounting Report: Locking Activity

The locking activity component of the long accounting report is useful for isolating the average and total number of locks, timeouts, deadlocks, lock escalations, and lock/latch suspensions (see Listing 24.5).

Listing 24.5. Accounting Report ”Long (Part 4)
 LOCKING          AVERAGE    TOTAL ---------------  -------    ----- TIMEOUTS            0.06        1 DEADLOCKS           0.00        0 ESCAL.(SHARED)      0.00        0 ESCAL.(EXCLUS)      0.00        0 MAX LOCKS HELD      0.41        3 LOCK REQUEST        8.00      136 UNLOCK REQUEST      1.00       17 QUERY REQUEST       0.00        0 CHANGE REQUEST      0.00        0 OTHER REQUEST       0.00        0 LOCK SUSPENSIONS    0.00        0 IRLM LATCH SUSPENS  0.06        1 OTHER SUSPENSIONS   0.00        0 TOTAL SUSPENSIONS   0.06        1 DRAIN/CLAIM      AVERAGE    TOTAL ---------------  -------    ----- DRAIN REQUESTS      0.00        0 DRAIN FAILED        0.00        0 CLAIM REQUESTS      3.00       51 CLAIM FAILED        0.00        0 

Additionally, average and total claims and drains are detailed in this section.

Consider the following general rules of thumb for locking analysis:

  • If the value for MAX LOCKS HELD is very high, it may be beneficial to consider issuing LOCK TABLE .

  • If the value for TIMEOUTS is very high, consider either reevaluating the type of access being performed by the application or changing the DSNZPARM value for the length of time to wait for a resource timeout. Factors that could increase the number of timeouts include different programs accessing the same tables in a different order, inappropriate locking strategies ( RR versus CS ), and heavy concurrent ad hoc access.

  • If ESCAL.(SHARED) and ESCAL.(EXCLUS) are not , lock escalation is occurring. The plan therefore causes page locks to escalate to tablespace locks (for those tablespaces defined as LOCKSIZE ANY ). This situation could cause lock contention for other plans requiring these tablespaces.

  • If the value for TOTAL SUSPENS. is high (over 10,000), there is probably a great deal of contention for the data that your plan requires. This situation usually indicates that index subpages should be increased or page locking specified instead of ANY .

Long Accounting Report: Program Status

If a large number of abnormal terminations were reported in the long accounting report highlights section, analysis of the program status section may be appropriate (see Listing 24.6).

Listing 24.6. Accounting Report ”Long (Part 5)
 NORMAL TERM.      AVERAGE     TOTAL    ABNORMAL TERM.        TOTAL    IN DOUBT           TOTAL ---------------  --------  --------    -----------------  --------    --------------  -------- NEW USER             0.94        17    APPL.PROGR. ABEND         1    APPL.PGM ABEND         0 DEALLOCATION         0.00         0    END OF MEMORY             0    END OF MEMORY          0 APPL.PROGR. END      0.00         0    RESOL.IN DOUBT            0    END OF TASK            0 RESIGNON             0.00         0    CANCEL FORCE              0    CANCEL FORCE           0 DBAT INACTIVE        0.00         0 RRS COMMIT           0.00         0 

Long Accounting Report: Miscellaneous Information

The miscellaneous information reported in this section of the long accounting report can be crucial in performance analysis (see Listing 24.7). Six independent components are reported in this section:

  • Data capture

  • Data Sharing

  • Query parallelism

  • Stored procedures

  • User-defined functions

  • Triggers

Listing 24.7. Accounting Report ”Long (Part 6)
 DATA CAPTURE       AVERAGE    TOTAL    DATA SHARING         AVERAGE    TOTAL    QUERY graphics/ccc.gif PARALLELISM           AVERAGE   TOTAL ----------------  --------  -------    ------------------- --------  ------- graphics/ccc.gif --------------------------  ------- -------- IFI CALLS MADE         N/C        0    GLOBAL CONT RATE(%)       N/C     N/A    MAXIMUM graphics/ccc.gif MEMBERS USED           N/A         0 RECORDS CAPTURED       N/C        0    FALSE CONT RATE(%)        N/C     N/A    MAXIMUM graphics/ccc.gif DEGREE                 N/A         0 LOG RECORDS READ       N/C        0    LOCK REQ - PLOCKS        0.00       0    GROUPS graphics/ccc.gif EXECUTED               2.00        12 ROWS RETURNED          N/C        0    UNLOCK REQ - PLOCKS      0.00       0    RAN AS graphics/ccc.gif PLANNED                2.00        12 RECORDS RETURNED       N/C        0    CHANGE REQ - PLOCKS      0.00       0    RAN graphics/ccc.gif REDUCED                   0.00         0 DATA DESC. RETURN      N/C        0    LOCK REQ - XES           0.00       0    ONE graphics/ccc.gif DB2-COORDINATOR = NO      0.00         0 TABLES RETURNED        N/C        0    UNLOCK REQ - XES         0.00       0    ONE graphics/ccc.gif DB2-ISOLATION LEVEL       0.00         0 DESCRIBES              N/C        0    CHANGE REQ - XES         0.00       0 graphics/ccc.gif SEQUENTIAL-CURSOR             0.00         0                                        SUSPENDS - IRLM          0.00       0 graphics/ccc.gif SEQUENTIAL-NO ESA SORT        0.00         0                                        SUSPENDS - XES           0.00       0 graphics/ccc.gif SEQUENTIAL-NO BUFFER          0.00         0                                        SUSPENDS - FALSE         0.00       0 graphics/ccc.gif SEQUENTIAL-ENCLAVE SERVICES   0.00         0                                        INCOMPATIBLE LOCKS       0.00       0    MEMBER graphics/ccc.gif SKIPPED (%)             N/C       N/A                                        NOTIFY MSGS SENT         0.00       0    DISABLED graphics/ccc.gif BY RLF               0.00         0 

Careful analysis of the query parallelism section is appropriate whenever you're analyzing performance statistics for a plan or package bound with DEGREE(ANY) :

  • When RAN REDUCED is not zero ( ), insufficient resources were available to execute the application with the optimal number of read engines. You might need to evaluate the overall mix of applications in the system at the same time. Reducing concurrent activity may release resources that the program can use to run with the planned number of parallel read engines.

  • When any of the SEQUENTIAL categories is not zero ( ), DB2 reverted to a sequential plan. Therefore, I/O parallelism was "turned off." You might need to analyze the program and the environment to determine why query I/O parallelism was disabled.

Long Accounting Report: Database Code Usage Information

The database code usage section provides detailed statistics on the usage of stored procedures, UDFs, and triggers. This section can be particularly helpful to track down performance problems caused by triggers, UDFs, and stored procedures (see Listing 24.8).

Listing 24.8. Accounting Report ”Long (Part 7)
 STORED PROCEDURES   AVERAGE   TOTAL    UDF        AVERAGE    TOTAL   TRIGGERS graphics/ccc.gif AVERAGE   TOTAL -----------------  --------  ------    --------- -------- --------   ----------------- graphics/ccc.gif -------- ------- CALL STATEMENTS        0.00       0    EXECUTED      0.00        0   STATEMENT TRIGGER graphics/ccc.gif 0.00       0 ABENDED                0.00       0    ABENDED       0.00        0   ROW TRIGGER graphics/ccc.gif 0.00       0 TIMED OUT              0.00       0    TIMED OUT     0.00        0   SQL ERROR OCCUR graphics/ccc.gif 0.00       0 REJECTED               0.00       0    REJECTED      0.00        0 

Long Accounting Report: Buffer Pool Information

The buffer pool information is probably the most important portion of the long accounting report. A poorly tuned buffer pool environment can greatly affect the performance of a DB2 subsystem. Analysis of this section of the report (see Listing 24.9) provides a performance analyst with a better understanding of how the program utilizes available buffers.

Listing 24.9. Accounting Report ”Long (Part 8)
 BP0                   AVERAGE     TOTAL     BP10                  AVERAGE     TOTAL ------------------  ---------  --------     ------------------  ---------  -------- BPOOL HIT RATIO                     N/A     BPOOL HIT RATIO                     N/A GETPAGES                85.47      1453     GETPAGES               219.00      3723 BUFFER UPDATES          86.00      1462     BUFFER UPDATES           0.00         0 SYNCHRONOUS WRITE        0.00         0     SYNCHRONOUS WRITE        0.00         0 SYNCHRONOUS READ         0.18         3     SYNCHRONOUS READ         0.00         0 SEQ. PREFETCH REQS       0.00         0     SEQ. PREFETCH REQS       0.00         0 LIST PREFETCH REQS       0.00         0     LIST PREFETCH REQS       0.00         0 DYN. PREFETCH REQS       1.00        17     DYN. PREFETCH REQS       0.00         0 PAGES READ ASYNCHR.      8.00       136     PAGES READ ASYNCHR.      0.00         0 HPOOL WRITES             0.00         0     HPOOL WRITES             0.00         0 HPOOL WRITES-FAILED      0.00         0     HPOOL WRITES-FAILED      0.00         0 PAGES READ ASYN-HPOOL    0.00         0     PAGES READ ASYN-HPOOL    0.00         0 HPOOL READS              0.00         0     HPOOL READS              0.00         0 HPOOL READS FAILED       0.00         0     HPOOL READS FAILED       0.00         0 TOT4K                 AVERAGE     TOTAL ------------------  ---------  -------- BPOOL HIT RATIO                     N/A GETPAGES               304.47      5176 BUFFER UPDATES          86.00      1462 SYNCHRONOUS WRITE        0.00         0 SYNCHRONOUS READ         0.18         3 SEQ. PREFETCH REQS       7.00       119 LIST PREFETCH REQS       0.00         0 DYN. PREFETCH REQS       1.00        17 PAGES READ ASYNCHR.      8.00       136 HPOOL WRITES             0.00         0 HPOOL WRITES-FAILED      0.00         0 PAGES READ ASYN-HPOOL    0.00         0 HPOOL READS              0.00         0 HPOOL READS FAILED       0.00         0 

The first step is to get a feeling for the overall type of I/O requested for this plan. You should answer the following questions:

  • How many buffer pools were accessed? Were more (or fewer) buffer pools used than expected?

  • Were any 8K, 16K, or 32K buffer pools accessed? Should they have been? Use of buffer pools larger than 4K can greatly affect the performance by increasing I/O costs.

  • Did the program read pages from an associated hiperpool?

  • Was sequential prefetch used? Based on your knowledge of the program, should it have been? Was dynamic prefetch enabled (sequential detection)?

  • Was list prefetch invoked? If so, be sure to analyze the RID List Processing in the Miscellaneous Information section of this report (discussed in the preceding section).

  • How many pages were requested ( GETPAGES )? The number of GETPAGES is a good indicator of the amount of work being done by the program.

  • Were any synchronous writes performed? A synchronous write is sometimes called a non-deferred write. Synchronous writes occur immediately on request. Most DB2 writes are deferred, which means that they are made in the buffer pool and recorded in the log but not physically externalized to DASD until later. Synchronous writes usually indicate that the buffer pool is over-utilized.

All the aforementioned information is broken down by buffer pool.

The next task when analyzing this report is to review the buffer pool hit ratio. It is reported in the BPOOL HIT RATIO (%) field for each buffer pool accessed. The buffer pool hit ratio is calculated as follows:


 BPOOL HIT RATIO = ((GETPAGES  PAGES READ FROM DASD) / GETPAGES) * 100 

PAGES READ FROM DASD is the sum of synchronous reads, and the number of pages read using prefetch (sequential prefetch, list prefetch, and dynamic prefetch). The buffer pool hit ratio gives you an idea of how well the SQL in this plan has used the available buffer pools.

In general, the higher the buffer pool hit ratio, the better. The highest possible value for the hit ratio percentage is 100. When every page requested is always in the buffer pool, the hit ratio percentage is 100. The lowest buffer pool hit ratio happens when all of the requested pages are not in the buffer pool. The buffer pool hit ratio will be 0 or less when that happens. A negative hit ratio can mean one of two things:

  • Prefetch (sequential or dynamic) has read pages into the buffer pool that were not referenced, or;

  • Thrashing in the buffer pool caused by a buffer pool that is too small or by a large batch job running during a busy time. One scenario has the batch job requesting prefetch and then getting suspended waiting for CPU. During the interim, pages requested by prefetch were over-written by another process ”so they have to be read into the buffer pool all over again.

A low buffer pool hit ratio is not necessarily bad. The buffer pool hit ratio can vary greatly from program to program. A program that accesses a large amount of data using table space scans could have a very low hit ratio. But that does not mean the application is performing poorly. You should compare the buffer pool hit ratio for different executions of the same program. If the percentage lowers significantly over time, there may be a problem that needs correcting.

General guidelines for acceptable buffer pool hit ratios follow:

  • For online transactions with significant random access, the buffer pool hit ratio can be low while still providing good I/O utilization.

  • For transactions that open cursors and fetch numerous rows, the buffer pool hit ratio should be higher. However, it is not abnormal for online transactions to have a low hit ratio.

  • For batch programs, shoot for a high buffer pool hit ratio. The actual buffer pool hit ratio each program can achieve is highly dependent on the functionality required for that program. Programs with a large amount of sequential access should have a much higher read efficiency than those processing randomly .

  • When programs have very few SQL statements, or SQL statements returning a single row, the buffer pool hit ratio is generally low. Because few SQL statements are issued, the potential for using buffered input is reduced.

The buffer pool hit ratio also can be calculated by buffer pool for all processes. This hit ratio can be compared to the hit ratio for the plan in question to determine its effectiveness versus other processes. Remember, though, when the buffer pool hit ratio is calculated using the information from an accounting report, it is for a single plan only. You can ascertain the overall effectiveness of each buffer pool by calculating hit ratio based on information from a DB2 PM system statistics report or from the -DISPLAY BUFFERPOOL command.

Long Accounting Report: Package/DBRM Information

The final component of the long accounting report is detailed information for each package and DBRM in the plan (see Listing 24.10). To obtain this information, you must start the appropriate accounting traces (Class 7 and Class 8).

Listing 24.10. Accounting Report ”Long (Part 9)
 PRG00100            VALUE         PRG00100                 TIMES  PRG00100 graphics/ccc.gif AVERAGE TIME  AVG.EV  TIME/EVENT ------------------  ------------  ------------------  ----------  -------------- graphics/ccc.gif -------------  ------  ---------- TYPE                DBRM          ELAP-CL7 TIME-AVG     0.670800  LOCK/LATCH graphics/ccc.gif 0.009924    1.00    0.009924                                   TCB                   0.556637  SYNCHRONOUS I/O graphics/ccc.gif 0.000000    0.00         N/C LOCATION            N/A           WAITING               0.114162  OTHER READ I/O graphics/ccc.gif 0.000000    0.00         N/C COLLECTION ID       N/A           SUSPENSION-CL8        0.009924  OTHER WRITE I/O graphics/ccc.gif 0.000000    0.00         N/C PROGRAM NAME        PRG00100      NOT ACCOUNTED         0.110076  SERV.TASK SWITCH graphics/ccc.gif 0.000000    0.00         N/C                                                                   ARCH.LOG(QUIESCE) graphics/ccc.gif 0.000000    0.00         N/C OCCURENCES                  17    AVG.DB2 ENTRY/EXIT     9122.00  ARCHIVE LOG READ graphics/ccc.gif 0.000000    0.00         N/C SQL STMT - AVERAGE      4559.0    DB2 ENTRY/EXIT          155074  DRAIN LOCK graphics/ccc.gif 0.000000    0.00         N/C SQL STMT - TOTAL         77503                                    CLAIM RELEASE graphics/ccc.gif 0.000000    0.00         N/C                                   NOT NULL (CL7)              17  PAGE LATCH graphics/ccc.gif 0.000000    0.00         N/C                                                                   TOTAL CL8 SUSPENS. graphics/ccc.gif 0.009924    1.00    0.009924                                                                   NOT NULL (CL8) graphics/ccc.gif 7 PRG00101            VALUE         PRG00101                 TIMES  PRG00101 graphics/ccc.gif AVERAGE TIME  AVG.EV  TIME/EVENT ------------------  ------------  ------------------  ----------  -------------- graphics/ccc.gif -------------  ------  ---------- TYPE                DBRM          ELAP-CL7 TIME-AVG     0.781030  LOCK/LATCH graphics/ccc.gif 0.006902    1.00    0.006902                                   TCB                   0.461371  SYNCHRONOUS I/O graphics/ccc.gif 0.000000    0.00         N/C LOCATION            N/A           WAITING               0.101390  OTHER READ I/O graphics/ccc.gif 0.000000    0.00         N/C COLLECTION ID       N/A           SUSPENSION-CL8        0.010430  OTHER WRITE I/O graphics/ccc.gif 0.000000    0.00         N/C PROGRAM NAME        PRG00101      NOT ACCOUNTED         0.102061  SERV.TASK SWITCH graphics/ccc.gif 0.000000    0.00         N/C                                                                   ARCH.LOG(QUIESCE) graphics/ccc.gif 0.000000    0.00         N/C OCCURENCES                  17    AVG.DB2 ENTRY/EXIT     4573.00  ARCHIVE LOG READ graphics/ccc.gif 0.000000    0.00         N/C SQL STMT - AVERAGE       392.0    DB2 ENTRY/EXIT           77741  DRAIN LOCK graphics/ccc.gif 0.000000    0.00         N/C SQL STMT - TOTAL          6664                                    CLAIM RELEASE graphics/ccc.gif 0.000000    0.00         N/C                                   NOT NULL (CL7)              17  PAGE LATCH graphics/ccc.gif 0.000000    0.00         N/C                                                                   TOTAL CL8 SUSPENS. graphics/ccc.gif 0.006902    1.00    0.006902                                                                   NOT NULL (CL8) graphics/ccc.gif 7 

This level of detail might be necessary for plans composed of multiple DBRMs and/or packages. For example, if a locking problem is identified, determining which DBRM (or package) is experiencing the problem may be difficult if you don't have the appropriate level of detail.

Long Accounting Report: Other Information

There are other portions of the long accounting report that can prove useful. For example, information on RID list processing is provided before the bufferpool section (see Listing 24.11).

Listing 24.11. Accounting Report ”Long (Other)
 RID LIST          AVERAGE ---------------  -------- USED                 0.00 FAIL-NO STORAGE      0.00 FAIL-LIMIT EXC.      0.00 

If any access path in the application program requires either list prefetch or a hybrid join, analysis of the RID LIST performance statistics is essential. Of particular importance is the FAIL-NO STORAGE value. Whenever this value is not zero ( ), you should take immediate action either to increase the size of the RID pool or tweak the access path to eliminate RID list processing.

Other useful information you can obtain from the long accounting report includes ROWID access, logging details, and reoptimization statistics.

Accounting Trace Reports

The accounting report set also contains two additional reports: the Short and Long Accounting Trace reports. These reports produce similar information, but for a single execution of a plan. By contrast, the short and long accounting reports provide performance information averaged for all executions of a plan by a given user. If you need to investigate a single, specific execution of a DB2 program, use the accounting trace reports.

Audit Report Set

The DB2 PM audit report set shows DB2 auditing information. Although this data is generally not performance-oriented, you can use it to monitor usage characteristics of a DB2 subsystem. The Audit Summary report, shown in Listing 24.12, is a synopsis of the eight audit trace categories (as outlined previously in this chapter).

Listing 24.12. DB2 PM Audit Summary Report
 LOCATION: HOUSTON                      DB2 PERFORMANCE MONITOR graphics/ccc.gif PAGE: 1-1         GROUP: DB2G1P                          AUDIT REPORT - SUMMARY graphics/ccc.gif REQUESTED FROM: NOT SPECIFIED        MEMBER: DB2P graphics/ccc.gif TO: NOT SPECIFIED     SUBSYSTEM: DB2P                           ORDER: PRIMAUTH-PLANNAME graphics/ccc.gif ACTUAL FROM: 12/02/03 07:28:39.17   DB2 VERSION: V7                                   SCOPE: MEMBER graphics/ccc.gif TO: 12/02/03 11:31:12.25                            AUTH      GRANT/    DDL     DML READ   DML WRITE    DML graphics/ccc.gif AUTHID   UTILITY PRIMAUTH PLANNAME  TOTAL   FAILURE   REVOKE    ACCESS  ACCESS     ACCESS       AT BIND graphics/ccc.gif CHANGE   ACCESS -------- --------  -----   -------   ------    ------  --------   ---------    ------- graphics/ccc.gif ------   ------- AUTHID2          DSNTEP2       4         0        0          0        0           0          4 graphics/ccc.gif 0          0          DSNUTIL       4         0        0          0        0           0          0 graphics/ccc.gif 0          4          TXN00001     12         1        0          1        2           2          0 graphics/ccc.gif 0          0          TXN00012     10         0        0          0        2           5          0 graphics/ccc.gif 10          0 *TOTAL*               30         1        0          1        4           7          4 graphics/ccc.gif 10          4 AUTHID5          DSNTEP2       4         0        0          0        0           0          4 graphics/ccc.gif 0          0          TXN00030     16         2        1          8        2           2          0 graphics/ccc.gif 2          0 *TOTAL*               20         2        1          8        2           2          4 graphics/ccc.gif 2          4 *GRAND TOTAL*         50         3        1          9        6           9          8 graphics/ccc.gif 12          8 END OF REPORT 

If you require further audit detail, DB2 PM also provides an Audit Detail report and an Audit Trace report. The Audit Detail report breaks each category into a separate report, showing the resource accessed, the date and the time of the access, and other pertinent information. The Audit Trace report displays each audit trace record in timestamp order.

The Explain Report Set

The explain report set describes the DB2 access path of selected SQL statements. DB2 uses the EXPLAIN command and information from the DB2 Catalog to produce a description of the access path chosen. Combining information from the PLAN_TABLE and the DB2 Catalog is the primary purpose of the DB2 PM explain report set. To execute reports in the explain report set, you must have access to DB2. This requirement differs from most of the other DB2 PM reports.

I/O Activity Report Set

The I/O activity report set is somewhat misnamed. It does not report on the I/O activity of DB2 applications. Instead, it offers details on the I/O activity of DB2 buffer pools, the EDM pool, and the log manager. An example of the information provided on the I/O Activity Summary report is shown in Listing 24.13.

Listing 24.13. DB2 PM I/O Activity Summary Report
 AET BUFFER POOL                    TOTALS  SSSS.THT --------------------------  ---------  -------- TOTAL I/O REQUESTS                262    0.014 TOTAL READ I/O REQUESTS           247    0.012   NON-PREFETCH READS              171   PREFETCH REQUESTS     UNSUCCESSFUL                    1     SUCCESSFUL                     75     PAGES READ                    N/C     PAGES READ / SUCC READ        N/C TOTAL WRITE REQUESTS               68    0.164   SYNCH WRITES                      1    0.021    PAGES WRITTEN PER WRITE        1.0   ASYNCH WRITES                    67    0.164    PAGES WRITTEN PER WRITE        2.3                             CT/PT/DBD   LOADS      AET       AVG LEN EDM POOL                    REFERENCES  FROM DASD  SSSS.THT  (BYTES) -------------------------  -----------  --------   --------  ------- CURSOR TABLE - HEADER                1         1      0.000   2049.0 CURSOR TABLE - DIRECTORY             0         0        N/C      0.0 CURSOR TABLE - RDS SECTION           4         4      0.000    634.0   -- TOTAL PLANS --                  5         5      0.000   5474.0   -- TOTAL PLANS --                  5         5      0.000   5474.0 PACKAGE TABLE - HEADER               2         2      0.003   1208.0 PACKAGE TABLE - DIRECTORY            2         2      0.001    156.0 PACKAGE TABLE - RDS SECTION          6         6      0.001    747.7   -- TOTAL PACKAGES --               10        10     0.002    719.6   -- TOTAL PACKAGES --               10        10     0.002    719.6 DATABASE DESCRIPTORS                 1         1      0.000   4012.0                                       AET ACTIVE LOG                     TOTALS SSSS.THT --------------------------  ---------  -------- TOTAL WAITS                        22    0.015 READ REQUESTS                       0      N/C WRITE REQUESTS                     22    0.015 CONT. CI / WRITE                  1.6 OTHER WAITS                         0      N/C   ALLOCATE                          0      N/C   DEALLOCATE                        0      N/C   ARCHIVE UNAVAILABLE               0      N/C   BUFFERS UNAVAILABLE               0      N/C   DATASET UNAVAILABLE               0      N/C   OPEN                              0      N/C   CLOSE                             0      N/C                              AET ARCHIVE LOG/BSDS     TOTALS  SSSS.THT ------------------  -------  -------- ARCHIVE WAITS             0       N/C ARCHIVE READ REQ          0       N/C   DASD READ               0   TAPE READ               0 ARCHIVE WRITE REQ         0       N/C BLOCK / WRITE           N/C BSDS READ REQ             2     0.089 BSDS WRITE REQ            2     0.044 

As with the other report sets, the I/O activity report set provides detail reports that show in greater detail the I/O activity for each of these resources.

Locking Report Set

The locking report set provides reports that disclose lock contention and suspensions in the DB2 subsystem. These reports can be helpful when you're analyzing locking- related problems.

For example, if a Long Accounting report indicated a high number of timeouts or deadlocks, a Lock Contention Summary report, such as the one shown in Listing 24.14, could be produced. This report provides information on who was involved in the contention and what resource was unavailable because of the lock.

Listing 24.14. DB2 PM Lock Contention Summary Report
 LOCK CONTENTION SUMMARY LOCATION: CHICAGO                         BY PRIMAUTH/PLANNAME ------ TASK HOLDING RESOURCE ------ ---- TASK WAITING ON RESOURCE ---- PRIMAUTH    PLANNAME          PRIMAUTH    PLANNAME                DATABASE      OBJECT graphics/ccc.gif TIMEOUTS    DEADLOCK --------    --------          --------    --------                --------     -------- graphics/ccc.gif --------    -------- AUTHID01    DSNESPRR          AUTHID02    TXN00001                DSN8D23A     DSN8S23D graphics/ccc.gif 1           0 

If more details on locking problems are needed, you can use the Lock Suspension Summary report. This report is useful when an accounting report indicates a high number of lock suspensions. The Lock Suspension Summary details the cause of each suspension and whether it was subsequently resumed or resulted in a timeout or deadlock.

Record Trace Report Set

The record trace report set provides not reports per se, but a dump of the trace records fed to it as input. The record trace reports are not molded into a report format as are the other DB2 PM reports. They simply display DB2 trace records in a readable format.

The three record trace reports are the Record Trace Summary report, the Sort Record Trace report, and the Long Record Trace report. The Record Trace Summary report lists an overview of the DB2 trace records, without all the supporting detail. The Sort Record Trace report provides a listing of most of the DB2 trace records you need to see, along with supporting detail. Several serviceability trace records are not displayed. The Long Record Trace report lists all DB2 trace records.

The record trace reports are useful for determining what type of trace data is available for an input source data set. If another DB2 PM execution (to produce, for example, an accounting detail report) is unsuccessful or does not produce the data you want, you can run a record trace to ensure that the input data set contains the needed trace records to produce the requested report.

Note that the record trace reports might produce a large amount of output. You can specify which types of DB2 trace records should be displayed. If you're looking for a particular type of trace record, be sure to reduce your output by specifying the data for which you're looking.

SQL Trace Report Set

To monitor the performance of data manipulation language statements, you can use the SQL trace report set. These reports are necessary only when a program has encountered a performance problem. The SQL trace breaks down each SQL statement into the events that must occur to satisfy the request. This information includes preparation, aborts, commits, the beginning and ending of each type of SQL statement, cursor opens and closes, accesses due to referential integrity, I/O events, thread creation and termination, and all types of indexed accesses.

You will find four types of SQL trace reports. The SQL Trace Summary report provides a synopsis of each type of SQL statement and the performance characteristics of that statement.

The second type of SQL trace report is the SQL Short Trace report. It lists the performance characteristics of each SQL statement, including the beginning and end of each statement and the work accomplished in between. It does not provide I/O activity, locking, and sorting information.

The SQL Long Trace report provides the same information as the SQL Short Trace report but includes I/O activity, locking, and sorting information.

Finally, the SQL DML report extends the SQL Trace Summary report, providing data for each SQL statement, not just for each SQL statement type.

The SQL Short and Long Trace reports can be extremely long reports that are cumbersome to read. Therefore, producing these reports only when a performance problem must be corrected is usually wise. In addition, the SQL trace reports require the DB2 performance trace to be active. This trace carries a large amount of overhead. Before you request this report, you would be wise to "eyeball" the offending program for glaring errors (such as looping or Cartesian products) and to tinker with the SQL to see whether you can improve performance.

Also, after you produce these reports, you should have more than one experienced analyst read them. I have seen SQL trace reports that were six feet long. Be prepared for a lot of work to ferret out the needed information from these reports.

Statistics Report Set

The second most popular DB2 PM report set (next to the accounting report set) is the statistics report set. Statistics reports provide performance information about the DB2 subsystem. The data on these reports can help you detect areas of concern when you're monitoring DB2 performance. Usually, these reports point you in the direction of a problem; additional DB2 PM reports are required to fully analyze the complete scope of the performance problem.

Listing 24.15, an example of the DB2 PM Statistics Short report, shows a summary of all DB2 activity for the DB2 subsystem during the specified time.

Listing 24.15. DB2 PM Statistics Short Report
 STATISTICS REPORT - SHORT ---- HIGHLIGHTS graphics/ccc.gif ----------------------------------------------------------------------------------------------------------------- graphics/ccc.gif INTERVAL START: 07/10/03 12:32:09.73    INTERVAL ELAPSED: 24:32.77260    INCREMENTAL graphics/ccc.gif BINDS      :   0.00    DBAT QUEUED:    N/P   INTERVAL END  : 07/10/03 12:56:42.51    OUTAGE ELAPSED  :    0.000000    AUTH SUCC.W/OUT graphics/ccc.gif CATALOG:   2.00    DB2 COMMAND:   3.00   SAMPLING START: 07/10/03 12:32:09.73    TOTAL THREADS   :        1.00    BUFF.UPDT/PAGES graphics/ccc.gif WRITTEN:   2.52    TOTAL API  :   0.00   SAMPLING END  : 07/10/03 12:56:42.51    TOTAL COMMITS   :        4.00    PAGES WRITTEN graphics/ccc.gif /WRITE I/O:   1.17    MEMBER     :    N/A   CPU TIMES                               TCB TIME         SRB TIME       TOTAL TIME graphics/ccc.gif OPEN/CLOSE ACTIVITY        QUANTITY   ----------------------------------    ----------    -------------     ------------ graphics/ccc.gif -------------------------  --------   SYSTEM SERVICES ADDRESS SPACE           0.213783         0.097449         0.311232 graphics/ccc.gif OPEN DATASETS - HWM           29.00   DATABASE SERVICES ADDRESS SPACE         0.292474         0.155593         0.448066 graphics/ccc.gif OPEN DATASETS                 29.00   IRLM                                    0.002940         0.447174         0.450114    IN graphics/ccc.gif USE DATA SETS              19.00   DDF ADDRESS SPACE                            N/P              N/P              N/P graphics/ccc.gif SUCCESSFUL LOGICAL REOPEN      6.00   NON-CPU TIME                                 N/A              N/A     24:31.563191   SQL DML   QUANTITY   SQL DCL       QUANTITY   SQL DDL     QUANTITY   LOCKING ACTIVITY graphics/ccc.gif QUANTITY   DATA SHARING LOCKS  QUANTITY   --------- --------   ------------- --------   ----------- --------   ----------------- graphics/ccc.gif --------   ------------------- --------   SELECT        4.00   LOCK TABLE        0.00   CREATES         0.00   DEADLOCKS graphics/ccc.gif 0.00   LOCK REQ.(P-LOCK)      48.00   INSERT       16.00   GRANT             0.00   DROPS           0.00   TIMEOUTS graphics/ccc.gif 0.00   UNLOCK REQ.(P-LCK)      0.00   UPDATE       12.00   REVOKE            0.00   ALTERS          0.00   SUSPENSIONS-LOCK graphics/ccc.gif 2.00   CHANGE REQ.(P-LCK)      9.00   DELETE        0.00   SET HOST VAR.     0.00   COMMENT ON      0.00   SUSPENSIONS-OTHR graphics/ccc.gif 0.00   SYNC.XES - LOCK       186.00   PREPARE       0.00   SET SQLID         0.00   LABEL ON        0.00   LOCK REQUESTS graphics/ccc.gif 351.00   SYNC.XES - CHANGE      13.00   DESCRIBE      0.00   SET DEGREE        0.00   TOTAL           0.00   UNLOCK REQUEST graphics/ccc.gif 178.00   SYNC.XES - UNLOCK     154.00   DESC.TBL      0.00   SET RULES         0.00                          LOCK ESCALAT(SH) graphics/ccc.gif 0.00   ASYN.XES-RESOURCES      0.00   OPEN         16.00   CONNECT TYPE 1    0.00                          LOCK ESCALAT(EX) graphics/ccc.gif 0.00   TOTAL SUSPENDS         30.00   CLOSE         8.00   CONNECT TYPE 2    0.00                          DRAIN REQUESTS graphics/ccc.gif 0.00   P-LCK/NFY ENG.UNAV      0.00   FETCH        20.00   RELEASE           0.00                          CLAIM REQUESTS graphics/ccc.gif 96.00   INCOM.RETAINED LCK      0.00   TOTAL        76.00   SET CONNECTION    0.00 graphics/ccc.gif PSET/PART NEGOTIAT     16.00                        TOTAL               0.00 graphics/ccc.gif PAGE NEGOTIATION        0.00   RID LIST              QUANTITY    STORED PROCEDURES  QUANTITY    QUERY PARALLELISM graphics/ccc.gif QUANTITY    PLAN/PACKAGE PROC.   QUANTITY   --------------------  --------    -----------------  --------    ---------------------- graphics/ccc.gif --------    -------------------  --------   MAX BLOCKS ALLOCATED      0.00    CALL STATEMENTS        0.00    MAX DEGREE graphics/ccc.gif 0.00    PLAN ALLOC-ATTEMPTS      1.00   CURRENT BLKS ALLOC.       0.00    PROCEDURE ABENDS       0.00    GROUPS EXECUTED graphics/ccc.gif 0.00    PLAN ALLOC-SUCCESS       1.00   FAILED-NO STORAGE         0.00    CALL TIMEOUTS          0.00     PLANNED DEGREE graphics/ccc.gif 0.00    PACK ALLOC-ATTEMPTS      0.00   FAILED-RDS LIMIT          0.00    CALL REJECTED          0.00     REDUCED-NO BUFFER graphics/ccc.gif 0.00    PACK ALLOC-SUCCESS       0.00   FAILED-DM LIMIT           0.00                                    FALL TO SEQUENTIAL graphics/ccc.gif 0.00    AUTOBIND ATTEMPTS        0.00   FAILED-PROCESS LIMIT      0.00 graphics/ccc.gif AUTOBIND SUCCESSFUL      0.00   SUBSYSTEM SERVICES                QUANTITY    LOG ACTIVITY graphics/ccc.gif QUANTITY    EDM POOL                   QUANTITY   --------------------------------  --------    --------------------------------- graphics/ccc.gif --------    -------------------------  --------   IDENTIFY                              0.00    READS SATISFIED-OUTPUT BUFFER          0 graphics/ccc.gif .00    PAGES IN EDM POOL            225.00   CREATE THREAD                         1.00    READS SATISFIED-ACTIVE LOG             0 graphics/ccc.gif .00    FREE PAGES IN FREE CHAIN     196.00   SIGNON                                4.00    READS SATISFIED-ARCHIVE LOG            0 graphics/ccc.gif .00    FAILS DUE TO POOL FULL         0.00   TERMINATE                             0.00    READ DELAYED-UNAVAILABLE RESOURCE      0 graphics/ccc.gif .00    PAGES USED FOR CT              8.00   ROLLBACK                              0.00    READ DELAYED-ARCH.ALLOC. LIMIT          N graphics/ccc.gif /A    PAGES USED FOR PT              0.00   COMMIT PHASE 1                        4.00    WRITE-NOWAIT                          76 graphics/ccc.gif .00    PAGES USED FOR DBD            12.00   COMMIT PHASE 2                        4.00    WRITE OUTPUT LOG BUFFERS               8 graphics/ccc.gif .00    PAGES USED FOR SKCT            9.00   READ ONLY COMMIT                      0.00    BSDS ACCESS REQUESTS                   2 graphics/ccc.gif .00    PAGES USED FOR SKPT            0.00   UNITS OF RECOVERY GONE INDOUBT        0.00    UNAVAILABLE OUTPUT LOG BUFFER          0 graphics/ccc.gif .00    REQUESTS FOR CT SECTIONS      10.00   UNITS OF RECOVERY INDOUBT RESOLV      0.00    CONTROL INTERVAL CREATED-ACTIVE        3 graphics/ccc.gif .00    CT NOT IN EDM POOL            10.00   SYNCHS (SINGLE PHASE COMMIT)          0.00    ARCHIVE LOG READ ALLOCATION            0 graphics/ccc.gif .00    REQUESTS FOR PT SECTIONS       0.00   QUEUED AT CREATE THREAD               0.00    ARCHIVE LOG WRITE ALLOCAT.             0 graphics/ccc.gif .00    PT NOT IN EDM POOL             0.00   SYSTEM EVENT CHECKPOINT               0.00 graphics/ccc.gif REQUESTS FOR DBD SECTIONS      3.00 graphics/ccc.gif DBD NOT IN EDM POOL            0.00   BP0    GENERAL        QUANTITY    BP2    GENERAL        QUANTITY    TOT4K  GENERAL graphics/ccc.gif QUANTITY   --------------------- --------    --------------------- -------- graphics/ccc.gif --------------------- --------   EXPANSIONS                 N/A    EXPANSIONS                 N/A    EXPANSIONS graphics/ccc.gif N/A   GETPAGES-SEQ&RANDOM    2302.00    GETPAGES-SEQ&RANDOM      72.00    GETPAGES-SEQ&RANDOM graphics/ccc.gif 2375.00   GETPAGES-SEQ.ONLY         0.00    GETPAGES-SEQ.ONLY         0.00    GETPAGES-SEQ.ONLY graphics/ccc.gif 0.00   SYNC.READ-SEQ&RANDOM     12.00    SYNC.READ-SEQ&RANDOM     27.00    SYNC.READ-SEQ&RANDOM graphics/ccc.gif 39.00   SYNC.READ-SEQ.ONLY        0.00    SYNC.READ-SEQ.ONLY        0.00    SYNC.READ-SEQ.ONLY graphics/ccc.gif 0.00   SEQ.PREFETCH REQ         10.00    SEQ.PREFETCH REQ          0.00    SEQ.PREFETCH REQ graphics/ccc.gif 10.00   SEQ.PREFETCH READS       10.00    SEQ.PREFETCH READS        0.00    SEQ.PREFETCH READS graphics/ccc.gif 10.00   PAGES READ-SEQ.PREF.    159.00    PAGES READ-SEQ.PREF.      0.00    PAGES READ-SEQ.PREF. graphics/ccc.gif 159.00   LST.PREFETCH REQUEST      0.00    LST.PREFETCH REQUEST      0.00    LST.PREFETCH REQUEST graphics/ccc.gif 0.00   LST.PREFETCH READS        0.00    LST.PREFETCH READS        0.00    LST.PREFETCH READS graphics/ccc.gif 0.00   PAGES READ-LST.PREF.      0.00    PAGES READ-LST.PREF.      0.00    PAGES READ-LST.PREF. graphics/ccc.gif 0.00   DYN.PREFETCH REQUEST      0.00    DYN.PREFETCH REQUEST      0.00    DYN.PREFETCH REQUEST graphics/ccc.gif 0.00   DYN.PREFETCH READS        0.00    DYN.PREFETCH READS        0.00    DYN.PREFETCH READS graphics/ccc.gif 0.00   PAGES READ-DYN.PREF.      0.00    PAGES READ-DYN.PREF.      0.00    PAGES READ-DYN.PREF. graphics/ccc.gif 0.00   BUFFER UPDATES           37.00    BUFFER UPDATES           16.00    BUFFER UPDATES graphics/ccc.gif 53.00   SYNCHRONOUS WRITES        0.00    SYNCHRONOUS WRITES        0.00    SYNCHRONOUS WRITES graphics/ccc.gif 0.00   ASYNCHRONOUS WRITES      15.00    ASYNCHRONOUS WRITES       3.00    ASYNCHRONOUS WRITES graphics/ccc.gif 18.00   DATA SET OPENS           10.00    DATA SET OPENS            8.00    DATA SET OPENS graphics/ccc.gif 18.00   HDW THRESHOLD             0.00    HDW THRESHOLD             0.00    HDW THRESHOLD graphics/ccc.gif 0.00   VDW THRESHOLD             0.00    VDW THRESHOLD             0.00    VDW THRESHOLD graphics/ccc.gif 0.00   DM THRESHOLD              0.00    DM THRESHOLD              0.00    DM THRESHOLD graphics/ccc.gif 0.00   GROUP BP0             QUANTITY    GROUP BP2             QUANTITY    GROUP TOT4K graphics/ccc.gif QUANTITY   --------------------- --------    --------------------- -------- graphics/ccc.gif --------------------- --------   SYN.READ(XI)-RETURN     422.00    SYN.READ(XI)-RETURN       9.00    SYN.READ(XI)-RETURN graphics/ccc.gif 431.00   SYN.READ(XI)-R/W INT      0.00    SYN.READ(XI)-R/W INT      0.00    SYN.READ(XI)-R/W INT graphics/ccc.gif 0.00   SYN.READ(XI)-NO R/W       0.00    SYN.READ(XI)-NO R/W       0.00    SYN.READ(XI)-NO R/W graphics/ccc.gif 0.00   SYN.READ(NF)-RETURN       0.00    SYN.READ(NF)-RETURN       0.00    SYN.READ(NF)-RETURN graphics/ccc.gif 0.00   SYN.READ(NF)-R/W INT      1.00    SYN.READ(NF)-R/W INT      0.00    SYN.READ(NF)-R/W INT graphics/ccc.gif 1.00   SYN.READ(NF)-NO R/W       0.00    SYN.READ(NF)-NO R/W       0.00    SYN.READ(NF)-NO R/W graphics/ccc.gif 0.00   ASYN.READ-RETURNED        0.00    ASYN.READ-RETURNED        0.00    ASYN.READ-RETURNED graphics/ccc.gif 0.00   ASYN.READ-R/W INT.        0.00    ASYN.READ-R/W INT.        0.00    ASYN.READ-R/W INT. graphics/ccc.gif 0.00   ASYN.READ-NO R/W INT      0.00    ASYN.READ-NO R/W INT      0.00    ASYN.READ-NO R/W INT graphics/ccc.gif 0.00   CLEAN PAGES SYN.WRTN      0.00    CLEAN PAGES SYN.WRTN      0.00    CLEAN PAGES SYN.WRTN graphics/ccc.gif 0.00   CHANGED PGS SYN.WRTN     20.00    CHANGED PGS SYN.WRTN      9.00    CHANGED PGS SYN.WRTN graphics/ccc.gif 29.00   CLEAN PAGES ASYN.WRT      0.00    CLEAN PAGES ASYN.WRT      0.00    CLEAN PAGES ASYN.WRT graphics/ccc.gif 0.00   CHANGED PGS ASYN.WRT     12.00    CHANGED PGS ASYN.WRT      3.00    CHANGED PGS ASYN.WRT graphics/ccc.gif 15.00   REG.PG LIST (RPL) RQ      0.00    REG.PG LIST (RPL) RQ      0.00    REG.PG LIST (RPL) RQ graphics/ccc.gif 0.00   CLEAN PGS READ RPL        0.00    CLEAN PGS READ RPL        0.00    CLEAN PGS READ RPL graphics/ccc.gif 0.00   CHANGED PGS READ RPL      0.00    CHANGED PGS READ RPL      0.00    CHANGED PGS READ RPL graphics/ccc.gif 0.00   PAGES CASTOUT            18.00    PAGES CASTOUT             3.00    PAGES CASTOUT graphics/ccc.gif 21.00   CASTOUT CLASS THRESH      0.00    CASTOUT CLASS THRESH      0.00    CASTOUT CLASS THRESH graphics/ccc.gif 0.00   GROUP BP CAST.THRESH      0.00    GROUP BP CAST.THRESH      0.00    GROUP BP CAST.THRESH graphics/ccc.gif 0.00   CASTOUT ENG.UNAVAIL.      0.00    CASTOUT ENG.UNAVAIL.      0.00    CASTOUT ENG.UNAVAIL. graphics/ccc.gif 0.00   WRITE ENG.UNAVAIL.        0.00    WRITE ENG.UNAVAIL.        0.00    WRITE ENG.UNAVAIL. graphics/ccc.gif 0.00   READ FAILED-NO STOR.      0.00    READ FAILED-NO STOR.      0.00    READ FAILED-NO STOR. graphics/ccc.gif 0.00   WRITE FAILED-NO STOR      0.00    WRITE FAILED-NO STOR      0.00    WRITE FAILED-NO STOR graphics/ccc.gif 0.00   OTHER REQUESTS           43.00    OTHER REQUESTS           17.00    OTHER REQUESTS graphics/ccc.gif 60.00 

You can use this report to monitor a DB2 subsystem at a glance. Pertinent systemwide statistics are provided for buffer pool management, log management, locking, and EDM pool utilization.

The Statistics Short report is useful for monitoring the DB2 buffer pools, specifically regarding I/O activity and buffer pool utilization. One statistic of interest is the DATA SET OPENS number, which indicates the number of times a VSAM open was requested for a DB2 tablespace or index. In the example, the number for BP0 is 10 ; for BP2 , it is 8 . A large number of data set opens could indicate that an object was defined with CLOSE YES . This may not be a problem, however, because the number is relatively low (in this example) and objects are also opened when they are first requested.

You should analyze the other buffer pool report items to get an idea of the overall efficiency of the buffer pool. For example, you can calculate the overall efficiency of the buffer pool using this calculation:


 GETPAGE REQUESTS / ((PREFETCH READ I/O OPERATIONS) + (TOTAL READ I/O OPERATIONS)) 

In the example, the buffer pool read efficiency for BP0 is


 2302 / [12 + 10] = 104.63 

This number is quite good. It is typically smaller for transaction-oriented environments and larger for batch-oriented environments. Also, this number is larger if you have large buffer pools. Other factors affecting read efficiency are the length of the sample, the amount of time since the last recycle of DB2, and the mix of concurrent applications.

In addition, the following buffer pool report numbers should be zero ( ):

Buffer Pool Expansions

Synchronous Writes

HDW Threshold

VDW Threshold

DM Threshold

Work File Not Created ”No Buffer

If these numbers are not zero, the buffer pools have not been specified adequately. Refer to Chapter 28, "Tuning DB2's Components," for advice on setting up your buffer pools.

Information on group buffer pools for data sharing environments follows the local buffer pool information.

The Statistics reports also can assist you in monitoring log management. You can determine the types of processing during this timeframe from viewing the Log Activity section. If Reads Satisfied from Active Log or Reads Satisfied from Archive Log is greater than zero, a recover utility was run during this timeframe. You can glean additional recovery information from the Subsystem Service portion of the report.

Also, ensure that the Unavailable Output Log Buffers is zero. If it is not, you should specify additional log buffers in your DSNZPARM start-up parameters.

Another aspect of DB2 system-wide performance that the DB2 Statistics report helps to monitor is locking. This report is particularly useful for monitoring the number of suspensions, deadlocks, and timeouts in proportion to the total number of locks requested. Use the following calculation:


 LOCK REQUESTS / (SUSPENSIONS-LOCK + SUSPENSIONS-OTHER + DEADLOCKS + TIMEOUTS) 

This calculation provides you with a ratio of troublesome locks to successful locks, as shown here:


 351 / (2 + 0 + 0 + 0) = 175.5 

The larger this number, the less lock contention your system is experiencing. Data sharing lock requests ( P -locks) are also displayed on the DB2 Statistics report.

EDM pool utilization is the final system-wide performance indicator that you can monitor using the DB2 Statistics Short report. To calculate the efficiency of the EDM pool, use the following formula:


 ((REQ FOR CT SECTIONS) + (REQUESTS FOR DBD)) / ((LOAD CT SECT FROM DASD) + (LOAD DBD FROM graphics/ccc.gif DASD)) 

Using the example, here's the calculation:


 (151 + 432) / (70 + 0) = 8.32 

Therefore, on average, 8.32 cursor tables and DBDs were requested before DB2 had to read one from DASD. This number should be as high as possible to avoid delays due to reading objects from the DB2 Directory.

In addition to the Statistics Summary report, a Statistics Detail report provides multiple pages of detail supporting the summary information. Also, the Short and Long Statistics Trace reports are useful for analyzing DB2 resource use in-depth.

Summary Report Set

The summary report set is used to provide a summarization of DB2 PM events. Three summary reports are provided every time DB2 PM is run.

The Job Summary Log details the traces that were started and stopped during the timeframe that was reported. Additionally, a summary of the requested DB2 PM reports is provided. The Message Log contains any DB2 PM error messages. Finally, the Trace Record Distribution report provides a synopsis of the types of DB2 trace records and the number of times they were encountered in this job.

These reports are not useful for evaluating DB2 performance. They are used solely to support DB2 PM processing.

System Parameters Report Set

The DB2 PM System Parameters report provides a formatted listing of the DSNZPARM parameters specified when DB2 was started. This two-page report shows information such as the following:

  • Install SYSADM IDs and Install SYSOPR IDs

  • EDM Pool Size

  • Bufferpool Sizes and Information

  • IRLM Information (IRLM Name, IRLMRWT , Auto Start)

  • User Information ( CTHREAD , IDFORE , IDBACK )

  • Automatic Trace Start Information

  • Lock Escalation

  • Log Information (Number of Archive Logs, Archive Copy Prefixes, Checkpoint Frequency)

  • Data Definition Control Support

  • Distributed Database Information (DDF)

  • Stored Procedure Information (SPAS)

  • DFHSM Usage

  • Other System Parameters

The System Parameters report can be produced automatically in conjunction with any other DB2 PM reports. It is produced only if a -START TRACE command was issued during the timeframe for the requested report. This report is useful for determining the parameters in use for the DB2 subsystem.

Transit Time Report Set

The final report set is the transit time report set. A transit report differs from other types of reports in that it provides performance information for all events that occur between a create thread and a terminate thread. A transit can be several plan executions due to thread reuse.

The Transit Time Summary report, shown in Listing 24.16, breaks down transit information into its components. For example, the transit for the DSNUTIL plan is broken down into the time for each separate phase of the REORG .

Listing 24.16. DB2 PM Transit Time Summary Report
 INTERVAL FROM 7/25/03 12:24:35.63                 DB2 PERFORMANCE MONITOR              DB2 graphics/ccc.gif ID:   DB2T        PAGE     1          TO   7/25/03 00:05:43.02                                                     TRANSIT TIME SUMMARY graphics/ccc.gif REQUESTED FROM     NOT SPECIFIED graphics/ccc.gif TO       NOT SPECIFIED                                                     BY PRIMAUTH/PLANNAME ------------------------------- AVERAGE  ELAPSED TIMES -----               TOTAL graphics/ccc.gif DETAIL          TRANSITS, #CREATE CREATE  COMMIT,                            ---- WORKLOAD ---- graphics/ccc.gif ---- WORKLOAD ----           TOTAL    THREAD, THREAD,  TERM.     DB2,     TRANSIT PRIMAUTH PLANNAME TRANSIT AET #COMMIT SIGNON  THREAD  UNATTRIB.    TYPE   # OCCUR    AET graphics/ccc.gif TYPE       #OCCUR  AET                   MMM:SS.THT          SSS.THT SSS.THT MMM:SS.THT                   MMM:SS.THT -------- -------- ----------  ------- ------- ------- ---------- -------- ------- graphics/ccc.gif ----------  ----------- ------ --- AUTHID02  DSNUTIL          1        1   0.001   0.091      8.702  UTILITY       1       8 graphics/ccc.gif .702  PHASE  TYPE #ITEMS  PHS ET                        9.552        4   0.000   0.019      0.809  REORG         1 graphics/ccc.gif UNLOAD    R     18  0.527 graphics/ccc.gif RELOAD    R      9  3.980 graphics/ccc.gif SORT      I     18  4.102 graphics/ccc.gif BUILD     I     18  0.893 

Different levels of detail are provided by the three other types of transit time reports: Transit Time Detail report, Short Transit Time Trace report, and Long Transit Time Trace report.

Transit time reports are useful for determining the performance of DB2 utility phases and SQL activity. Like the SQL trace reports, they may contain a large amount of information and should be used only when specific performance problems are encountered.

 <  Day Day Up  >  


DB2 Developers Guide
DB2 Developers Guide (5th Edition)
ISBN: 0672326132
EAN: 2147483647
Year: 2004
Pages: 388

flylib.com © 2008-2017.
If you may any questions please contact us: flylib@qtcs.net