Developing with Microsoft Excel
Microsoft Excel provides a number of interesting features that can help you manipulate the data you receive from Google Web Services. Sometimes you have to gather this data over time. For example, you might collect changes to a list of Web sites each day at 10:00. These Web sites could be the top 10 returns for a particular Google query, so the list would change over time to reflect changes in Google's search algorithm, changes in the Web sites, and natural changes in the relevancy of the Web sites. After some time, you can chart this information and see how your search data is affected by changes on the Internet. For example, this kind of statistic could help signal a need to make changes to your Web site to better compete with other sites on the Internet.
| Tip | Some types of statistical analysis for Google Web Services are very time sensitive. Consequently, you'll want to use something like Task Scheduler to ensure the system gathers the data at the same time each day. You can perform this task in a number of ways, including relying on the automatic document execution feature of Excel. Simply opening the document ensures the macro that gathers the data runs. |
The following sections demonstrate ways to use Microsoft Excel with Google Web Services. It's important to remember that these sections are just examples ”you can probably use Google Web Services in other ways. All you really need is an idea of how the data you can obtain from Google works into your company's use of the Web site. For an in-depth treatment of the topic, see Mastering Excel 2003 Programming with VBA by Steven M. Hansen (Sybex, 2004).
Performing a Simple Search Using SOAP
The example in this section isn't awe inspiring , but it does provide a good starting point for working with Google Web Services from Excel. Essentially, you create a connection to Google from Excel using SOAP, just as the examples in Chapters 3 and 4 demonstrated for Web pages. However, as these sections show, Excel is far more capable than a simple Web page that relies on JavaScript. You'll find that once you gain access to the data through the application, you can perform myriad tasks .
Defining the Required References
To make this example work, you must create a reference to object libraries on your system. These object libraries have classes with methods and properties you need to work with SOAP and XML using VBA. Most of the examples you build can use any of the Microsoft XML libraries and the Microsoft SOAP Library. However, you don't have to use either of these libraries ”many third party vendors create SOAP and XML libraries that work fine with VBA. The main requirement is that you have libraries that do work with SOAP and XML.
Adding a reference is easy. Open the Visual Basic editor using the Tools ![]() Macro
Macro ![]() Visual Basic Editor command. Once the IDE is visible, open the References dialog box shown in Figure 5.3 using the Tools
Visual Basic Editor command. Once the IDE is visible, open the References dialog box shown in Figure 5.3 using the Tools ![]() References command.
References command.
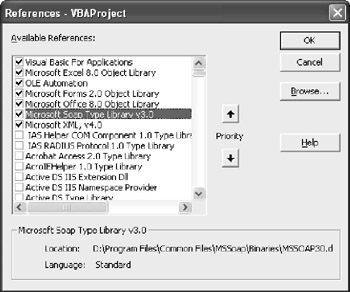
Figure 5.3: The References dialog box helps you add an object library reference to VBA.
Creating the Query Code
Creating a Google query using Excel is similar to using other languages such as JavaScript, but you need to consider some definite issues, such as the format of the response data. Listing 5.1 shows the essentials of how to make a simple request using VBA from Excel. You'll find the complete source for this example in the \Chapter 05\Excel folder of the source code located on the Sybex Web site.
| |
Public Sub SimpleQuery() Dim Client As SoapClient30 ' SOAP Client Dim Doc As IXMLDOMSelection ' Entire Result Set Dim Results As IXMLDOMNode ' Search Results Dim Item As IXMLDOMNode ' Individual Item Dim ItemData As IXMLDOMNode ' Item Data Element Dim Counter As Integer ' Loop Counter Dim ItemCount As Integer ' Counter for Item Results Dim DataCount As Integer ' Data Item Count Dim RealData As Integer ' Actual Item Count ' Create and initialize the SOAP client. Set Client = New SoapClient30 Client.MSSoapInit "http://api.google.com/GoogleSearch.wsdl",_ "GoogleSearchService",_ "GoogleSearchPort" ' Make a search request. Set Doc =_ Client.doGoogleSearch("Your-License-Key", _ Sheet1.Cells(1, 2), _ 0, _ 10, _ False, _ "", _ False, _ "", _ "", _ "") ' Display the results on screen. For Counter = 0 To Doc.Length - 1 ' Get the node. Set Results = Doc(Counter) ' Check the node type and react accordingly. Select Case Results.baseName ' Is document filtering enabled? Case "documentFiltering" Sheet1.Cells(3, 2) = Results.Text ... Other Top Level Data ... ' Ending search result. Case "endIndex" Sheet1.Cells(7, 2) = Results.Text ' Set the real item counter. RealData = 0 ' Process each item in turn. For ItemCount = 0 To Results.childNodes.Length - 1 ' Get the item. Set Item = Results.childNodes(ItemCount) ' Determine whether this is a data item. If Item.baseName = "item" Then ' Process each item data element in turn. For DataCount = 0 To Item.childNodes.Length - 1 ' Get the data item. Set ItemData = Item.childNodes(DataCount) ' Print the required data on screen. Select Case ItemData.baseName Case "title" Sheet1.Cells(11 + RealData, 1) = _ StringToText(ItemData.Text) Case "URL" Sheet1.Cells(11 + RealData, 2) = _ "=HYPERLINK(" + Chr(34) + _ ItemData.Text + Chr(34) + ", " + _ Chr(34) + ItemData.Text + Chr(34) + ")" Case "cachedSize" Sheet1.Cells(11 + RealData, 3) = _ ItemData.Text End Select Next ' Update the real data counter. RealData = RealData + 1 End If Next End Select Next End Sub | |
If the beginning code looks similar to the JavaScript examples in the book, you're right ”VBA does start by creating a SOAP client and making a call to Google. All of the input arguments are the same as those discussed in the "Defining the Search Request Arguments" section of Chapter 4. However, this is where the similarities end.
VBA provides more power for processing the data, so you have some new data types and capabilities to consider. Unlike other languages, you must use the IXMLDOMSelection data type to store the raw results from Google. The Doc object contains the entire document. The code begins by creating a loop to process the top-level elements, such as <documentFiltering> and <estimatedTotalResultsCount> , returned by Google. It places each of these nodes in the Results object. Getting the value of a top-level element is as easy as reading Results.Text property.
While these top-level entries are interesting, the information of interest appears in the <resultElements> node. It's at this point that you run into one of the more interesting problems posed by VBA. Even though the sample SOAP files provided with the Google Web Services Kit show that you receive at most 10 <item> elements as children of the <resultElements> node, the VBA debugger shows that this node actually contains upward of 20 children. The 10 <item> elements do appear in the list of children, but you have to filter them out from the null (empty) elements that VBA seems to throw in for good measure. These extra elements are the reason that the code tracks the actual number of <item> elements using RealData and requires the use of the If statement to verify the value of the Item.baseName property. This problem occurs with regularity when working with VBA, so you always have to assume you'll receive extra elements.
An individual element contains multiple children. Again, you get those null elements in with the data you want, so checking for a specific child element type is important. Some of the data, such as the <cachedSize> element, is in the correct format when you receive it from Google, but much of it needs tweaking. The <title> element is one case in point. This element includes both HTML tags and URL encoded characters . To make the title useful in VBA, you need to modify that data. The " Modifying the Google Data" section of the chapter describes the StringToText() function, which shows one way to handle this problem. Figure 5.4 shows typical output from this application. Notice that all the titles are completely readable.
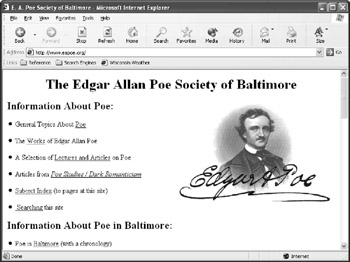
Figure 5.4: The resulting spreadsheet contains links to the sites you queried online.
In some cases, even though the data is perfectly usable when you receive it from Google, you can improve it so VBA users get more out of the information. For example, the <URL> element is completely usable when you receive it from Google. However, by adding the HYPERLINK() function to the URL, it becomes a link within Excel. All the user needs to do is click the resulting hyperlink to see the page directly from inside Excel. Figure 5.5 shows how the page looks when the link is clicked from within Excel. Notice that Excel actually starts a new copy of Internet Explorer to display the link.
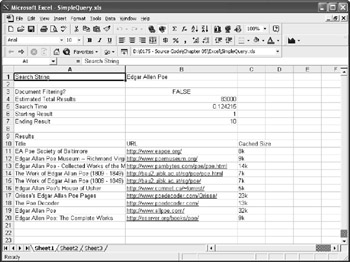
Figure 5.5: Using hyperlinks within Excel makes it easy to move back and forth between spreadsheet and Internet connection.
Clicking the Back button takes the user back to the spreadsheet. When the user wants to view another link, a simple click does the job. This technique actually makes searches easier than using Google. The user can move between the spreadsheet and the Web sites. Any useful sites stay within the spreadsheet ”a simple row deletion removes less useful links. The user ends up with a list of Web sites that meet a specific requirement in an easily saved form.
Modifying the Google Data
Much of the data you receive from Google will contain extra characters such as tags ( especially the bold <b> tag pair) and encoding. The addition of these characters is natural considering Google expects you to use the data on a Web page. Unfortunately, these extra characters are just annoying when viewed with a desktop application, so you need to remove them. Listing 5.2 shows one technique for removing these special characters from the strings you receive from Google. You'll find the complete source for this example in the \Chapter 05\Excel folder of the source code located on the Sybex Web site. The included TestStringToText() Sub (not shown in the listing) shows how the function works with multiple ended elements.
| |
Public Function StringToText(InputStr As String) As String Dim NewStr As String ' Left Side of String. Dim OldStr As String ' Right Side of String. ' Place the string in a local variable. OldStr = InputStr ' Check for bold tag. While Len(OldStr) > 0 ' Remove the bold text. NewStr = NewStr + Left(OldStr, InStr(1, OldStr, "<b>") - 1) OldStr = Right(OldStr, Len(OldStr) - InStr(1, OldStr, "<b>") - 2) NewStr = NewStr + Left(OldStr, InStr(1, OldStr, "</b>") - 1) OldStr = Right(OldStr, Len(OldStr) - InStr(1, OldStr, '</b>") - 3) ' Check for additional bold entries. If InStr(1, OldStr, "<b>") = 0 Then NewStr = NewStr + OldStr OldStr = "" End If Wend ' Check for single quote. If InStr(1, NewStr, "'") Then ' Place the current string value into OldStr OldStr = NewStr NewStr = "" While Len(OldStr) > 0 ' Exchange the encoded form for the single quote. NewStr = NewStr + Left(OldStr, InStr(1, OldStr, "'") - 1) NewStr = NewStr + "'" OldStr = Right(OldStr, Len(OldStr) - InStr(1, OldStr, "'") - 4) ' NewStr = NewStr + OldStr ' Check for additional encoded entries. If InStr(1, OldStr, "'") = 0 Then NewStr = NewStr + OldStr OldStr = "" End If Wend End If ' Return the processed string. StringToText = NewStr End Function
| |
The example code shows two techniques. The first technique removes a tag pair from a string. I've found that removing the tag pairs first actually works better than attempting to remove the URL encoding first. In this case, the code works on the string in a loop. It removes the beginning tag first and then the ending tag. At this point, the code determines whether there are any more tags. If so, it continues the loop.
The second technique looks for a special URL encoded character such as the single quote. It removes the escaped version of the text and then adds the real version back in. When the process is complete, the function exits and returns the converted string to the caller.
Defining Graphs and Charts
You can create a number of easy charts and graphs using Excel and Google Web Services. Look at Figure 5.4 again and you'll see all kinds of numbers . For example, you could create an application that performs an expanded search of various keywords and tracks the number of results. The number is estimated, but performing this kind of analysis will yield valuable information on how Google treats search word combinations. You could also track the time required to perform a search, analyze the cached size of the pages, and even look at the number of hits per domain. This type of research is straightforward because it comes directly from the numbers you obtain from Google Web Services.
However, you can (and possibly should) perform other kinds of analysis based on user input or personal experience. For example, you might build a page similar to the one shown in Figure 5.4 to determine which sites are most popular. One of the problems that you must solve when creating statistical information based on a Google Web Services search is how to determine the data points. Without statistical information, any chart or graph you create won't provide much value. Consequently, you need something on which to base the statistics. Unfortunately, you can't predict the results of a search before it occurs, which means creating the data points in some concrete manner is impossible . The application you design must consider the data points outside the search, which is precisely what the example in this section does. The example tracks the number of times that users select specific sites and then graphs their popularity ”data you can't obtain from Google Web Services, but you must use Google Web Services to create.
| Note | This example relies on special support provided by VBA for generating code dynamically (as the application runs). You need to add a reference to the Microsoft Visual Basic for Applications Extensibility component for this example. See the " Defining the Required References" section for details on adding a reference. |
The Google Web Services calling code for this example is very similar to the code shown in Listing 5.1. However, it differs in one important way. This code calls on a special function to create the URL linkage as shown here.
Case "URL" CreateButtons ItemData.Text, 11 + RealData, 2
The CreateButtons() Sub starts a sequence of events that lets you track user clicks without knowing the search results in advance. Listing 5.3 shows the special code used to create the buttons on screen. You'll find the complete source for this example in the \Chapter 05\Excel folder of the source code located on the Sybex Web site.
| |
Public Sub CreateButtons(ButtonURL As String, ButtonRow As Integer, _ ButtonCol As Integer) Dim NewButton As Shape ' New Command Button for URL Dim SubName As String ' Holds Button Name. Dim ThisModule As CodeModule ' This Code Module ' Create the button. Set NewButton = _ Sheet2.Shapes.AddFormControl( _ xlButtonControl, _ Sheet2.Cells(ButtonRow, ButtonCol).Left, _ Sheet2.Cells(ButtonRow, ButtonCol).Top + 1, _ Sheet2.Cells(ButtonRow, ButtonCol).Width, _ Sheet2.Cells(ButtonRow, ButtonCol).Height - 2) ' The button name will have a space in it, create a name ' without the space. SubName = Left(NewButton.Name, InStr(1, NewButton.Name, " ") - 1) _ + "_" + Right(NewButton.Name, Len(NewButton.Name) - _ InStr(1, NewButton.Name, " ")) + "_Click" ' Create a reference to the current module. Set ThisModule = _ Application.VBE.VBProjects(1).VBComponents("ChartsAndGraphs").CodeModule ' Ensure the module is visible. ThisModule.CodePane.Show ' Dynamically create the click code for the new button. ThisModule.InsertLines 1, _ "Sub " + SubName + "()" + vbCrLf + _ vbTab + "ShowLink " + Chr(34) + ButtonURL + Chr(34) + ", " + _ CStr(ButtonRow) + ", " + CStr(ButtonCol + 2) + vbCrLf + _ "End Sub" ' Configure the button caption and click action. NewButton.DrawingObject.Caption = ButtonURL NewButton.OnAction = "SimpleQuery.xls!" + SubName End Sub | |
The code begins by creating a button and placing it on the form. Notice that the button appears in the same space as the URL text would normally appear. From a user's perspective, this technique makes it appear that the button is actually on the worksheet, even though from Excel's perspective, the button is separate from the worksheet. Figure 5.6 shows how this technique works.
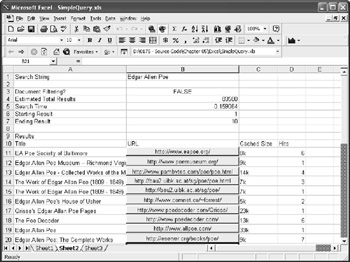
Figure 5.6: Placing the buttons within the worksheet cell positions makes it look like the button is part of the worksheet.
When Excel creates the button, it generates a name for it automatically. The name contains a space, so you need to remove it so you can use the name for other purposes in the code. The code shows one technique for performing this task when you want to associate a click event with the button.
As previously mentioned, you have no idea of how many results Google will return, how many you'll need for your application, or even the information the links will provide. Consequently, you can't create the click events for the buttons in advance (just as you can't create the buttons in advance). This example uses dynamic code generation to create a click event handler for each button. The code is quite simple, but you must create it by obtaining a reference to the current code module. Using the InsertLines() method, you can generate code for the event handler. The listing shows the VBA code you create. Here's a sample of the output of that code.
Sub Button_1_Click() ShowLink "http://www.eapoe.org/", 11, 4 End Sub
The dynamically generated handler is specific to the button, which is based on the Google Web Services return values. This code does call a predefined Sub named ShowLink() . (The ShowLink() function is discussed later in this section.)
Once the code generates an event handler, it can associate it with the new button. The code also sets the button's Caption to match the URL returned by Google Web Services. You now have some buttons set up to use with the Google Web Services data. All of these buttons point to the ShowLink() function shown in Listing 5.4, which actually generates the statistics used for a particular URL.
| |
Sub ShowLink(LinkValue As String, Row As Integer, Column As Integer) ' Update the link count. Sheet2.Cells(Row, Column) = Sheet2.Cells(Row, Column) + 1 ' Follow the link. ThisWorkbook.FollowHyperlink Address:=LinkValue, NewWindow:=False End Sub
| |
Remember that the user is expecting the code to perform two tasks: generate statistics and display the requested page. The ShowLink() function performs both tasks using two lines of code. The first line simply increments a counter based on the location of the button on the worksheet. You can see these statistics in the Hits column shown in Figure 5.6. The second link accepts the URL provided by Google Web Services and uses the ThisWorkbook.FollowHyperlink() function to display it.
It's time to consider the actual graphing process. Like every other aspect of this example, you can't make any assumptions about the data. The worksheet contains a combination of Google-supplied data and the data you generated. Listing 5.5 shows how you can create a dynamically generated graph to display the data.
| |
Public Sub BuildChart() Dim NewChart As Chart ' The actual chart. Dim TheSeries As Series ' Holds the chart data. Dim DRange As Range ' Holds the data range. Dim SRange As Range ' Holds the series label range. ' Determine the data range. Sheet2.Activate Sheet2.Range("D11").Select Application.SendKeys "+^{DOWN}", True Set DRange = ActiveWindow.RangeSelection ' Determine the data range. Sheet2.Range("A11").Select Application.SendKeys "+^{DOWN}", True Set SRange = ActiveWindow.RangeSelection ' Create a new chart. Set NewChart = Charts.Add() ' Change the Name. NewChart.Name = "Popularity" ' Create a series for the chart. NewChart.SeriesCollection.Add _ Source:=Worksheets("Sheet2").Range(DRange.Address) Set TheSeries = NewChart.SeriesCollection(1) ... Series Formatting ... ' Perform some data formatting. With TheSeries .XValues = _ Worksheets("Sheet2").Range(SRange.Address) .HasDataLabels = True .DataLabels.Font.Italic = True .DataLabels.Font.Size = 13 End With ... Graph Formatting ... End Sub | |
The code for the graphing portion of the example is interesting because you have to create the graph from scratch and you can't assume anything about the graph data except a few essentials. The code begins by getting the data and series label ranges. You know the starting point for the ranges, but don't know the ending point because Google might return any number of results. In this case, the Sheet2.Range("D11") .Select chooses the starting point. The Application.SendKeys "+ {DOWN}" , True method call is the same as pressing Ctrl+Alt+Down Arrow, which selects the remainder of the column. Finally, with the range selected, the code places the value in the appropriate Range variable.
At this point, the code can add the graph to the workbook. It creates a SeriesCollection that holds the data range and the series label range. After some additional formatting, the code completes the graph. Figure 5.7 shows typical output from this example.
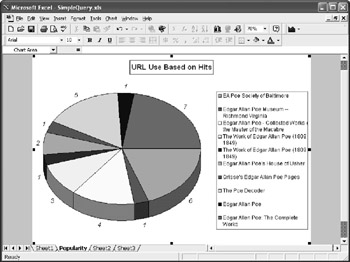
Figure 5.7: The output chart shows how you can mix Google and locally created data.
EAN: 2147483647
Pages: 157