Observer Agreement
|
| < Day Day Up > |
|
Often, the data represented by a contingency table represents information collected in a study on observer agreement. There may be interest in gathering information on observer error, and such a study may be done as part of testing new processes, training, or tools. Sometimes different observers are studied, and sometimes the same observer is studied at different times or under different conditions.
The members of a northeastern music association were revising their system of conducting local and state-wide high school piano competitions. Instead of using local musicians as judges, they wanted to see if they could proceed more fairly by using one of two trained judges in conjunction with local judges, with whom they needed to come to consensus. In order to see how closely the trained judges match, they did an observer agreement study using some college music students after a training session. Twenty students played one of their current pieces, and both judges rated the performance as good, skilled, or superior.
In order to analyze such data, you form the table with the ratings of one rater forming the rows of the table and the ratings of the other rater forming the columns of the table. The cells of the table are the number of students who fell into the profiles composed of the combination of both ratings. Since there are 3 outcomes, there are 9 possible combinations as represented by the cells of a two-way table. Statistics called measures of agreement are then used to assess the degree of agreement.
Open the Piano Data Set
The Piano data set contains the variables Rater1 and Rater2 as well as a frequency variable count. These data are provided as the Piano data set in the Analyst Sample Library. To open the Piano data set, follow these steps:
-
Select Tools → Sample Data...
-
Select Piano.
-
Click OK to create the sample data set in your Sasuser directory.
-
Select File → Open By SAS Name...
-
Select Sasuser from the list of Libraries.
-
Select Piano from the list of members.
-
Click OK to bring the Piano data set into the data table.
Figure 9.23 displays the data table containing these data. Note that the data are in frequency form, with the variable count containing the frequencies of the profile contained in each row of the table. The variable Rater1 contains the first rater's evaluations and the variable Rater2 contains the second rater's evaluations.
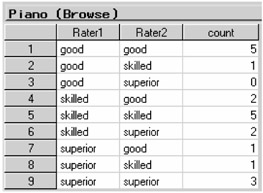
Figure 9.23: Data Set Piano in the Data Table
Specify the Table
To construct the appropriate two-way table, follow these steps:
-
Select Statistics → Table Analysis...
-
Select Rater1 from the candidate list as the Row variable.
-
Select Rater2 from the candidate list as the Column variable.
-
Select count from the candidate list as the Cell Counts variable.
Figure 9.24 displays the resulting dialog.
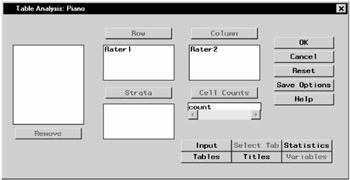
Figure 9.24: Table Analysis Task for Music Study
Request Measures of Agreement
To request measures of agreement, follow these steps:
-
Click on the Statistics button.
-
Select Measures of agreement.
-
Click OK.
Figure 9.25 displays the resulting Statistics dialog. Note that the chi-square tests of association and the measures of association are not appropriate for this type of table.
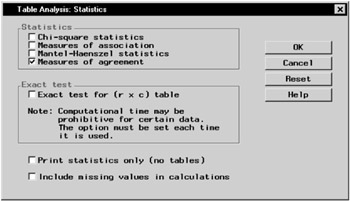
Figure 9.25: Statistics Dialog
Note that the Tables dialog specifications (see Figure 9.5) made previously remain in effect. Therefore, both frequencies and row percentages are produced for this analysis.
Click OK in the Table Analysis dialog to perform the analysis.
Review the Results
The frequency table is displayed in Figure 9.26. Note that most of the frequencies occur on the diagonals, which is what you would expect if there is any degree of agreement. However, there are several off-diagonal elements that represent nonagreement. In particular, there is one case of a student rated 'good' by Rater2 and 'superior' by Rater1. This might be unexpected.
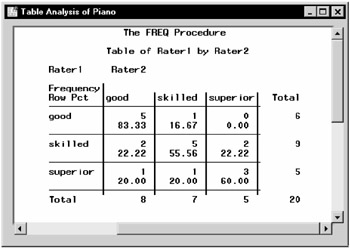
Figure 9.26: Piano Agreement Frequency Table
Figure 9.27 contains the results for the measures of agreement. The simple kappa coefficient has a value of 0.4697, with a 95 percent confidence bounds of (0.1566, 0.7828). This suggests modest agreement of ratings. Note that the Bowker's test of symmetry is also printed; this is a test that the probabilities represented by a square table satisfy symmetry.
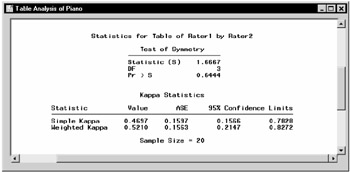
Figure 9.27: Measures of Agreement
When you have a 2 × 2 table, the measure of agreement produced is McNemar's test.
|
| < Day Day Up > |
|
EAN: 2147483647
Pages: 116