Two-Sample Test for Variances
|
| < Day Day Up > |
|
In the Two-Sample Test for Variances task, you can test whether two variables have different variances, or, if you have a single variable that contains values for two groups, you can determine whether the variance differs between the groups.
The data set analyzed in this example, Gpa, contains test scores for 224 students. The data include the students' grade point averages (the variable gpa), high school scores in mathematics, science, and English (the variables hsm, hss, and hse, respectively), and SAT math and verbal scores (the variables satm and satv, respectively).
Suppose that you want to examine the difference in grade point averages between males and females. You can use the two-sample test for variances to test whether the variance of the grade point average differs between males and females.
Open the Gpa Data Set
The data are provided in the Analyst Sample Library. To access this Analyst sample data set, follow these steps:
-
Select Tools → Sample Data...
-
Select GPA.
-
Click OK to create the sample data set in your Sasuser directory.
-
Select File → Open By SAS Name...
-
Select Sasuser from the list of Libraries.
-
Select Gpa from the list of members.
-
Click OK to bring the Gpa data set into the data table.
Request a Two-Sample Test for Variances
To perform the hypothesis test, follow these steps:
-
Select Statistics → Hypothesis Tests → Two-Sample Test for Variances...
-
Ensure that One variable is selected in the box labeled Groups are in.
-
Select the variable gpa as the Dependent variable.
-
Select the variable sex as the Group variable.
If your data are arranged so that the values for both groups are contained in two variables, you can define the two groups by checking the Two variables selection in the box labeled Groups are in.
The null hypothesis for the test is that the two variances are equal (or, equivalently, that their ratio is equal to 1). You can specify the type of alternative hypothesis. The three choices are that Variance 1 is not equal to, is greater than, or is less than Variance 2. In Figure 8.14, the alternative hypothesis states that the two variances are not equal, which is the two-sided alternative hypothesis.
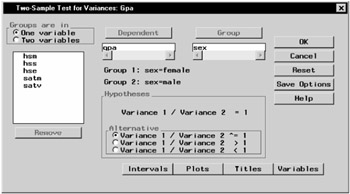
Figure 8.14: Two-Sample Test for Variances Dialog
Request a Box-&-Whisker Plot
To request a box-and-whisker plot in addition to the hypothesis test, follow these steps:
-
Click on the Plots button.
-
Select Box-&-whisker plot.
-
Click OK.
Figure 8.15 displays the Plots dialog with Box-&-whisker plot selected. Note that the plot is constructed to have a mean of zero.
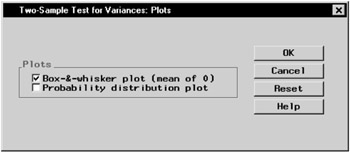
Figure 8.15: Two-Sample Test for Variances— Plots Dialog
Click OK in the Two-Sample Test for Variances dialog to perform the hypothesis test.
Review the Results
Figure 8.16 displays the results of the hypothesis test. The output contains the results of the hypothesis test, including summary statistics, the F statistic, and the associated p-value.
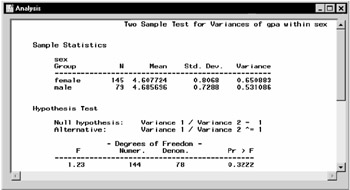
Figure 8.16: Two-Sample Test for Variances— Output
The "Sample Statistics" table displays the variance of the variable gpa for both females (0.6509) and males (0.5311). The "Hypothesis Test" table displays the test statistics: the F value is 1.23 and the resulting p-value is 0.3222. Thus, the data give no evidence for rejecting the hypothesis of equal variances.
Figure 8.17 displays the box-and-whisker plot. Observations that fall beyond the whiskers are identified with a square symbol.
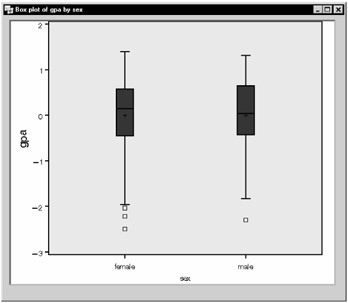
Figure 8.17: Two-Sample Test for Variances— Box-and-whisker Plot
The box-and-whisker plot displays the amount of spread and the range for the two variables. The two groups do not appear to be appreciably different.
|
| < Day Day Up > |
|
EAN: 2147483647
Pages: 116