Setting Viewer Preferences
|
| < Day Day Up > |
|
Select Tools → Viewer Settings...to display the Viewer Settings dialog. The Viewer Settings dialog enables you to specify options for the window layout, the data table, and the display of variables and output. When you click OK, your changes take effect immediately.
Window Layout
In the Viewer tab, you can control the relative size of the project tree and data table by moving the slider at the bottom of the Window layout screen.
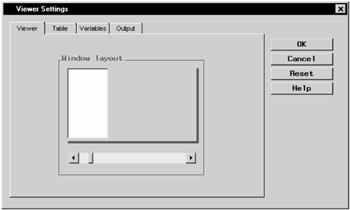
Figure 4.1: Viewer Settings Dialog, Viewer Tab
Table Settings
In the Table tab, you can specify the fonts and initial edit mode of your data tables.
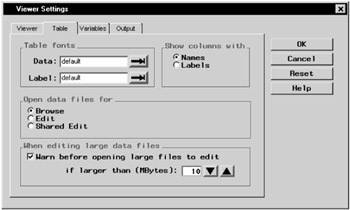
Figure 4.2: Viewer Settings Dialog, Table Tab
Under Table fonts, click on the arrows next to the Data: and Label: fields to select a font for the data and column headings in the data table.
Under Show columns with, select column Names or Labels to be displayed as column headings.
Under Open data files for, specify the mode in which data tables are to be opened. Browse mode prevents any editing of the table. Edit mode allows table editing, and Shared Edit allows multiple users to edit table values concurrently for tables that are accessed through a SAS/SHARE server. These modes can also be changed from the Edit menu when the data table is open.
Under When editing large data files, you can control processing speed by setting a warning for files that are greater than a certain size.
If you have checked Warn before opening large files to edit, and the file is larger than the limit you have specified, a message warns you that the data file is large and prompts you to either open a copy or open the data file directly. Opening a copy of the data file takes longer. Opening the data file directly is faster, but changes to the data table cannot be undone.
Click on the up or down arrows to specify the file size limit.
Settings for Variables
In the Variables tab, you can customize the display of the variables in the task dialogs.
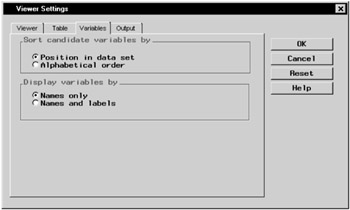
Figure 4.3: Viewer Settings Dialog, Variables Tab
Under Sort candidate variables by, select Position in data set or Alphabetical order to specify the order in which to list variable names in the task dialogs.
Under Display variables by, select Names only or Names and labels to specify how variables should be displayed in the task dialogs.
Output Settings
In the Output tab, you can specify options for multiple output, graphs, source code, and HTML files.
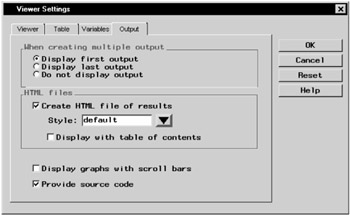
Figure 4.4: Viewer Settings Dialog, Output Tab
Under When creating multiple output, you can determine whether the first or last output should be displayed automatically when an analysis has been run, or whether output should be displayed at all.
Under HTML files, select Create HTML file of results to include an HTML output node in your project tree whenever you apply a task to your data. You can change the style of the HTML output by selecting a style from the Style: drop-down menu. Select Display with table of contents to view the HTML output using a table of links to your output (displayed with HTML frames). If this option is not selected, all results are displayed in a single page.
Select Display graphs with scroll bars to display scroll bars with your graphs. When scrollbars are displayed, graphs are shown in their natural size. When scrollbars are turned off, graphs are shown in full size in the Output window. Scrollbars can also be turned on or off in the Output window.
Select Provide source code to include a source code node in your project tree whenever you apply a task to your data.
|
| < Day Day Up > |
|
EAN: 2147483647
Pages: 116