Example: Create and Export Histograms
|
| < Day Day Up > |
|
In this example, you open the project that contains the simple regression that you performed in the example at the end of Chapter 1, "Overview," and save the project under another name. Then you add to the new project by generating histograms from the Fitness data.
Open the Project
To open the project that you created in Chapter 1, follow these steps:
-
Select File → Projects → Open...
-
Select My Project. Click OK.
Save the Project Under Another Name
To give the project a more appropriate name, follow these steps:
-
Select My Project at the top of the project tree, and select Save as... from the pop-up menu.
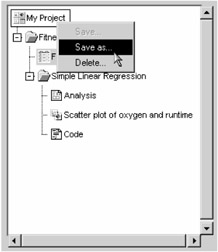
Figure 3.9: Saving a Project Under Another Name -
Type Fitness in the Name: field and click OK.
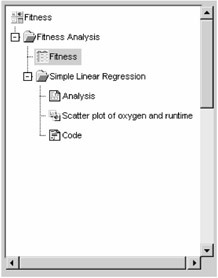
Figure 3.10: Fitness Project
A copy of the project tree is saved with the name Fitness. The original project is saved until you delete it.
Generate Histograms
Histograms display the distribution of a particular variable over various intervals, or classes. You can use histograms to see the shape of the distribution and to determine whether the data are distributed symmetrically. A comparative histogram is produced if you specify a classification variable.
To generate comparative histograms of maximum heart rate for each experimental group from the Fitness data table, follow these steps:
-
Select Graphs → Histogram...
-
Select maxpulse from the list, and click on the Analysis button. Select group from the list, and click on the Class button.
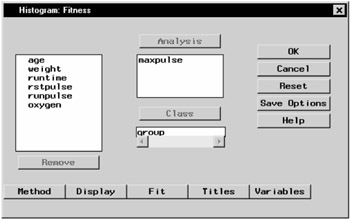
Figure 3.11: Fitness Analysis and Class Variables -
To change the way the histogram is displayed, click on the Display button.
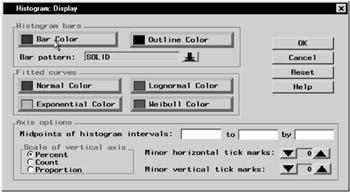
Figure 3.12: Histogram- Display Dialog -
Click Bar Color to change the color of the histogram bars. Select Red from the list of colors.
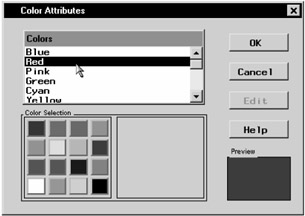
Figure 3.13: Color Attributes DialogClick OK to change the bar color to red.
-
To use number of subjects, rather than percentage, as a gauge of bar size, select Count under Scale of vertical axis. Click OK to return to the Histogram dialog.
-
Click OK to create histograms of the maximum heart rate for each group.
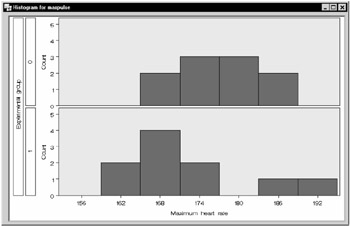
Figure 3.14: Maximum Heart Rate HistogramsThe histograms and the code that produced them have been added to the project tree.
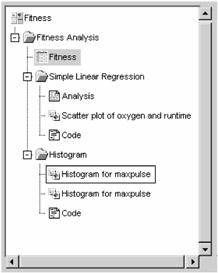
Figure 3.15: Project Tree with Histogram Folder
Export Histograms
To save the histogram that you have generated as a graphics file, follow these steps:
-
Double-click on the first node that is labeled Histogram for maxpulse to open it.
-
Select File → Save As...
-
In the Save As dialog, click on the arrow next to Save as type: and select GIF file.
-
Type coronary.gif in the File name: field.
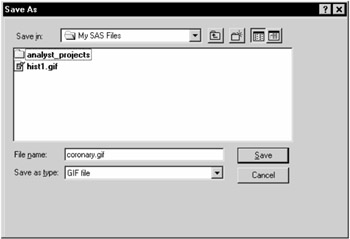
Figure 3.16: Save GIF File -
Click on the Save button to save the file. The histogram is exported to a GIF formatted file.
|
| < Day Day Up > |
|
EAN: 2147483647
Pages: 116