Procedure Output and the Graphics Output Area
The result of most SAS/GRAPH procedures is the graphic display of data in the form of graphics output. Graphics output is made up of commands that tell a graphics device how to draw graphic elements. A graphics element is a visual element of graphics output “ for example, a plot line, a bar, a footnote, the outline of a map area, or a border.
To generate graphics output, your program uses a device driver that directs the graphics output to a display device (a graphics monitor or terminal), a hardcopy device, or a file. Despite the fact that all graphics devices do not understand the same commands, SAS/GRAPH software can produce graphics output on many types of graphics devices. It does so by producing output in two steps:
-
It creates a catalog entry made up of graphics commands in a generic, device-independent format.
-
It uses a device driver to translate the commands from the generic format to commands that a particular graphics device understands. This is called device-dependent output.
Your program controls this process as well as the graphics environment in which the graphics appear. This section describes this graphics environment and how you can modify it, how SAS/GRAPH uses it, and how you can make your programs work for different output devices.
About the Graphics Output Area
When SAS/GRAPH software produces graphics output, it draws the graphic elements inside of an area called the graphics output area . Characteristics of the graphics output area are determined by the values of certain device parameters within the device entry. You can modify some of these characteristics for a single graph or an entire SAS session by using graphics options to change the values of the device parameters. This section describes changes you can make to the external dimensions, the resolution, the cell size , and the type of units. For a description of the graphics options and device parameters referred to in this section, see Chapter 8, Graphics Options and Device Parameters Dictionary, on page 261.
External Dimensions
The graphics output area is contained within the device s display area. The external dimensions of the device s display area are controlled by the values of the XMAX and YMAX device parameters. XMAX sets the maximum horizontal dimension; YMAX sets the maximum vertical dimension. The orientation of the graphics output area, that is, whether it is landscape or portrait, is determined by whether the larger value is XMAX (orientation is landscape) or YMAX (orientation is portrait).
The external dimensions of the graphics output area are controlled by the values of the HSIZE and VSIZE device parameters.
Typically, the default dimensions of the graphics output area are the same as the dimensions of the device. This is usually true for display devices. For those devices, the default value of HSIZE and VSIZE is 0. However, for hardcopy devices, the XMAX, YMAX values represent the external boundaries of the output medium (such as a sheet of paper). If these devices need a margin, HSIZE, VSIZE and HORIGIN, VORIGIN are assigned default values and the default graphics output area is somewhat smaller than the device s display area. Figure 2.1 on page 35 illustrates such a device.
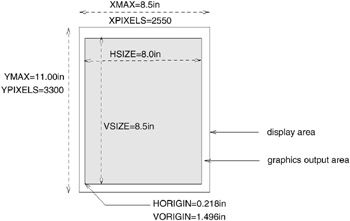
Figure 2.1: Default Dimensions of the PSCOLOR Device
Note that HORIGIN and VORIGIN define the left margin and bottom margin, respectively. The right margin and top margin are calculated by the device driver as follows :
-
right-margin = XMAX ˆ’ (HSIZE + HORIGIN)
-
top-margin = YMAX ˆ’ (VSIZE + VORIGIN)
You cannot specify values for right-margin and top-margin .
You can change the dimensions of the graphics output area for a SAS session or for a single graph with the HSIZE= and VSIZE= graphics options. Changing the size of the graphics output area does not change the dimensions of the device s display area or affect the resolution. The values of HSIZE= and VSIZE= cannot exceed the maximum dimensions for the device as specified by XMAX and YMAX. Furthermore, you cannot specify values for graphics options HSIZE= and VSIZE= that exceed the HSIZE and VSIZE values in the device entry.
Device Resolution
The resolution of a device is the number of pixels per inch. It is determined by the values of the device parameters XMAX, YMAX, and XPIXELS, YPIXELS, and is calculated by dividing the number of pixels by the corresponding external dimension. For example,
-
x-resolution = XPIXELS / XMAX
Therefore, the X resolution of the PSCOLOR device illustrated in Figure 2.1 on page 35 is 300dpi (dots per inch).
Ordinarily, you do not want to change the device resolution because changing it may distort your image. However, you may want to change the size of the display area. To do so without changing the resolution, use the GOPTIONS statement to change the values of only XPIXELS= and YPIXELS=, or the values of only XMAX= and YMAX=. Then SAS/GRAPH will automatically calculate the correct value for the unspecified parameters so that the device retains the default resolution.
If you do want to change the device resolution (usually for image files or graphs that are displayed online), specify values for both XMAX= and XPIXELS= (horizontal resolution) or both YMAX= and YPIXELS= (vertical resolution), or all four. In these cases, SAS/GRAPH changes the dimensions and recalculates the device resolution. Table 2.1 on page 36 summarizes the interaction of these options.
| If you specify values for | and | then SAS/GRAPH |
|---|---|---|
| XPIXELS= and YPIXELS= | not XMAX= and YMAX= | changes the dimensions and recalculates the value of XMAX= and YMAX= in order to retain the resolution |
| XMAX= and YMAX= | not XPIXELS= and YPIXELS= | changes the dimensions and recalculates the value of XPIXELS= and YPIXELS= in order to retain the resolution |
| XMAX= | XPIXELS= | changes the horizontal dimension and recalculates the resolution |
| YMAX= | YPIXELS= | changes the vertical dimension and recalculates the resolution |
Cells
Within the graphics output area, SAS/GRAPH software defines an invisible grid of rows and columns . This grid is made up of character cells as shown in Figure 2.2 on page 37.
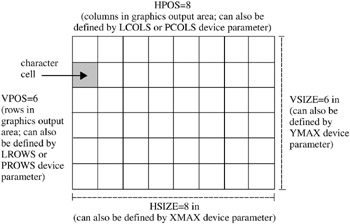
Figure 2.2: Rows, Columns, and Cells in the Graphics Output Area
The size and proportion of these cells affects the size and appearance of graphic elements that are drawn using units of CELLS. The attributes of the cells are determined by both the external dimensions of the graphics output area (controlled by HSIZE and VSIZE) and the number of rows and columns. The number of rows is controlled by the LROWS (if orientation is landscape) or PROWS (if orientation is portrait) device parameter. Similarly, the number of columns is controlled by the LCOLS (landscape) or PCOLS (portrait) device parameter.
You can change the number of rows and columns in the grid with the HPOS= and VPOS= graphics options. HPOS= overrides the value of LCOLS or PCOLS and sets the number of columns in the graphics output area. VPOS= overrides the value of LROWS or PROWS and sets the number of rows in the graphics output area.
Figure 2.2 on page 37 illustrates the relationship between the graphics options or device parameters that determine the dimensions of the graphics output area and those that determine the number of character cells within the graphics output area.
Changing only the external dimensions of the graphics output area (HSIZE= and VSIZE=) retains the cell size but causes SAS/GRAPH to automatically recalculate the number of rows and columns, as illustrated in Figure 2.3 on page 37.
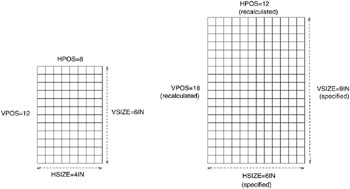
Figure 2.3: Changing HSIZE=, VSIZE= Changes Dimensions and Recalculates Number of Rows and Columns
Changing only the number of rows and columns (HPOS and VPOS) changes the size of the cells without altering the overall size of the output. Figure 2.4 on page 37 shows how increasing the number of rows and columns reduces the size of the individual cells.
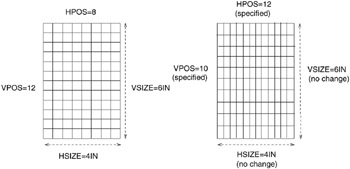
Figure 2.4: Changing HPOS= and VPOS= Changes Cell Size
Usually, you should not change the number of rows and columns from the default for your device. However, if you must change them to make a graph fit, note that the size of text in the graphics output will change if you specified text size using units of CELLS. If the cells are large (that is, HPOS= and VPOS= have small values), the text may not fit. If the cells are too small, the text may be too small to read. In this case, you can adjust the size of the text with the HEIGHT= statement option or the HTEXT= graphics option.
To change all the attributes of the graphics output area, specify values for all four options, as shown in Figure 2.5 on page 38.
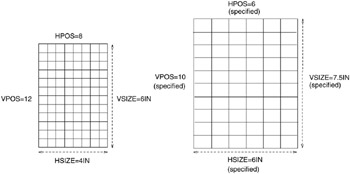
Figure 2.5: Changing HSIZE=, VSIZE= and HPOS=, VPOS= Changes Dimensions and Number and Size of Cells
Table 2.2 on page 38 summarizes the interaction of the HSIZE=, VSIZE=, HPOS=, and VPOS= graphics options.
| If you specify values for | and | then SAS/GRAPH |
|---|---|---|
| HSIZE= and VSIZE= | not HPOS= and VPOS= (or specify HPOS=0 and VPOS=0) | changes the external dimensions of the graphics output area and recalculates the number of rows and columns in order to retain cell size and proportions . |
| HPOS= and VPOS= | not HSIZE= and VSIZE= | keeps the external dimensions but changes the cell size according to the number of rows and columns. |
| HSIZE= and VSIZE= | HPOS= and VPOS= | changes the dimensions of the graphics output area, the number of rows and columns, and recalculates the cell size. |
Units
By default, most graphic elements are drawn using units of CELLS to determine their size. For example, the default character height for the TITLE1 definition is two cells; for all other text the default height is one cell.
Changing the cell size to control the size of one element, such as text, may distort other parts of your graph. Instead, you may want to change the type of units that SAS/GRAPH uses to control the size of the graphic elements. In addition to CELLS and other absolute units such as inches (IN), centimeters (CM), and points (PT), you can often use units of percent of the graphics output area (PCT). This unit specification allows the height of the graphic elements to change in proportion to the size of the graphics output area.
You can specify the type of unit for individual graphic elements or you can use the GUNIT= graphics option to set the default units that will be used for most height specifications.
Placement of Graphic Elements in the Graphics Output Area
By default, SAS/GRAPH software positions certain graphics elements in predefined locations in the graphics output area. Figure 2.6 on page 39 shows the graphics output area and the areas within it that are used by the following graphic elements:
-
Titles are placed in the title area at the top of the graphics output area.
-
Footnotes are placed in the footnote area at the bottom of the graphics output area.
-
The graph itself uses the procedure output area , which is the area left after the titles and footnotes have been drawn.
-
Legends also use the procedure output area and may affect the amount of space available for the graph. By default, space is reserved for the legend below the axis area of a graph and above the footnote area. However, you can position the legend in the part of the procedure output area that is reserved for the graph. For details, see LEGEND Statement on page 151.
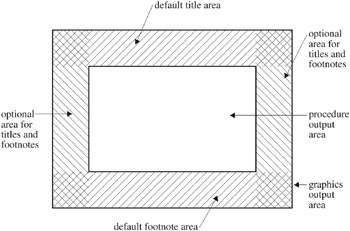
Figure 2.6: Default Locations for Graphic Elements in the Graphics Output Area
Note: Titles and footnotes can be positioned elsewhere on the graph as well, with different effects on space allocation. See TITLE, FOOTNOTE, and NOTE Statements on page 210 for details.
Note: If the titles, footnotes, and legend are very large, they may make the procedure output area too small for the graph. You can control the size of title and footnote text and of most legend elements with statement options. For details, see Chapter 7, SAS/GRAPH Statements, on page 121 for a description of the appropriate statement. In addition, GOPTIONS Statement on page 146 lists the graphics options that control the size of various graphic elements. See also Making Programs Portable on page 40.
How Errors in Sizing Are Handled
Sometimes SAS/GRAPH cannot fit one or more graphic elements on the graph. This can happen if an element is too big for the available space (for example, the title is too long), or if you have too many elements to fit in a given space (for example, a bar chart has too many bars). In these cases, SAS/GRAPH either
-
resizes the graphics element and issues a warning explaining what it did
-
issues an error message and does not attempt to produce the graph.
For example, it adjusts the size of titles to make them fit but it does not drop bars in order to produce a readable bar chart. If you get unexpected results or no graph, check the SAS log for notes, warnings, and errors.
Making Programs Portable
When you want to write a program that will produce the same graphics output on two different devices, you can use features in SAS/GRAPH software to simplify the process:
-
Use percent of the graphics output area (PCT) as the unit of measure when specifying sizes of text and other graphics to make sure that text is proportional in size across devices. A one-inch-high title may be appropriate on a standard piece of paper, but it is almost all of the display area of a slide. To make units of percentage the default for size specifications, use the GUNIT= graphics option:
goptions gunit=pct;
You can also specify PCT anywhere you specify a size:
axis1 label=(height=3 pct 'Year');
See GUNIT on page 309 for a complete description of the GUNIT= graphics option.
-
Compare colors and patterns for the devices you will use and use the colors of the device that has the fewest colors, With a slide camera, for example, you can choose from over 16 million colors, but some graphics monitors display only four or eight colors at a time.
If you want to generate a graph on both a color device and a black-and-white device, such as a laser printer or a monochrome graphics monitor, all colors are remapped to black, white, or scales of gray, depending on the device. However, with the PATTERN statement, you can substitute line-patterns for colors.
-
Preview the appearance of the output on a different device with the TARGETDEVICE= graphics option. For example, to see how the output will look on a color PostScript printer, specify
goptions targetdevice=pscolor;