Understanding Charts in PowerPoint


Understanding Charts in PowerPoint

You can use Microsoft Graph to create charts in your presentation, or you can insert charts created in another application, such as Excel. Using Microsoft Graph inside PowerPoint is the easiest way to create a graph, but doesn't offer any calculation or formula capabilities for your chart data. If you've already created a chart in Excel or you need to analyze complex data, it's best to insert an Excel chart.

NOTE

For the sake of consistency, we use the term chart throughout this chapter to match PowerPoint's interface ”even though the application you use to create charts is called Microsoft Graph. Essentially, chart and graph are synonyms for any kind of graphical representation of numeric information.


Before you start creating a chart using Microsoft Graph from within PowerPoint, you should become familiar with chart terminology. Table 11.1 lists these terms and their definitions.

Table 11.1. Chart Object Terminology

Term

Definition

Axis

A line that frames one side of the plot area. The two most common axes are the value axis and the category axis.

Datasheet

A grid that resembles a spreadsheet, in which you can enter data for your chart.

Data label

Text that describes a specific data marker or series of data markers. This can be a numeric value, text, a percent, or a combination of these items.

Data marker

A value that represents a single cell or data point in a datasheet.

Data series

The main categories of information in a chart ”usually reflected in a chart's legend and in the first cell of each datasheet row or column.

Data table

A grid in the chart that lists the exact data in the datasheet.

Gridlines

Lines that display across the category or value axes to make a chart easier to read. By default, major gridlines are in increments of 10 and minor gridlines in increments of 2.

Legend

A box that lists and color -codes all data series.

Trendline

A line that forecasts future values based on current data.

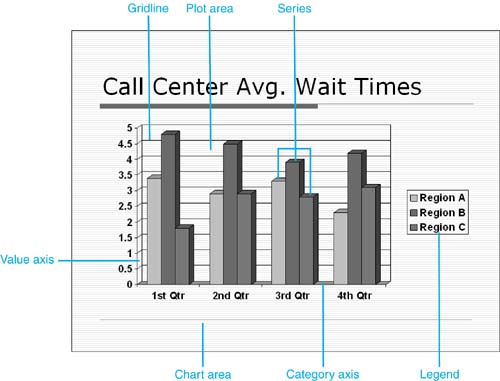
Figure 11.1 shows some of these chart objects.

Figure 11.1. Learn the basic objects of a chart before you create one.

graphics/11fig01.jpg


Special Edition Using Microsoft Office PowerPoint 2003
ISBN: 0789729571
EAN: 2147483647
Year: 2003
Pages: 261

flylib.com © 2008-2017.
If you may any questions please contact us: flylib@qtcs.net