Trap Dispatching
| < Day Day Up > |
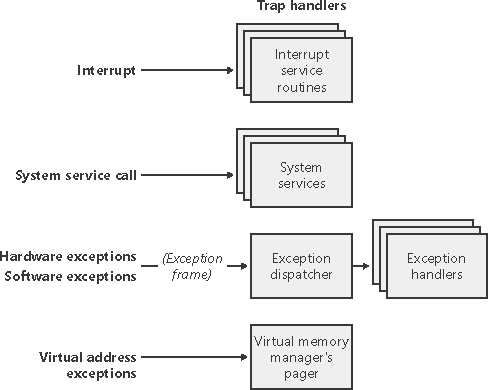
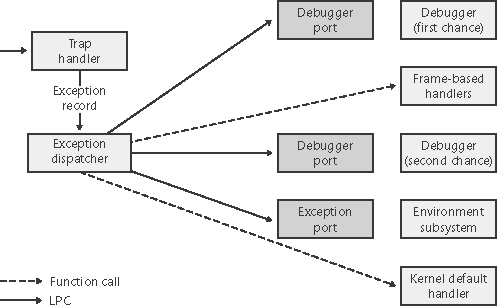
| Interrupts and exceptions are operating system conditions that divert the processor to code outside the normal flow of control. Either hardware or software can detect them. The term trap refers to a processor's mechanism for capturing an executing thread when an exception or an interrupt occurs and transferring control to a fixed location in the operating system. In Windows, the processor transfers control to a trap handler, a function specific to a particular interrupt or exception. Figure 3-1 illustrates some of the conditions that activate trap handlers. Figure 3-1. Trap dispatching
The kernel distinguishes between interrupts and exceptions in the following way. An interrupt is an asynchronous event (one that can occur at any time) that is unrelated to what the processor is executing. Interrupts are generated primarily by I/O devices, processor clocks, or timers, and they can be enabled (turned on) or disabled (turned off). An exception, in contrast, is a synchronous condition that results from the execution of a particular instruction. Running a program a second time with the same data under the same conditions can reproduce exceptions. Examples of exceptions include memory access violations, certain debugger instructions, and divide-by-zero errors. The kernel also regards system service calls as exceptions (although technically they're system traps). Either hardware or software can generate exceptions and interrupts. For example, a bus error exception is caused by a hardware problem, whereas a divide-by-zero exception is the result of a software bug. Likewise, an I/O device can generate an interrupt, or the kernel itself can issue a software interrupt (such as an APC or DPC, described later in this chapter). When a hardware exception or interrupt is generated, the processor records enough machine state on the kernel stack of the thread that's interrupted so that it can return to that point in the control flow and continue execution as if nothing had happened. If the thread was executing in user mode, Windows switches to the thread's kernel-mode stack. Windows then creates a trap frame on the kernel stack of the interrupted thread into which it stores the execution state of the thread. The trap frame is a subset of a thread's complete context, and you can view its definition by typing dt nt!_ktrap_frame in the kernel debugger. (Thread context is described in Chapter 6.) The kernel handles software interrupts either as part of hardware interrupt handling or synchronously when a thread invokes kernel functions related to the software interrupt. In most cases, the kernel installs front-end trap handling functions that perform general trap handling tasks before and after transferring control to other functions that field the trap. For example, if the condition was a device interrupt, a kernel hardware interrupt trap handler transfers control to the interrupt service routine (ISR) that the device driver provided for the interrupting device. If the condition was caused by a call to a system service, the general system service trap handler transfers control to the specified system service function in the executive. The kernel also installs trap handlers for traps that it doesn't expect to see or doesn't handle. These trap handlers typically execute the system function KeBugCheckEx, which halts the computer when the kernel detects problematic or incorrect behavior that, if left unchecked, could result in data corruption. (For more information on bug checks, see Chapter 14.) The following sections describe interrupt, exception, and system service dispatching in greater detail. Interrupt DispatchingHardware-generated interrupts typically originate from I/O devices that must notify the processor when they need service. Interrupt-driven devices allow the operating system to get the maximum use out of the processor by overlapping central processing with I/O operations. A thread starts an I/O transfer to or from a device and then can execute other useful work while the device completes the transfer. When the device is finished, it interrupts the processor for service. Pointing devices, printers, keyboards, disk drives, and network cards are generally interrupt driven. System software can also generate interrupts. For example, the kernel can issue a software interrupt to initiate thread dispatching and to asynchronously break into the execution of a thread. The kernel can also disable interrupts so that the processor isn't interrupted, but it does so only infrequently at critical moments while it's processing an interrupt or dispatching an exception, for example. The kernel installs interrupt trap handlers to respond to device interrupts. Interrupt trap handlers transfer control either to an external routine (the ISR) that handles the interrupt or to an internal kernel routine that responds to the interrupt. Device drivers supply ISRs to service device interrupts, and the kernel provides interrupt handling routines for other types of interrupts. In the following subsections, you'll find out how the hardware notifies the processor of device interrupts, the types of interrupts the kernel supports, the way device drivers interact with the kernel (as a part of interrupt processing), and the software interrupts the kernel recognizes (plus the kernel objects that are used to implement them). Hardware Interrupt ProcessingOn the hardware platforms supported by Windows, external I/O interrupts come into one of the lines on an interrupt controller. The controller in turn interrupts the processor on a single line. Once the processor is interrupted, it queries the controller to get the interrupt request (IRQ). The interrupt controller translates the IRQ to an interrupt number, uses this number as an index into a structure called the interrupt dispatch table (IDT), and transfers control to the appropriate interrupt dispatch routine. At system boot time, Windows fills in the IDT with pointers to the kernel routines that handle each interrupt and exception.
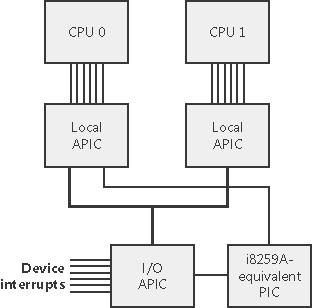
Windows maps hardware IRQs to interrupt numbers in the IDT, and the system also uses the IDT to configure trap handlers for exceptions. For example, the x86 and x64 exception number for a page fault (an exception that occurs when a thread attempts to access a page of virtual memory that isn't defined or present) is 0xe. Thus, entry 0xe in the IDT points to the system's page fault handler. Although the architectures supported by Windows allow up to 256 IDT entries, the number of IRQs a particular machine can support is determined by the design of the interrupt controller the machine uses. Each processor has a separate IDT so that different processors can run different ISRs, if appropriate. For example, in a multiprocessor system, each processor receives the clock interrupt, but only one processor updates the system clock in response to this interrupt. All the processors, however, use the interrupt to measure thread quantum and to initiate rescheduling when a thread's quantum ends. Similarly, some system configurations might require that a particular processor handle certain device interrupts. x86 Interrupt ControllersMost x86 systems rely on either the i8259A Programmable Interrupt Controller (PIC) or a variant of the i82489 Advanced Programmable Interrupt Controller (APIC); the majority of new computers include an APIC. The PIC standard originates with the original IBM PC. PICs work only with uniprocessor systems and have 15 interrupt lines. APICs and SAPICs (discussed shortly) work with multiprocessor systems and have 256 interrupt lines. Intel and other companies have defined the Multiprocessor Specification (MP Specification), a design standard for x86 multiprocessor systems that centers on the use of APIC. To provide compatibility with uniprocessor operating systems and boot code that starts a multiprocessor system in uniprocessor mode, APICs support a PIC compatibility mode with 15 interrupts and delivery of interrupts to only the primary processor. Figure 3-2 depicts the APIC architecture. The APIC actually consists of several components: an I/O APIC that receives interrupts from devices, local APICs that receive interrupts from the I/O APIC on a private APIC bus and that interrupt the CPU they are associated with, and an i8259A-compatible interrupt controller that translates APIC input into PIC-equivalent signals. The I/O APIC is responsible for implementing interrupt routing algorithms which are software-selectable (the hardware abstraction layer, or HAL, makes the selection on Windows) that both balance the device interrupt load across processors and attempt to take advantage of locality, delivering device interrupts to the same processor that has just fielded a previous interrupt of the same type. Figure 3-2. x86 APIC architecture
x64 Interrupt ControllersBecause the x64 architecture is compatible with x86 operating systems, x64 systems must provide the same interrupt controllers as does the x86. A significant difference, however, is that the x64 versions of Windows will not run on systems that do not have an APIC and they use the APIC for interrupt control. IA64 Interrupt ControllersThe IA64 architecture relies on the Streamlined Advanced Programmable Interrupt Controller (SAPIC), which is an evolution of the APIC. A major difference between the APIC and SAPIC architectures is that the I/O APICs on an APIC system deliver interrupts to local APICs over a private APIC bus, whereas on a SAPIC system interrupts traverse the I/O and system bus for faster delivery. Another difference is that interrupt routing and load balancing is handled by the APIC bus on an APIC system, but a SAPIC system, which doesn't have a private APIC bus, requires that the support be programmed into the firmware. Even if load balancing and routing are present in the firmware, Windows does not take advantage of it; instead, it statically assigns interrupts to processors in a round-robin manner.
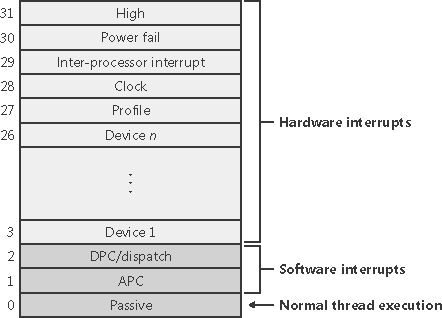
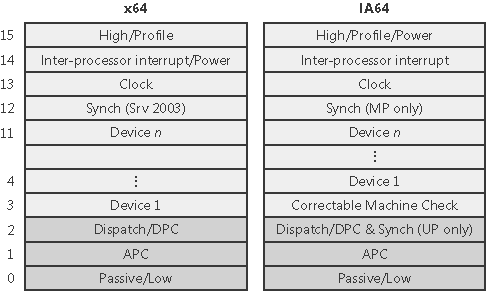
Software Interrupt Request Levels (IRQLs)Although interrupt controllers perform a level of interrupt prioritization, Windows imposes its own interrupt priority scheme known as interrupt request levels (IRQLs). The kernel represents IRQLs internally as a number from 0 through 31 on x86 and from 0 to 15 on x64 and IA64, with higher numbers representing higher-priority interrupts. Although the kernel defines the standard set of IRQLs for software interrupts, the HAL maps hardware-interrupt numbers to the IRQLs. Figure 3-3 shows IRQLs defined for the x86 architecture, and Figure 3-4 shows IRQLs for the x64 and IA64 architectures. Figure 3-3. x86 interrupt request levels (IRQLs)
Figure 3-4. x64 and IA64 interrupt request levels (IRQLs)
Note
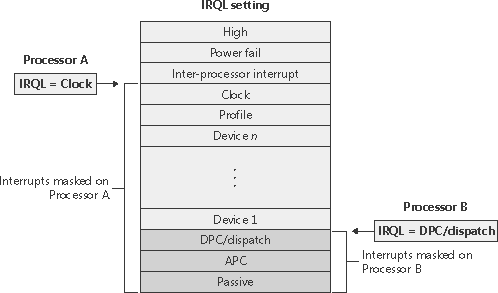
Interrupts are serviced in priority order, and a higher-priority interrupt preempts the servicing of a lower-priority interrupt. When a high-priority interrupt occurs, the processor saves the interrupted thread's state and invokes the trap dispatchers associated with the interrupt. The trap dispatcher raises the IRQL and calls the interrupt's service routine. After the service routine executes, the interrupt dispatcher lowers the processor's IRQL to where it was before the interrupt occurred and then loads the saved machine state. The interrupted thread resumes executing where it left off. When the kernel lowers the IRQL, lower-priority interrupts that were masked might materialize. If this happens, the kernel repeats the process to handle the new interrupts. IRQL priority levels have a completely different meaning than thread-scheduling priorities (which are described in Chapter 6). A scheduling priority is an attribute of a thread, whereas an IRQL is an attribute of an interrupt source, such as a keyboard or a mouse. In addition, each processor has an IRQL setting that changes as operating system code executes. Each processor's IRQL setting determines which interrupts that processor can receive. IRQLs are also used to synchronize access to kernel-mode data structures. (You'll find out more about synchronization later in this chapter.) As a kernel-mode thread runs, it raises or lowers the processor's IRQL either directly by calling KeRaiseIrql and KeLowerIrql or, more commonly, indirectly via calls to functions that acquire kernel synchronization objects. As Figure 3-5 illustrates, interrupts from a source with an IRQL above the current level interrupt the processor, whereas interrupts from sources with IRQLs equal to or below the current level are masked until an executing thread lowers the IRQL. Figure 3-5. Masking interrupts
Because accessing a PIC is a relatively slow operation, HALs that use a PIC implement a performance optimization, called lazy IRQL, that avoids PIC accesses. When the IRQL is raised, the HAL notes the new IRQL internally instead of changing the interrupt mask. If a lower-priority interrupt subsequently occurs, the HAL sets the interrupt mask to the settings appropriate for the first interrupt and postpones the lower-priority interrupt until the IRQL is lowered. Thus, if no lower-priority interrupts occur while the IRQL is raised, the HAL doesn't need to modify the PIC. A kernel-mode thread raises and lowers the IRQL of the processor on which it's running, depending on what it's trying to do. For example, when an interrupt occurs, the trap handler (or perhaps the processor) raises the processor's IRQL to the assigned IRQL of the interrupt source. This elevation masks all interrupts at and below that IRQL (on that processor only), which ensures that the processor servicing the interrupt isn't waylaid by an interrupt at the same or a lower level. The masked interrupts are either handled by another processor or held back until the IRQL drops. Therefore, all components of the system, including the kernel and device drivers, attempt to keep the IRQL at passive level (sometimes called low level). They do this because device drivers can respond to hardware interrupts in a timelier manner if the IRQL isn't kept unnecessarily elevated for long periods. Note
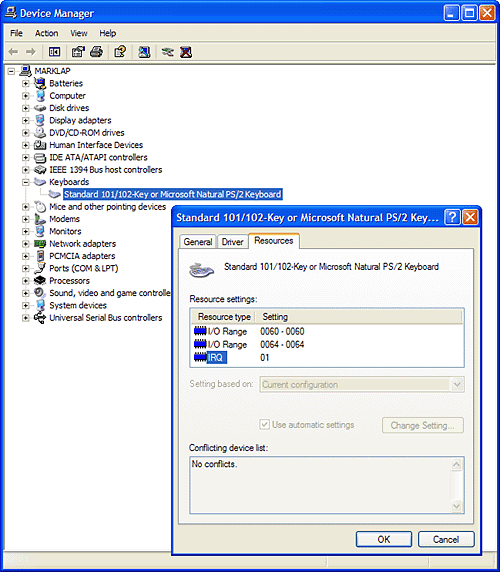
Because changing a processor's IRQL has such a significant effect on system operation, the change can be made only in kernel mode user-mode threads can't change the processor's IRQL. This means that a processor's IRQL is always at passive level when it's executing usermode code. Only when the processor is executing kernel-mode code can the IRQL be higher. Each interrupt level has a specific purpose. For example, the kernel issues an interprocessor interrupt (IPI) to request that another processor perform an action, such as dispatching a particular thread for execution or updating its translation look-aside buffer cache. The system clock generates an interrupt at regular intervals, and the kernel responds by updating the clock and measuring thread execution time. If a hardware platform supports two clocks, the kernel adds another clock interrupt level to measure performance. The HAL provides a number of interrupt levels for use by interrupt-driven devices; the exact number varies with the processor and system configuration. The kernel uses software interrupts (described later in this chapter) to initiate thread scheduling and to asynchronously break into a thread's execution. Mapping Interrupts to IRQLs IRQL levels aren't the same as the interrupt requests (IRQs) defined by interrupt controllers the architectures on which Windows runs don't implement the concept of IRQLs in hardware. So how does Windows determine what IRQL to assign to an interrupt? The answer lies in the HAL. In Windows, a type of device driver called a bus driver determines the presence of devices on its bus (PCI, USB, and so on) and what interrupts can be assigned to a device. The bus driver reports this information to the Plug and Play manager, which decides, after taking into account the acceptable interrupt assignments for all other devices, which interrupt will be assigned to each device. Then it calls the HAL function HalpGetSystemInterruptVector, which maps interrupts to IRQLs. The algorithm for assignment differs for the various HALs that Windows includes. On uniprocessor x86 systems, the HAL performs a straightforward translation: the IRQL of a given interrupt vector is calculated by subtracting the interrupt vector from 27. Thus, if a device uses interrupt vector 5, its ISR executes at IRQL 22. On an x86 multiprocessor system, the mapping isn't as simple. APICs support over 200 interrupt vectors, so there aren't enough IRQLs for a one-to-one correspondence. The multiprocessor HAL therefore assigns IRQLs to interrupt vectors in a round-robin manner, cycling through the device IRQL (DIRQL) range. As a result, on an x86 multiprocessor system there's no easy way for you to predict or to know what IRQL Windows assigns to APIC IRQs. Finally, on x64 and IA64 systems, the HAL computes the IRQL for a given IRQ by dividing the interrupt vector assigned to the IRQ by 16. Predefined IRQLs Let's take a closer look at the use of the predefined IRQLs, starting from the highest level shown in Figure 3-5:
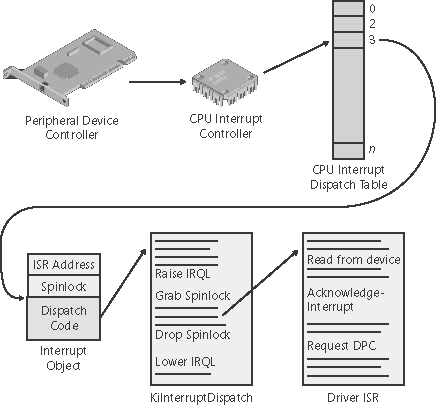
One important restriction on code running at DPC/dispatch level or above is that it can't wait for an object if doing so would necessitate the scheduler to select another thread to execute, which is an illegal operation because the scheduler synchronizes its data structures at DPC/ dispatch level and cannot therefore be invoked to perform a reschedule. Another restriction is that only nonpaged memory can be accessed at IRQL DPC/dispatch level or higher. This rule is actually a side-effect of the first restriction because attempting to access memory that isn't resident results in a page fault. When a page fault occurs, the memory manager initiates a disk I/O and then needs to wait for the file system driver to read the page in from disk. This wait would in turn require the scheduler to perform a context switch (perhaps to the idle thread if no user thread is waiting to run), thus violating the rule that the scheduler can't be invoked (because the IRQL is still DPC/dispatch level or higher at the time of the disk read). If either of these two restrictions is violated, the system crashes with an IRQL_NOT_LESS_OR_EQUAL crash code. (See Chapter 4 for a thorough discussion of system crashes.) Violating these restrictions is a common bug in device drivers. The Windows Driver Verifier, explained in the section "Driver Verifier" in Chapter 7, has an option you can set to assist in finding this particular type of bug. Interrupt Objects The kernel provides a portable mechanism a kernel control object called an interrupt object that allows device drivers to register ISRs for their devices. An interrupt object contains all the information the kernel needs to associate a device ISR with a particular level of interrupt, including the address of the ISR, the IRQL at which the device interrupts, and the entry in the kernel's IDT with which the ISR should be associated. When an interrupt object is initialized, a few instructions of assembly language code, called the dispatch code, are copied from an interrupt handling template, KiInterruptTemplate, and stored in the object. When an interrupt occurs, this code is executed. This interrupt-object resident code calls the real interrupt dispatcher, which is typically either the kernel's KiInterruptDispatch or KiChainedDispatch routine, passing it a pointer to the interrupt object. KiInterruptDispatch is the routine used for interrupt vectors for which only one interrupt object is registered, and KiChainedDispatch is for vectors shared among multiple interrupt objects. The interrupt object contains information this second dispatcher routine needs to locate and properly call the ISR the device driver provides. The interrupt object also stores the IRQL associated with the interrupt so that KiInterruptDispatch or KiChainedDispatch can raise the IRQL to the correct level before calling the ISR and then lower the IRQL after the ISR has returned. This two-step process is required because there's no way to pass a pointer to the interrupt object (or any other argument for that matter) on the initial dispatch because the initial dispatch is done by hardware. On a multiprocessor system, the kernel allocates and initializes an interrupt object for each CPU, enabling the local APIC on that CPU to accept the particular interrupt. Figure 3-6 shows typical interrupt control flow for interrupts associated with interrupt objects. Figure 3-6. Typical interrupt control flow
Associating an ISR with a particular level of interrupt is called connecting an interrupt object, and dissociating an ISR from an IDT entry is called disconnecting an interrupt object. These operations, accomplished by calling the kernel functions IoConnectInterrupt and IoDisconnectInterrupt, allow a device driver to "turn on" an ISR when the driver is loaded into the system and to "turn off" the ISR if the driver is unloaded. Using the interrupt object to register an ISR prevents device drivers from fiddling directly with interrupt hardware (which differs among processor architectures) and from needing to know any details about the IDT. This kernel feature aids in creating portable device drivers because it eliminates the need to code in assembly language or to reflect processor differences in device drivers. Interrupt objects provide other benefits as well. By using the interrupt object, the kernel can synchronize the execution of the ISR with other parts of a device driver that might share data with the ISR. (See Chapter 9 for more information about how device drivers respond to interrupts.) Furthermore, interrupt objects allow the kernel to easily call more than one ISR for any interrupt level. If multiple device drivers create interrupt objects and connect them to the same IDT entry, the interrupt dispatcher calls each routine when an interrupt occurs at the specified interrupt line. This capability allows the kernel to easily support "daisy-chain" configurations, in which several devices share the same interrupt line. The chain breaks when one of the ISRs claims ownership for the interrupt by returning a status to the interrupt dispatcher. If multiple devices sharing the same interrupt require service at the same time, devices not acknowledged by their ISRs will interrupt the system again once the interrupt dispatcher has lowered the IRQL. Chaining is permitted only if all the device drivers wanting to use the same interrupt indicate to the kernel that they can share the interrupt; if they can't, the Plug and Play manager reorganizes their interrupt assignments to ensure that it honors the sharing requirements of each. If the interrupt vector is shared, the interrupt object invokes KiChainedDispatch, which will invoke the ISRs of each registered interrupt object in turn until one of them claims the interrupt or all have been executed. In the earlier sample !idt output, vector 0x3b is connected to several chained interrupt objects. Software InterruptsAlthough hardware generates most interrupts, the Windows kernel also generates software interrupts for a variety of tasks, including these:
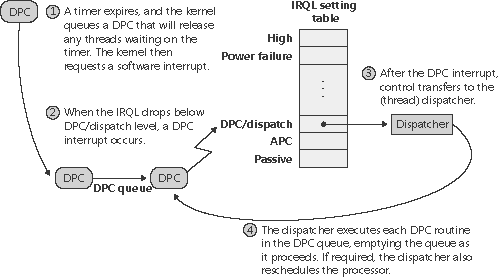
These tasks are described in the following subsections. Dispatch or Deferred Procedure Call (DPC) Interrupts When a thread can no longer continue executing, perhaps because it has terminated or because it voluntarily enters a wait state, the kernel calls the dispatcher directly to effect an immediate context switch. Sometimes, however, the kernel detects that rescheduling should occur when it is deep within many layers of code. In this situation, the kernel requests dispatching but defers its occurrence until it completes its current activity. Using a DPC software interrupt is a convenient way to achieve this delay. The kernel always raises the processor's IRQL to DPC/dispatch level or above when it needs to synchronize access to shared kernel structures. This disables additional software interrupts and thread dispatching. When the kernel detects that dispatching should occur, it requests a DPC/dispatch-level interrupt; but because the IRQL is at or above that level, the processor holds the interrupt in check. When the kernel completes its current activity, it sees that it's going to lower the IRQL below DPC/dispatch level and checks to see whether any dispatch interrupts are pending. If there are, the IRQL drops to DPC/dispatch level and the dispatch interrupts are processed. Activating the thread dispatcher by using a software interrupt is a way to defer dispatching until conditions are right. However, Windows uses software interrupts to defer other types of processing as well. In addition to thread dispatching, the kernel also processes deferred procedure calls (DPCs) at this IRQL. A DPC is a function that performs a system task a task that is less time-critical than the current one. The functions are called deferred because they might not execute immediately. DPCs provide the operating system with the capability to generate an interrupt and execute a system function in kernel mode. The kernel uses DPCs to process timer expiration (and release threads waiting for the timers) and to reschedule the processor after a thread's quantum expires. Device drivers use DPCs to complete I/O requests. To provide timely service for hardware interrupts, Windows with the cooperation of device drivers attempts to keep the IRQL below device IRQL levels. One way that this goal is achieved is for device driver ISRs to perform the minimal work necessary to acknowledge their device, save volatile interrupt state, and defer data transfer or other less time-critical interrupt processing activity for execution in a DPC at DPC/dispatch IRQL. (See Chapter 9 for more information on DPCs and the I/O system.) A DPC is represented by a DPC object, a kernel control object that is not visible to user-mode programs but is visible to device drivers and other system code. The most important piece of information the DPC object contains is the address of the system function that the kernel will call when it processes the DPC interrupt. DPC routines that are waiting to execute are stored in kernel-managed queues, one per processor, called DPC queues. To request a DPC, system code calls the kernel to initialize a DPC object and then places it in a DPC queue. By default, the kernel places DPC objects at the end of the DPC queue of the processor on which the DPC was requested (typically the processor on which the ISR executed). A device driver can override this behavior, however, by specifying a DPC priority (low, medium, or high, where medium is the default) and by targeting the DPC at a particular processor. A DPC aimed at a specific CPU is known as a targeted DPC. If the DPC has a low or medium priority, the kernel places the DPC object at the end of the queue; if the DPC has a high priority, the kernel inserts the DPC object at the front of the queue. When the processor's IRQL is about to drop from an IRQL of DPC/dispatch level or higher to a lower IRQL (APC or passive level), the kernel processes DPCs. Windows ensures that the IRQL remains at DPC/dispatch level and pulls DPC objects off the current processor's queue until the queue is empty (that is, the kernel "drains" the queue), calling each DPC function in turn. Only when the queue is empty will the kernel let the IRQL drop below DPC/dispatch level and let regular thread execution continue. DPC processing is depicted in Figure 3-7. Figure 3-7. Delivering a DPC
DPC priorities can affect system behavior another way. The kernel usually initiates DPC queue draining with a DPC/dispatch-level interrupt. The kernel generates such an interrupt only if the DPC is directed at the processor the ISR is requested on and the DPC has a high or medium priority. If the DPC has a low priority, the kernel requests the interrupt only if the number of outstanding DPC requests for the processor rises above a threshold or if the number of DPCs requested on the processor within a time window is low. If a DPC is targeted at a CPU different from the one on which the ISR is running and the DPC's priority is high, the kernel immediately signals the target CPU (by sending it a dispatch IPI) to drain its DPC queue. If the priority is medium or low, the number of DPCs queued on the target processor must exceed a threshold for the kernel to trigger a DPC/dispatch interrupt. The system idle thread also drains the DPC queue for the processor it runs on. Although DPC targeting and priority levels are flexible, device drivers rarely need to change the default behavior of their DPC objects. Table 3-1 summarizes the situations that initiate DPC queue draining.
Because user-mode threads execute at low IRQL, the chances are good that a DPC will interrupt the execution of an ordinary user's thread. DPC routines execute without regard to what thread is running, meaning that when a DPC routine runs, it can't assume what process address space is currently mapped. DPC routines can call kernel functions, but they can't call system services, generate page faults, or create or wait for dispatcher objects (explained later in this chapter). They can, however, access nonpaged system memory addresses, because system address space is always mapped regardless of what the current process is. DPCs are provided primarily for device drivers, but the kernel uses them too. The kernel most frequently uses a DPC to handle quantum expiration. At every tick of the system clock, an interrupt occurs at clock IRQL. The clock interrupt handler (running at clock IRQL) updates the system time and then decrements a counter that tracks how long the current thread has run. When the counter reaches 0, the thread's time quantum has expired and the kernel might need to reschedule the processor, a lower-priority task that should be done at DPC/dispatch IRQL. The clock interrupt handler queues a DPC to initiate thread dispatching and then finishes its work and lowers the processor's IRQL. Because the DPC interrupt has a lower priority than do device interrupts, any pending device interrupts that surface before the clock interrupt completes are handled before the DPC interrupt occurs.
Asynchronous Procedure Call (APC) Interrupts Asynchronous procedure calls (APCs) provide a way for user programs and system code to execute in the context of a particular user thread (and hence a particular process address space). Because APCs are queued to execute in the context of a particular thread and run at an IRQL less than DPC/dispatch level, they don't operate under the same restrictions as a DPC. An APC routine can acquire resources (objects), wait for object handles, incur page faults, and call system services. APCs are described by a kernel control object, called an APC object. APCs waiting to execute reside in a kernel-managed APC queue. Unlike the DPC queue, which is systemwide, the APC queue is thread-specific each thread has its own APC queue. When asked to queue an APC, the kernel inserts it into the queue belonging to the thread that will execute the APC routine. The kernel, in turn, requests a software interrupt at APC level, and when the thread eventually begins running, it executes the APC. There are two kinds of APCs: kernel mode and user mode. Kernel-mode APCs don't require "permission" from a target thread to run in that thread's context, while user-mode APCs do. Kernel-mode APCs interrupt a thread and execute a procedure without the thread's intervention or consent. There are also two types of kernel-mode APCs: normal and special. A thread can disable both types by raising the IRQL to APC_LEVEL or by calling KeEnterGuardedRegion, which was introduced in Windows Server 2003. KeEnterGuardedRegionThread disables APC delivery by setting the SpecialApcDisable field in the calling thread's KTHREAD structure (described further in Chapter 6). A thread can disable normal APCs only by calling KeEnterCriticalRegion, which sets the KernelApcDisable field in the thread's KTHREAD structure. The executive uses kernel-mode APCs to perform operating system work that must be completed within the address space (in the context) of a particular thread. It can use special kernel-mode APCs to direct a thread to stop executing an interruptible system service, for example, or to record the results of an asynchronous I/O operation in a thread's address space. Environment subsystems use special kernel-mode APCs to make a thread suspend or terminate itself or to get or set its user-mode execution context. The POSIX subsystem uses kernel-mode APCs to emulate the delivery of POSIX signals to POSIX processes. Device drivers also use kernel-mode APCs. For example, if an I/O operation is initiated and a thread goes into a wait state, another thread in another process can be scheduled to run. When the device finishes transferring data, the I/O system must somehow get back into the context of the thread that initiated the I/O so that it can copy the results of the I/O operation to the buffer in the address space of the process containing that thread. The I/O system uses a special kernel-mode APC to perform this action. (The use of APCs in the I/O system is discussed in more detail in Chapter 9.) Several Windows APIs, such as ReadFileEx, WriteFileEx, and QueueUserAPC, use user-mode APCs. For example, the ReadFileEx and WriteFileEx functions allow the caller to specify a completion routine to be called when the I/O operation finishes. The I/O completion is implemented by queueing an APC to the thread that issued the I/O. However, the callback to the completion routine doesn't necessarily take place when the APC is queued because user-mode APCs are delivered to a thread only when it's in an alertable wait state. A thread can enter a wait state either by waiting for an object handle and specifying that its wait is alertable (with the Windows WaitForMultipleObjectsEx function) or by testing directly whether it has a pending APC (using SleepEx). In both cases, if a user-mode APC is pending, the kernel interrupts (alerts) the thread, transfers control to the APC routine, and resumes the thread's execution when the APC routine completes. Unlike kernel-mode APCs, which execute at APC level, usermode APCs execute at passive level. APC delivery can reorder the wait queues the lists of which threads are waiting for what, and in what order they are waiting. (Wait resolution is described in the section "Low-IRQL Synchronization" later in this chapter.) If the thread is in a wait state when an APC is delivered, after the APC routine completes, the wait is reissued or reexecuted. If the wait still isn't resolved, the thread returns to the wait state, but now it will be at the end of the list of objects it's waiting for. For example, because APCs are used to suspend a thread from execution, if the thread is waiting for any objects, its wait will be removed until the thread is resumed, after which that thread will be at the end of the list of threads waiting to access the objects it was waiting for. Exception DispatchingIn contrast to interrupts, which can occur at any time, exceptions are conditions that result directly from the execution of the program that is running. Windows introduced a facility known as structured exception handling, which allows applications to gain control when exceptions occur. The application can then fix the condition and return to the place the exception occurred, unwind the stack (thus terminating execution of the subroutine that raised the exception), or declare back to the system that the exception isn't recognized and the system should continue searching for an exception handler that might process the exception. This section assumes you're familiar with the basic concepts behind Windows structured exception handling if you're not, you should read the overview in the Windows API reference documentation on the Platform SDK or chapters 23 through 25 in Jeffrey Richter's book Programming Applications for Microsoft Windows (Fourth Edition, Microsoft Press, 2000) before proceeding. Keep in mind that although exception handling is made accessible through language extensions (for example, the __try construct in Microsoft Visual C++), it is a system mechanism and hence isn't language-specific. Other examples of consumers of Windows exception handling include C++ and Java exceptions. On the x86, all exceptions have predefined interrupt numbers that directly correspond to the entry in the IDT that points to the trap handler for a particular exception. Table 3-2 shows x86-defined exceptions and their assigned interrupt numbers. Because the first entries of the IDT are used for exceptions, hardware interrupts are assigned entries later in the table, as mentioned earlier.
All exceptions, except those simple enough to be resolved by the trap handler, are serviced by a kernel module called the exception dispatcher. The exception dispatcher's job is to find an exception handler that can "dispose of" the exception. Examples of architecture-independent exceptions that the kernel defines include memory access violations, integer divide-by-zero, integer overflow, floating-point exceptions, and debugger breakpoints. For a complete list of architecture-independent exceptions, consult the Windows API reference documentation. The kernel traps and handles some of these exceptions transparently to user programs. For example, encountering a breakpoint while executing a program being debugged generates an exception, which the kernel handles by calling the debugger. The kernel handles certain other exceptions by returning an unsuccessful status code to the caller. A few exceptions are allowed to filter back, untouched, to user mode. For example, a memory access violation or an arithmetic overflow generates an exception that the operating system doesn't handle. An environment subsystem can establish frame-based exception handlers to deal with these exceptions. The term frame-based refers to an exception handler's association with a particular procedure activation. When a procedure is invoked, a stack frame representing that activation of the procedure is pushed onto the stack. A stack frame can have one or more exception handlers associated with it, each of which protects a particular block of code in the source program. When an exception occurs, the kernel searches for an exception handler associated with the current stack frame. If none exists, the kernel searches for an exception handler associated with the previous stack frame, and so on, until it finds a frame-based exception handler. If no exception handler is found, the kernel calls its own default exception handlers. When an exception occurs, whether it is explicitly raised by software or implicitly raised by hardware, a chain of events begins in the kernel. The CPU hardware transfers control to the kernel trap handler, which creates a trap frame (as it does when an interrupt occurs). The trap frame allows the system to resume where it left off if the exception is resolved. The trap handler also creates an exception record that contains the reason for the exception and other pertinent information. If the exception occurred in kernel mode, the exception dispatcher simply calls a routine to locate a frame-based exception handler that will handle the exception. Because unhandled kernel-mode exceptions are considered fatal operating system errors, you can assume that the dispatcher always finds an exception handler. If the exception occurred in user mode, the exception dispatcher does something more elaborate. As you'll see in Chapter 6, the Windows subsystem has a debugger port and an exception port to receive notification of user-mode exceptions in Windows processes. The kernel uses these in its default exception handling, as illustrated in Figure 3-8. Figure 3-8. Dispatching an exception
Debugger breakpoints are common sources of exceptions. Therefore, the first action the exception dispatcher takes is to see whether the process that incurred the exception has an associated debugger process. If it does and the system is Windows 2000, the exception dispatcher sends the first-chance debug message via an LPC to the debugger port associated with the process that incurred the exception. The LPC message is sent to the session manager process, which then dispatches it to the appropriate debugger process. On Windows XP and Windows Server 2003, the exception dispatcher sends a debugger object message to the debug object associated with the process (which internally the system refers to as a port). If the process has no debugger process attached, or if the debugger doesn't handle the exception, the exception dispatcher switches into user mode, copies the trap frame to the user stack formatted as a CONTEXT data structure (documented in the Platform SDK), and calls a routine to find a frame-based exception handler. If none is found, or if none handles the exception, the exception dispatcher switches back into kernel mode and calls the debugger again to allow the user to do more debugging. (This is called the second-chance notification.) If the debugger isn't running and no frame-based handlers are found, the kernel sends a message to the exception port associated with the thread's process. This exception port, if one exists, was registered by the environment subsystem that controls this thread. The exception port gives the environment subsystem, which presumably is listening at the port, the opportunity to translate the exception into an environment-specific signal or exception. CSRSS (Client/Server Run-Time Subsystem) simply presents a message box notifying the user of the fault and terminates the process, and when POSIX gets a message from the kernel that one of its threads generated an exception, the POSIX subsystem sends a POSIX-style signal to the thread that caused the exception. However, if the kernel progresses this far in processing the exception and the subsystem doesn't handle the exception, the kernel executes a default exception handler that simply terminates the process whose thread caused the exception. Unhandled ExceptionsAll Windows threads have an exception handler declared at the top of the stack that processes unhandled exceptions. This exception handler is declared in the internal Windows start-ofprocess or start-of-thread function. The start-of-process function runs when the first thread in a process begins execution. It calls the main entry point in the image. The start-of-thread function runs when a user creates additional threads. It calls the user-supplied thread start routine specified in the CreateThread call.
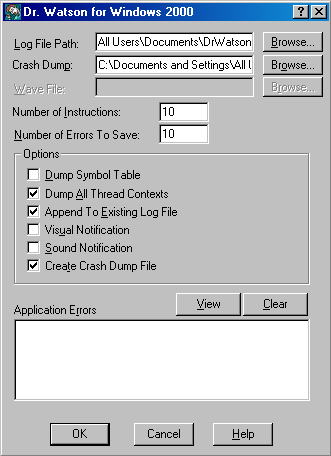
The generic code for these internal start functions is shown here: void Win32StartOfProcess( LPTHREAD_START_ROUTINElpStartAddr, LPVOID lpvThreadParm){ __try { DWORD dwThreadExitCode =lpStartAddr(lpvThreadParm); ExitThread(dwThreadExitCode); } __except(UnhandledExceptionFilter( GetExceptionInformation())){ ExitProcess(GetExceptionCode()); } }Notice that the Windows unhandled exception filter is called if the thread has an exception that it doesn't handle. The purpose of this function is to provide the system-defined behavior for what to do when an exception is not handled, which is based on the contents of the HKLM\SOFTWARE\Microsoft\Windows NT\CurrentVersion\AeDebug registry key. There are two important values: Auto and Debugger. Auto tells the unhandled exception filter whether to automatically run the debugger or ask the user what to do. By default, it is set to 1, which means that it will launch the debugger automatically. However, installing development tools such as Visual Studio changes this to 0. The Debugger value is a string that points to the path of the debugger executable to run in the case of an unhandled exception. The default debugger is \Windows\System32\Drwtsn32.exe (Dr. Watson), which isn't really a debugger but rather a postmortem tool that captures the state of the application "crash" and records it in a log file (Drwtsn32.log) and a process crash dump file (User.dmp), both found by default in the \Documents And Settings\All Users\Documents\DrWatson folder. To see (or modify) the configuration for Dr. Watson, run it interactively it displays a window with the current settings, as shown in Figure 3-9. Figure 3-9. Windows 2000 Dr. Watson default settings
The log file contains basic information such as the exception code, the name of the image that failed, a list of loaded DLLs, and a stack and instruction trace for the thread that incurred the exception. For a detailed description of the contents of the log file, run Dr. Watson and click the Help button shown in Figure 3-9. The crash dump file contains the private pages in the process at the time of the exception. (The file doesn't include code pages from EXEs or DLLs.) This file can be opened by WinDbg, the Windows debugger that comes with the Debugging Tools package, or by Visual Studio 2003 and later. Because the User.dmp file is overwritten each time a process crashes, unless you rename or copy the file after each process crash, you'll have only the latest one on your system. On Windows 2000 Professional systems, visual notification is turned on by default. The message box shown in Figure 3-10 is displayed by Dr. Watson after it generates the crash dump and records information in its log file. Figure 3-10. Windows 2000 Dr. Watson error message
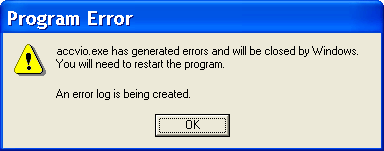
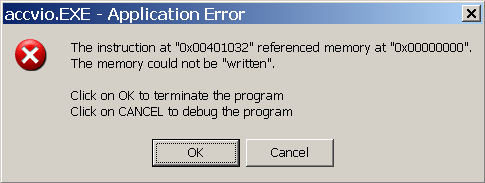
The Dr. Watson process remains until the message box is dismissed, which is why on Windows 2000 Server systems visual notification is turned off by default. This default is used because if a server application fails, there is usually nobody at the console to see it and dismiss the message box. Instead, server applications should log errors to the Windows event log. On Windows 2000, if the Auto value is set to zero, the message box shown in Figure 3-11 is displayed. Figure 3-11. Windows 2000 Unhandled exception message
If the OK button is clicked, the process exits. If Cancel is clicked, the system defined debugger process (specified by the Debugger's value in the registry path referred to earlier) is launched.
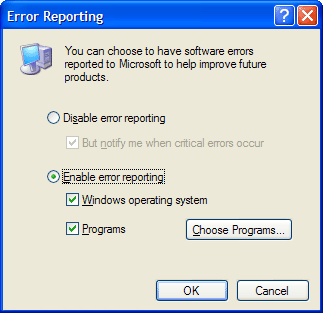
Windows Error ReportingWindows XP and Windows Server 2003 have a new, more sophisticated error-reporting mechanism called Windows Error Reporting that automates the submission of both usermode process crashes as well as kernel-mode system crashes. (For a description of how this applies to system crashes, see Chapter 14). Windows Error Reporting can be configured by going to My Computer, selecting Properties, Advanced, and then Error Reporting (which brings up the dialog box shown in Figure 3-12) or by local or domain group policy settings under System, Error Reporting. These settings are stored in the registry under the key HKLM\Software\Microsoft\PCHealth\ErrorReporting. Figure 3-12. Error Reporting Configuration dialog box
When an unhandled exception is caught by the unhandled exception filter (described in the previous section), an initial check is made to see whether or not to initiate Windows Error Reporting. If the registry value HKLM\SOFTWARE\Microsoft\Windows NT\CurrentVersion\AeDebug\Auto is set to zero or the Debugger string contains the text "Drwtsn32", the unhandled exception filter loads \Windows\System32\Faultrep.dll into the failing process and calls its ReportFault function. ReportFault then checks the error-reporting configuration stored under HKLM\Software\Microsoft\PCHealth\ErrorReporting to see whether this process crash should be reported, and if so, how. In the normal case, ReportFault creates a process running \Windows\System32\Dwwin.exe, which displays a message box announcing the process crash along with an option to submit the error report to Microsoft as seen in Figure 3-13. Figure 3-13. Windows Error Reporting dialog box
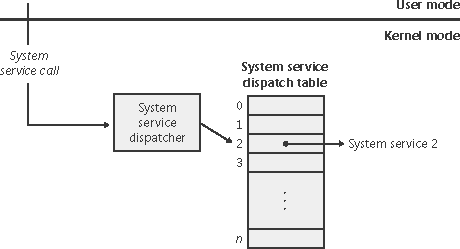
If the Send Error Report button is clicked, the error report (a minidump and a text file with details on the DLL version numbers loaded in the process) is sent to Microsoft's online crash analysis server, Watson.Microsoft.com. (Unlike kernel mode system crashes, in this situation there is no way to find out whether a solution is available at the time of the report submission.) Then the unhandled exception filter creates a process to run the system-defined debugger (normally Drwtsn32.exe), which by default creates its own dump file and log entry. Unlike Windows 2000, the dump file is a minidump, not a full dump. So, in the case where a full process memory dump is needed to debug a failing application, you can change the configuration of Dr. Watson by running it with no command-line arguments as described in the previous section. In environments where systems are not connected to the Internet or where the administrator wants to control which error reports are submitted to Microsoft, the destination for the error report can be configured to be an internal file server. Microsoft provides to qualified customers a tool set called Corporate Error Reporting that understands the directory structure created by Windows Error Reporting and provides the administrator with the option to take selective error reports and submit them to Microsoft. (For more information, see http://www.microsoft.com/resources/satech/cer.) System Service DispatchingAs Figure 3-1 illustrated, the kernel's trap handlers dispatch interrupts, exceptions, and system service calls. In the preceding sections, you've seen how interrupt and exception handling work; in this section, you'll learn about system services. A system service dispatch is triggered as a result of executing an instruction assigned to system service dispatching. The instruction that Windows uses for system service dispatching depends on the processor on which it's executing. 32-Bit System Service DispatchingOn x86 processors prior to the Pentium II, Windows uses the int 0x2e instruction (46) decimal, which results in a trap. Windows fills in entry 46 in the IDT to point to the system service dispatcher. (Refer to Table 3-1.) The trap causes the executing thread to transition into kernel mode and enter the system service dispatcher. A numeric argument passed in the EAX processor register indicates the system service number being requested. The EBX register points to the list of parameters the caller passes to the system service. On x86 Pentium II processors and higher, Windows uses the special sysenter instruction, which Intel defined specifically for fast system service dispatches. To support the instruction, Windows stores at boot time the address of the kernel's system service dispatcher routine in a register associated with the instruction. The execution of the instruction causes the change to kernel-mode and execution of the system service dispatcher. The system service number is passed in the EAX processor register, and the EDX register points to the list of caller arguments. To return to user-mode, the system service dispatcher usually executes the sysexit instruction. (In some cases, like when the single-step flag is enabled on the processor, the system service dispatcher uses the iretd instruction instead.) On K6 and higher 32-bit AMD processors, Windows uses the special syscall instruction, which functions similar to the x86 sysenter instruction, with Windows configuring a syscall-associated processor register with the address of the kernel's system service dispatcher. The system call number is passed in the EAX register, and the stack stores the caller arguments. After completing the dispatch, the kernel executes the sysret instruction. At boot time, Windows detects the type of processor on which it's executing and sets up the appropriate system call code to be used. The system service code for NtReadFile in user mode looks like this: ntdll!NtReadFile: 77f5bfa8 b8b7000000 mov eax,0xb7 77f5bfad ba0003fe7f mov edx,0x7ffe0300 77f5bfb2 ffd2 call edx 77f5bfb4 c22400 ret 0x24 The system service number is 0xb7 (183 in decimal) and the call instruction executes the system service dispatch code set up by the kernel, which in this example is at address 0x7ffe0300. Because this was taken from a Pentium M, it uses sysenter: SharedUserData!SystemCallStub: 7ffe0300 8bd4 mov edx,esp 7ffe0302 0f34 sysenter 7ffe0304 c3 ret 64-Bit System Service DispatchingOn the x64 architecture, Windows uses the syscall instruction, which functions like the AMD K6's syscall instruction, for system service dispatching, passing the system call number in the EAX register, the first four parameters in registers, and any parameters beyond those four on the stack: ntdll!NtReadFile: 00000000'77f9fc60 4c8bd1 mov r10,rcx 00000000'77f9fc63 b8bf000000 mov eax,0xbf 00000000'77f9fc68 0f05 syscall 00000000'77f9fc6a c3 ret On the IA64 architecture, Windows uses the epc (Enter Privileged Mode) instruction. The first eight system call arguments are passed in registers, and the rest are passed on the stack. Kernel-Mode System Service DispatchingAs Figure 3-14 illustrates, the kernel uses this argument to locate the system service information in the system service dispatch table. This table is similar to the interrupt dispatch table described earlier in the chapter except that each entry contains a pointer to a system service rather than to an interrupt handling routine. Figure 3-14. System service exceptions
Note
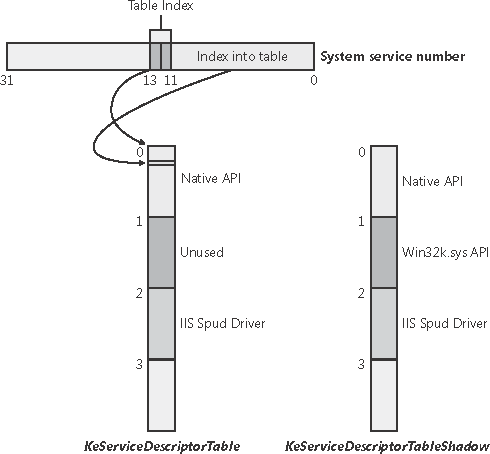
The system service dispatcher, KiSystemService, copies the caller's arguments from the thread's user-mode stack to its kernel-mode stack (so that the user can't change the arguments as the kernel is accessing them), and then executes the system service. If the arguments passed to a system service point to buffers in user space, these buffers must be probed for accessibility before kernel-mode code can copy data to or from them. As you'll see in Chapter 6, each thread has a pointer to its system service table. Windows has two built-in system service tables, but up to four are supported. The system service dispatcher determines which table contains the requested service by interpreting a 2-bit field in the 32-bit system service number as a table index. The low 12 bits of the system service number serve as the index into the table specified by the table index. The fields are shown in Figure 3-15. Figure 3-15. System service number to system service translation
Service Descriptor TablesA primary default array table, KeServiceDescriptorTable, defines the core executive system services implemented in Ntosrknl.exe. The other table array, KeServiceDescriptorTableShadow, includes the Windows USER and GDI services implemented in the kernel-mode part of the Windows subsystem, Win32k.sys. The first time a Windows thread calls a Windows USER or GDI service, the address of the thread's system service table is changed to point to a table that includes the Windows USER and GDI services. The KeAddSystemServiceTable function allows Win32k.sys and other device drivers to add system service tables. If you install Internet Information Services (IIS) on Windows 2000, its support driver (Spud.sys) upon loading defines an additional service table, leaving only one left for definition by third parties. With the exception of the Win32k.sys service table, a service table added with KeAddSystemServiceTable is copied into both the KeServiceDescriptorTable array and the KeServiceDescriptorTableShadow array. Windows supports the addition of only two system service tables beyond the core and Win32 tables. Note
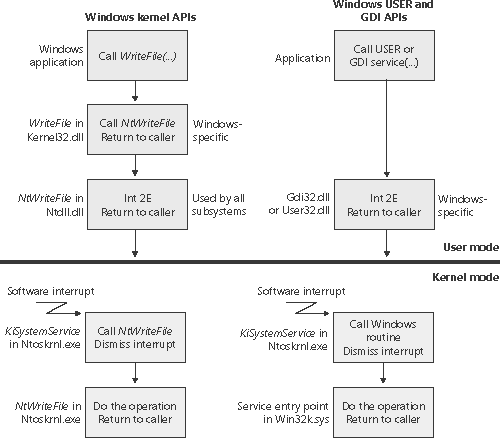
The system service dispatch instructions for Windows executive services exist in the system library Ntdll.dll. Subsystem DLLs call functions in Ntdll to implement their documented functions. The exception is Windows USER and GDI functions, in which the system service dispatch instructions are implemented directly in User32.dll and Gdi32.dll there is no Ntdll.dll involved. These two cases are shown in Figure 3-16. Figure 3-16. System service dispatching
As shown in Figure 3-16, the Windows WriteFile function in Kernel32.dll calls the NtWriteFile function in Ntdll.dll, which in turn executes the appropriate instruction to cause a system service trap, passing the system service number representing NtWriteFile. The system service dispatcher (function KiSystemService in Ntoskrnl.exe) then calls the real NtWriteFile to process the I/O request. For Windows USER and GDI functions, the system service dispatch calls functions in the loadable kernel-mode part of the Windows subsystem, Win32k.sys.
|
| < Day Day Up > |
EAN: 2147483647
Pages: 158
