Debugging
| I l @ ve RuBoard |
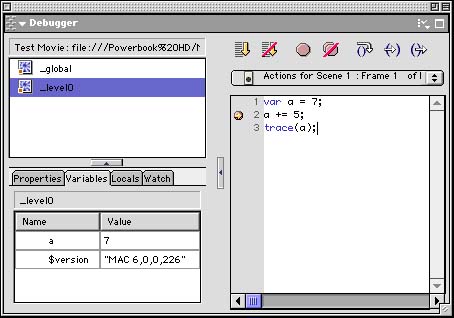
| No matter how careful you are writing your program, every programmer has to eventually deal with bugs . To stamp out these pesky things, you should be as skilled in debugging techniques as you are in programming. Three methods are useful for debugging: logical deduction , sending messages to the Output window, and the ActionScript debugger. Logical DeductionMost bugs that occur are simple and easy to track down and fix. You won't need any special tools. When the bug occurs, you will have a pretty good idea of what it is and where it is. Even if you don't know where the problem is at first, if you act like a detective and look through your code, you can usually find it. Think of all the information that you have as clues: When did the problem happen? What happened? What should have happened instead? What else unusual went on that might be another symptom of the bug? No one knows your program better than you do. If you use logical deduction, you should be able to find your bug and fix it. However, some bugs are a little trickier, so you will need to use some helpful tools. Output WindowA simple but effective tool in debugging is the Output window. You can place trace commands in your program that send information to the Output window. This information can tell you what your code is doing. For instance, suppose that you have a simple loop that doesn't seem to work right. By adding a few trace commands, you can get a list of actions in the Output window that should point you in the right direction. for(var i=0;i<9;i++) { trace("starting loop"); trace(i); a += i; trace(a); trace("ending loop"); } In this example, you will get a series of "starting loop" and "ending loop" messages, with two numbers representing the variables i and a between them. You can then watch the progression as these two variables change. DebuggerA more heavy-duty tool is the debugger. This is a Flash window that shows you all sorts of data about your Flash movie and ActionScript code as your movie plays. To use the Debugger window, choose Control, Debug Movie rather than Control, Test Movie. Your movie will compile and launch, but this time with the Debugger window shown. Figure 4.3 shows the Debugger window. It contains several panes. The pane on the left has several tabs that allow you to examine different types of things in the Flash movie. The pane on the right shows you your ActionScript code. Figure 4.3. The Debugger window is a complex tool that will help you track down bugs. One way to use the Debugger window is to set breakpoints. A breakpoint is an indicator placed next to a line of code in your scripts. When you test the movie in debug mode, the movie automatically stops at a breakpoint and allows you to examine the current state of the movie, including variable values. You can then proceed to step, line-by-line , through the code. Because you are just getting started with ActionScript, the Debugger window is a needlessly complex tool. However, as you advanced from novice to expert, you will find yourself needing it more. |
| I l @ ve RuBoard |
EAN: 2147483647
Pages: 272