JIT Compiler Optimization
Compiler optimization is an area that many programmers are concerned about. Generally speaking, you don't just want your program to run correctly, but you want it to run efficiently so that it is responsive to the user and doesn't unnecessarily hog processor time or system resources. And this area has been of particular concern to C++ developers, who generally expend the extra effort required to write the code in C++ at least partly in order to gain the claimed performance benefits. In this section, we'll review the specific optimizations that the JIT compiler is likely to actually perform on your code.
Microsoft has countered the argument that the machine cycles taken by JIT compilation will slow the process down by arguing that not only has the JIT compiler been designed to be highly efficient, but it can perform additional optimizations that classic compilers will not able to do. In particular, the JIT compiler knows which machine the application will run on and can therefore perform optimizations specific to that processor. Indeed, Microsoft has argued that this is one reason why JIT-compiled code might one day run faster than native executable code. It does certainly seem that the fears of many developers at the time of .NET's release that the JIT compiler would significantly affect performance have largely been unfounded.
Before we go on to the actual optimizations, I should stress that the optimizations performed are fairly low-level ones - the sort of optimization where you move a variable initialization outside a loop, for example. Those optimizations can have an effect on performance, but it's not very often that the effect is particularly dramatic. For most cases, if you want to maximize performance, you're better off looking at higher-level aspects of your program: whether you define a type as a class or a struct, what algorithms you use, and so on. We will go over what you can do in this regard in detail soon. My reasoning for explaining the low-level optimizations the JIT compiler performs in detail is partly to reassure you that these kinds of optimizations are being done, and partly to make it clear that these are optimizations that you should not do yourself - because the JIT compiler can do them better. For example, don't waste your time worrying about exactly where to initialize that variable - your time is better spent elsewhere.
I'd advise against taking the details of specific optimizations in this section as gospel. Microsoft has not extensively documented the JIT compiler optimizations for the obvious reason that that is an internal implementation that could change at any time. We can be fairly sure that as newer versions of the compiler become available, more optimizations will be added. I guess it's even possible some optimizations might be removed if they turn out to take longer to process than is worthwhile from the resultant performance improvements. I've pieced the material in this section together from the few snippets of documentation that are available, from a few brief words with MS developers at conferences, and from having a look at the native assembly produced by small IL programs. Also don't assume this list is exhaustive even in .NET version 1.0 - it almost certainly isn't. But it should give you an idea of what you can expect from the JIT compiler.
Let's look quickly at some of the optimizations that will almost certainly be performed on your code.
Evaluating Constant Expressions
The JIT compiler will evaluate constant expressions. In other words, this code (or at least its IL equivalent - for simplicity, we present these examples in C# rather than IL):
int x = 5; int y = x * 2;
Will be optimized to the equivalent of:
int x = 5; int y = 10;
Using Registers
The JIT compiler is fairly aggressive in its use of registers to store local variables or frequently used items of data. To explain the significance of this, we need to explain something about the actual architecture of a modern processor. Processors, in a very heavily simplified form, look something like this:
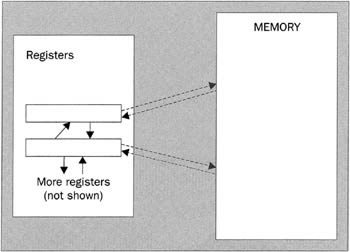
In this diagram, the arrows indicate possible paths for data flow. Solid arrow tails indicate very fast data flow, dashed arrow tails indicate slower data flow.
Data is stored in two places: memory and registers. In general, variables are stored in memory, but most arithmetic operations and so on will be carried out in the registers. To this extent, you'll notice that the IL virtual machine model, in which data can only be operated on once it is in the evaluation stack, does have similarities to actual machine architecture (these similarities help to explain why JIT compilation can be so fast). The registers differ from the conceptual evaluation stack in that they are each of a fixed size, and are usually designed to hold one number (although array-based registers are becoming more common, especially inside graphics cards). There might typically be 10-20 registers - as newer machines are released, the numbers are gradually going up. Some registers are wired up for floating point arithmetic, others for integers. But the point is that operations that involve only the registers are extremely fast. The JIT compiler takes advantage of this by storing a few selected local variables in the registers. According to the documentation, it will perform some analysis of your code to determine which data would be best placed there. Note, however, that there are a couple of restrictions. In particular, it is not possible to take the address of a register, so if your IL code attempts to take the address of any data, then that data has to be stored somewhere in normal memory. Hence objects will be stored in normal memory, though the object references can be in stored in registers. (But since a register is designed to store a single number, it wouldn't be practical to store an actual object in one anyway.)
Reusing Results of Expressions
Results from expressions may be reused. This means that this code:
int x = 43 * z; int y = 43 * z;
Would be optimized to the equivalent of:
int x = y = 43 * z;
Moving Unchanging Expressions Outside Loops
If the JIT compiler detects that an expression that cannot change is being repeatedly evaluated in a loop, it will move it outside the loop. Thus, this code:
for (int i=0; i<myArray.Length; i++) DoSomething(i);
Would probably be optimized to something like:
int len = myArray.Length; for (int i=0; i<len; i++) DoSomething(i);
Inlining Methods
This is a very important area, since inlining methods is one low-level optimization that can make a very significant difference. The philosophy of the JIT compiler here is very different from that in unmanaged C++. In C++, the developer got to choose whether a function should be inlined, by declaring it in the source code as an inline function:
// C++ code inline int GetWidth();
This was very a flexible system - it worked well and fitted in with the feeling among C++ developers that they knew which functions were going to be called extensively and therefore which were suitable candidates for inlining. However, despite this perception, it's worth remembering that the C++ inline keyword was a suggestion rather than a command, and as C++ compilers have become more sophisticated, they have increasingly tended to ignore inline requests, and instead made their own judgements about which methods should or shouldn't be inlined.
.NET has taken this trend to its logical conclusion, in which the compiler is the sole arbiter of what should be inlined. The JIT compiler does not support any ability for source files to express a preference for inlining methods: no equivalent of the inline keyword exists in C# or VB, and in C++ it is illegal to use inline for a member of a managed type. Instead, the JIT compiler decides for itself which methods are suitable candidates for inlining. According to Microsoft, it does this aggressively, and will inline a large number of functions. So if you have something like this:
area = SomeObject.Width * SomeObject.Height; where Width is defined like this:
int Width { get { return width; } } and Height is defined similarly, then the JIT compiler will probably compile it into the equivalent of this:
area = SomeObject.width * SomeObject.height; There is a minus to this, though. Although the JIT compiler may inline aggressively in some cases, it still has its own time constraints, and won't inline if that's going to take significant time to do. As a result of this, in version 1.0 it will not inline any method that occupies more than 32 bytes. Thirty-two might sound a lot, until you realize that a simple call instruction occupies five bytes (one for the opcode and four for the MethodDef token. You don't have to put very much code in a method before it exceeds 32 bytes! I can't help thinking that this means there must be a lot of methods in .NET code that are called from inside loops and which ought to be inlined, and would be inlined in the unmanaged C++ model, but which aren't in the .NET Framework.
It should also go without saying that virtual methods called using the IL callvirt instruction are not inlined. This is no different from the situation in unmanaged C++, for which virtual methods are not inlined - because it is impossible to tell until the method is actually invoked which override of the method is to be called. In principle, it's not impossible to inline virtual methods - there are some very sophisticated algorithms that have been developed, which a compiler could theoretically use to work out at JIT-compile time which version of a method is to be called, but I'm not aware of any plans to incorporate this kind of algorithm into the Microsoft's JIT compiler.
On the subject of inlining, I should also mention that there are a couple of other places where the JIT compiler cannot inline:
-
Calls to methods in other assemblies in most circumstances. Inlining across assemblies is more problematic than inlining within assemblies for obvious reasons, though it is possible in some cases.
-
Calls to methods that cross security boundaries. Inlining methods in this case would lead to the unfortunate situation where one instruction in some method might have different security privileges from the next instruction in the same method, after inlining. There's no sensible way that any algorithm to implement security could cope with that, so we don't inline in this case.
-
IL does define a noinlining flag - methods marked with this flag will not be inlined.
C and C++ developers will probably be thinking that there's nothing particularly exciting here - C and C++ compilers have been routinely doing these kinds of optimizations and much more for years. And C++ compilers generally have a lot of time at compile time in which to do sophisticated optimizations, whereas the design of the JIT compiler has to take account of performance while optimizing, which does restrict what it can do. Hopefully, the above list should nevertheless convince you that optimizations are taking place in your code, even if they are not up to the C++ standard in some respects.
Another issue is that because the JIT compiler has run-time knowledge that is not accessible to a classic compiler, it can perform extra optimizations. I have already mentioned some of the optimizations Microsoft has claimed in principle could be done here. These include:
-
Optimizations based on analyzing the actual execution flow through the program.
-
Optimizations based on using machine instructions specific to the actual hardware the program is running on.
-
Certain addresses that are not known at compile time will be known at run time, which means that the JIT compiler may be able to replace certain addresses that are coded as variables with constants, and then to perform the usual optimizations associated with constants. It may also in some cases be possible to reduce the level of indirection.
Although these optimizations are possible in principle, it's not completely clear which are actually implemented in version 1.0 and which may be implemented in future. The likelihood seems to be that the only implemented run-time knowledge-based optimization is that of replacing addresses.
NGen
Before we leave the subject of the JIT optimizations, it's worth saying a couple of words about ngen.exe. Microsoft has of course provided the native code generator, ngen.exe, as a utility that can pre-compile your JIT code, leaving an executable that contains roughly the native code that you would get from JIT compiling. Because of this, it's tempting to assume that if you ngen your applications before deploying them, they'll run faster. If you do think that, in most cases you'd be wrong. The problem is that ngen uses the same algorithms as the JIT compiler, but it can't perform as many optimizations because it doesn't have all the run-time information that the JIT compiler has. For example, ngen doesn't know where dependent assemblies are going to be loaded in memory, which means that many cross-assembly calls will have to get ngen'd into code that has an extra level of indirection. And the benefit of not having to JIT-compile each method only happens once, while that method may get executed without all the optimizations the JIT compiler could have supplied many times. People at Microsoft whom I've spoken to seem to be of the opinion that ngen'd code is likely in most cases to run a couple of percent slower than code that is JIT-compiled in the normal way. Bear in mind too that the ngen'd executable cannot be executed on its own - the CLR always expects to load the original assembly first, and the CLR may decide to re-JIT the assembly anyway if it has any reason to suspect the ngen'd file is out of date. Not only that, but if your application contains a large amount of code that is never executed, then this code would in the normal course of events never be JIT-compiled. But if the application has been ngen'd then all this code will have been compiled to native executable, which might considerably increase the size of the executable file to be loaded. The native ngen'd file itself is placed in a special area of the assembly cache.
In general, the main reason to ngen code is if your application needs to execute a large amount of startup code once, and you believe a large startup time is likely to annoy the users - in that case supplying an ngen'd file might reduce startup time. If you suspect that might be the case for your software, then you should experiment to see whether running ngen on your application will reduce startup time.
Controlling JIT Optimization
We should say at the outset that, beyond specifying the appropriate flags to instruct the compilers to optimize your code, there's not really much you can do to assist in low-level code optimization. As far as this area is concerned, you're better off viewing the JIT compiler as a black box that handles everything itself and - Microsoft claims - does it better than you could ever do by hand. However, in this section we will examine how you can turn JIT optimizing on or off - and that's actually more complicated than you might think.
The main difference between .NET compilation and unmanaged compilation to a native executable is of course that for managed code there are two stages at which compilation can happen - compiling from a high-level language to IL, and JIT-compiling the IL. As we found in Chapter 2, examining the IL produced at least by the C# and VB.NET compilers does suggest that these compilers actually rely on the JIT compiler for the bulk of the optimizations. The high-level language compilers themselves (other than the C++ one) will in general perform no more than the most elementary optimizations.
In this section we will examine the facilities that the JIT compiler makes available to you to control optimization.
The JIT compiler has two options when it compiles your IL:
-
It can choose whether or not to optimize as it converts the IL to native executable.
-
It can choose whether or not to generate tracking information that allows debuggers to figure out which IL instruction corresponds to a given native executable command being executed. This tracking information does not have a significant effect on performance, but can be important for debugging purposes.
There is also a separate issue - that of whether a program database (.pdb file) should be generated to accompany the assembly. The .pdb file contains information concerning the names of symbols in your source code, as well as which IL instructions correspond to which source code commands. Clearly the presence of this file is essential for debuggers to be able to work at a source code level. However, the .pdb file is entirely separate from the assembly, is of no concern to the JIT compiler, and has no impact on optimization. The .pdb file, if present, will have been generated by the front-end compiler (for example, the C# or VB compiler or ilasm.exe), and so the JIT compiler has no control over its presence.
In general, when you are doing a release build you will want to optimize. When debugging, you will want non-optimized code with tracking information (and a .pdb file). Whether you ask for tracking information in a release build isn't such a firm issue. The conventional wisdom would be 'no'. Personally, I'd be inclined to generate it on the grounds that if some bug later occurs on a client machine and you have trouble reproducing the bug on your system, then you're going to need all the help you can get in tracking the bug down. There's just a small chance that in a year's time you'll be extremely glad you generated tracking information. However, I strongly suggest that you don't ship .pdb files, since they contain information about your source code which for obvious confidentiality reasons you won't want to be available to clients.
The choices the JIT compiler makes are actually determined by information in the assembly itself, in particular by the presence or absence of the System.Diagnostics.DebuggableAttribute assembly-level attribute.
The Debuggable Attribute
In C# terms, the syntax for declaring this attribute is this:
[assembly: Debuggable(true, true)] DebuggableAttribute has two properties: IsTrackingEnabled and IsJITOptimizerDisabled - these respectively form the first and second parameters in the attribute's constructor. The above declaration sets both these properties to true, which means that tracking information will be generated, and optimization will be disabled - the classic debug situation. For a release build, the conventional wisdom would be to set the debugger attribute like this:
[assembly: Debuggable(false, false)] This code sets IsJITOptimizerDisabled to false, which means optimizing isn't disabled (that is, the JIT compiler will optimize). The double negative is a little unfortunate, but does at least mean that the two classic debug and release scenarios have easy to remember syntaxes.
If this attribute is not present in your assembly, then the JIT compiler will assume that it must optimize and should not generate tracking information. In other words, the classic release scenario is the default.
Although I've presented the code to illustrate the attribute syntax, in most cases you will not explicitly declare the Debuggable attribute in your source code, but instead will use compiler options to have this attribute placed in the assembly. The actual situation as far as what compilation options give what results is concerned isn't totally clear-cut, so you might find that you need to experiment a bit to get the precise results you want. I'll take the case of C# and version 1.0 of the CLR to illustrate the main points - the situation is similar in other languages.
If you compile from the command line specifying the /o+ flag (csc /o+ MyProgram.cs) to turn on optimizations, then the compiler won't add the Debuggable attribute. By default, this means you will get optimized code without tracking information. Because the compiler doesn't add the Debuggable attribute, however, you are free to define it yourself in the source code. For example, if your code contains:
[assembly:Debuggable(true, false)] and you compile with /o+, then you'll get optimized code that has tracking information in it. This is the situation that I hinted earlier I'd normally be inclined to go for.
If you compile without any options (or equivalently, specifying /o-), then the compiler will automatically insert [assembly:Debuggable(true, false)] to your assembly, resulting in code that is not optimized but also does not have tracking information - so you can't debug it. This is arguably the most useless possible scenario. Not only that, but in this case it is not possible for you to separately define the Debuggable attribute in your source code with your own preferences specified, since the compiler will just complain that this attribute isn't allowed to be present twice.
If you compile specifying the /debug flag, the compiler will generate a program database file, ProgramName.pdb, and will also insert extra IL code into the assembly that assists with debugging. This extra code may itself slow the application down considerably, quite apart from the effect of not having optimization. Not only that, but this flag appears to override any choice you might make in the /o flag, and forces the compiler to add [assembly:Debuggable(true,true)] to the assembly - so you always get an unoptimized build with tracking information - this is the sensible choice for most debugging scenarios, but it's unfortunate that you can't change this preference if for some reason you do need to. Again in this case, you'll get a compilation error if your source code contains an explicit Debuggable attribute declaration that conflicts with the one the compiler inserts.
If you are using VS.NET instead of the command line, similar principles hold, except that, short of editing your project properties, you have even less control over the compilation flags. The following table summarizes the main options you have using VS.NET:
| To achieve this: | Do this: | ||
| IL containing extra debug code, and a .pdb file | JIT optimizes | Tracking information | |
| Yes | No | Yes | Compile in debug mode |
| Yes | Any other choice | Compile in release mode, but make sure the Debug symbol is #defined (you won't get a .pdb file) | |
| No | Yes | No | Compile in release mode |
| No | Any other choice | Compile in release mode, but declare the Debuggable attribute in your source code with your choices | |
One other extra point is that you might separately have a symbol such as Debug #defined in your code, in order to conditionally compile extra source code instructions. If you do, any such symbol works independently of the compilation and optimization options we have been discussing.
In the end, as long as you are doing a conventional debug or release build, there is no problem. If you have slightly different requirements, you'll have to think carefully about how to arrange your build process.
Introducing the PerfTest Sample
I'm now going to present a short sample program that illustrates the use of the Debuggable attribute and JIT optimization. The sample uses reflection to check whether its own assembly contains the Debuggable attribute, and if so displays the results. Then it enters two loops in succession. For the first loop it accesses an int property of a class, and does some very repetitive processing on it inside the loop, using the System.DateTime class to measure how long the whole loop takes. Then it does exactly the same thing, but instead of using the property, it directly accesses the underlying field. The theory is that if you are not optimizing then going through the property should take longer, but if we are allowing the JIT compiler to optimize then it really ought to inline a simple property call, and in that case we will see the two loops taking roughly the same amount of time. We will do two things with the sample: in the first place, we will run it with and without JIT optimization, and examine the execution times to see what effect optimizing has. Secondly, we will use the cordbg debugger to hack into and examine the actual native code generated by the JIT compiler, so we can see in detail just what the JIT- compiler is doing in terms of optimizing.
So let's look at the sample. To start off with, this is the class containing the property and field that we're going to access:
class TestClass { public int x; public int X { get { return x; } set { x = value; } } }
As you can see, it's a carefully designed class, which strictly follows all the best practices about giving descriptive, meaningful names to items and never defining public fields!
Now for the loop that accesses the property. This method is defined in the same class that contains the Main() method - I've called this class EntryPoint:
static void ProfileProperty(int numIters) { TestClass test = new TestClass(); DateTime startTime, endTime; startTime = DateTime.Now; for (int i=0; i<numIters; i++) { test.X +=i; test.X /= 2; } endTime = DateTime.Now; Console.WriteLine("Using property: " + (endTime - startTime).ToString()); Console.WriteLine(test.X); }
In the ProfileProperty() method, the loop continually adds the loop counter to the property, then divides by two. Notice that I've carefully designed the loop to make sure that we have to keep explicitly accessing the property, so any inlining will have maximum impact.
The code for the field is similar apart from the obvious difference of accessing test.x instead of test.X:
static void ProfileField(int numIters) { TestClass test = new TestClass(); DateTime startTime, endTime; startTime = DateTime.Now; for (int i=0 ; i < numIters ; i++) { test.x += i; test.x /= 2; } endTime = DateTime.Now; Console.WriteLine("Using field: " + (endTime - startTime).ToString()); Console.WriteLine(test.x); } Finally, here's how we display the DebuggableAttribute and invoke the profiling loops:
static void Main(string[] args) { // Find out whether the CLR thinks optimizations // are supposed to be on or off Assembly asm = Assembly.GetExecutingAssembly(); object[] attrs = asm.GetCustomAttributes(typeof(DebuggableAttribute), false); if (attrs != null && attrs.Length >= 1) { for (int i=0; i<attrs.Length; i++) { DebuggableAttribute da = attrs[i] as DebuggableAttribute; Console.WriteLine("IsJITOptimizerDisabled: {0}", da.IsJITOptimizerDisabled ); Console.WriteLine("IsJITTrackingEnabled: {0}", da.IsJITTrackingEnabled); } } else Console.WriteLine("DebuggableAttribute not present."); int numIters = 100000000; ProfileProperty(numIters); ProfileField(numIters); ProfileProperty(numIters); ProfileField(numIters); }
You may wonder why I've called each loop twice. It just provides an extra check on the results, and also eliminates any effects due to the time the JIT compiler takes to compile the code the first time round each loop. I don't seriously believe the JIT-compile time is going to be of any significance for such a small piece of code and a loop that iterates one hundred million times, but if I don't double-check, I can guarantee someone will come back to me saying 'your test isn't valid because of the JIT compile time'.
Now for the results. Firstly, if we do a non-optimizing compile:
C:\AdvDotNet\Performance>csc perftest.cs /o- Microsoft (R) Visual C# .NET Compiler version 7.00.9466 for Microsoft (R) .NET Framework version 1.0.3705 Copyright (C) Microsoft Corporation 2001. All rights reserved. C:\AdvDotNet\Performance>perftest IsJITOptimizerDisabled: True IsJITTrackingEnabled: False Using property: 00:00:01.0815552 99999998 Using field: 00:00:00.9814112 99999998 Using property: 00:00:01.1015840 99999998 Using field: 00:00:00.9713968 99999998
This shows the presence of the Debuggable attribute, and we can clearly see that the code does take longer when we are using the property, as expected. Now we'll do the same thing, but enabling JIT optimizations, and not changing anything else.
C:\AdvDotNet\Performance>csc /o+ perftest.cs Microsoft (R) Visual C# .NET Compiler version 7.00.9466 for Microsoft (R) .NET Framework version 1.0.3705 Copyright (C) Microsoft Corporation 2001. All rights reserved. C:\AdvDotNet\Performance>perftest DebuggableAttribute not present. Using property: 00:00:00.9413536 99999998 Using field: 00:00:00.9814112 99999998 Using property: 00:00:00.9413536 99999998 Using field: 00:00:00.9713968 99999998
These results show that the time using the field has not changed, but amazingly, the time to access the property has not only improved, but is now even better than the time using the field!
What does this prove? Firstly, I should point out that performance results can be hard to reproduce exactly. The above results are very typical of quite a few runs on my machine (an Athlon single-processor machine), but you may find you get different results on your machine. While I was looking at performance I ran not only the perftest sample but also various variants of it quite a lot of times. The results definitely show that JIT optimizing does have some beneficial effect, though it tends to be of the order of percentage points - you're not talking about doubling the speed or anything dramatic like that. Remember too that I've carefully engineered this sample to emphasize the effects of inlining a single property - it's unlikely that real production code would have such an obvious example for optimization which would have such a significant effect on the entire program; in that context the apparent performance improvements shown here don't look overly great. Of course, one small sample is not necessarily characteristic of a larger, 'real' application, and optimizing is a pretty rough science that is full of unpredictable results.
There is still the puzzle of why accessing via the property appeared to be faster than via the field with optimization: on the face of it, this makes no sense. I'm going to show you the native executable code that generated the above results next, and we will see then that the generated native code is slightly different for accessing via a property, even when optimized. The differences we'll see don't really account for the speed difference - the property accessor code actually looks marginally slower when looking at the raw executable instructions. However, it's possible that a small program like this could be affected by byte alignment issues on the actual hardware (which would not be so important on a larger application, since any such effects would be more likely to average out over the entire program). This does, however, confirm how low-level optimizations can easily be swamped by other effects.
Examining Native Code
We'll now have a look at the actual native executable instructions generated by the JIT compiler for the perftest sample. We'll do this by running the sample in a debugger, setting breakpoints in the ProfileProperty() and ProfileField() methods, and examining the surrounding native code. In order to do this, however, we need a .pdb file, otherwise we won't be able to use the source code to set breakpoints. That looks at first sight like an insuperable problem, since we saw earlier that generating a .pdb file in C# will automatically disable optimizations - and we specifically want to examine optimized code. Fortunately, the cordbg command-line debugger can come to our rescue here. cordbg has the ability to control the JIT settings, and can instruct the JIT compiler to generate optimized code irrespective of what the assembly attributes placed in the assembly by the C# compiler might be. This means we can debug at a source-code level, but still be running optimized code.
It is of course possible to use VS.NET to examine the native executable code, and using the techniques I discussed in , we can even match native executable statements to IL statements, but I'm going to stick with cordbg here just to make absolutely certain the native code is fully optimized.
To examine the optimized version of perftest. exe, compile the code at the command line, specifying the /debug flag to ensure that a program database .pdb file is generated. I've also specified /o+ on the basis that it can't do any harm and just in case this does make any difference to the assembly:
csc /o+ /debug+ perftest.cs
Then we run cordbg, and issue the command mode j it 1; this tells cordbg to allow JIT optimizations (overriding any settings placed in the file when the source code was compiled):
C:\AdvDotNet\Performance\PerfTest>cordbg perftest Microsoft (R) Common Language Runtime Test Debugger Shell Version 1.0.3705. Copyright (C) Microsoft Corporation 1998-2001. All rights reserved. (cordbg) run perftest Process 4036/0xfc4 created. Warning: couldn't load symbols for c:\windows\microsoft.net\framework\v1.0. mscorlib.dll [thread 0x79c] Thread created. 015: Assembly asm = Assembly.GetExecutingAssembly(); (cordbg) mode jit 1 JIT's will produce optimized code
Now you are ready to set breakpoints and examine the code (note that the instruction dis is the instruction you need to type in at the cordbg command prompt to show the disassembled native code).
To keep things as simple as possible, I'm only going to show the code for the actual loop that occupies the time. In other words, the loop in the ProfileFields() method that is highlighted below:
static void ProfileProperty(int numIters) { TestClass test = new TestClass(); DateTime startTime, endTime; startTime = DateTime.Now; for (int i=0 ; i < numIters ; i++) { test.x += i; test.x /= 2; } Now, although this is an advanced book, I'm not assuming that you're familiar with native assembly code. However, native assembly isn't that different from disassembled IL code, so I've presented the native code here, but with enough explanation that you should be able to see what's going on.
To make things as simple as possible, the native code for this method (with JIT optimizations) is presented in a table - I've added comments with brief explanations of the instructions:
| Instruction | Effect |
|---|---|
|
[002e] xor ecx,ecx | i = 0; |
|
[0030] cmp edi, 0 | Check if numIters <= 0. If so, jump out to next instruction following loop. |
|
[0033] jle 00000017 | |
|
[0035] add dword ptr [esi+4], ecx | test.x += i; |
|
[0038] mov eax, dword ptr[esi+4] | Copy test.x into the EAX register |
|
[003b] sar eax, 1 | Divide register contents by 2 |
|
[003d] jns 00000005 | |
|
[003f] adc eax, 0 |
|
|
[0042] mov dword ptr[esi+4],eax | Store result back in test.x |
|
[0045] inc ecx | ++i; |
|
[0046] cmp ecx, edi | Check if i < numIters. If that's the case, jump back to the start of the loop (the add instruction) |
|
[0048] jl FFFFFFED |
Bear in mind that the JIT compiler will emit different code on different hardware. The above code is what I obtained on my Athlon machine - but don't necessarily expect the same results on your computer.
The hexadecimal number in the square brackets that precedes each instruction is simply the relative offset of that instruction in the procedure (yes, even native executable has the concept of procedures that you call and return from, although native procedures are rather more primitive than their IL or high-level language equivalents). The actual instruction consists of the instruction itself (represented by a mnemonic, just as in IL assembly), possibly followed by one or two operands. Where there are two operands, the first one is always the destination, the second is always the source. The operand might be a constant hex number, or the name of a register. If the operand appears in square brackets, then it means the operand is a pointer to be de-referenced. A couple of examples from the above code should make all this clearer. Firstly, let's look at the instruction:
xor ecx,ecx Now xor is the instruction to perform a bitwise exclusive OR operation. It will take the destination and source (the two operands), XOR them together, and store the results in the first operand (the destination). The above instruction has the same destination and source: both operands are indicated to be the contents of a register known as the ECX register. Using the same operand twice might look odd but is actually a clever trick to zero out a register. If you XOR any number with itself, the result is always zero. So the effect of the above instruction is to store zero in the ECX register. ECX is the location that happens to be used to store the variable i, so this instruction is the assembly equivalent of i=0; (This is an example of the JIT optimization of using registers to store local variables in action.)
As another example, look at that first add instruction:
add dword ptr[esi+4],ecx You won't be surprised to learn that add takes the two operands, adds them together, and stores the result in the first (destination) operand. Understanding the second operand is easy - it's the ECX register, corresponding to the variable i. The first operand is in brackets, so it's an address to be de-referenced. It actually turns out to be the field test.x. The variable test, like i, is stored in a register - in this case a register called ESI. However, test itself is just an object reference. Now recall from Chapter 2 that the address stored in an object reference is actually the address of the method table of the object. The first actual field of the object is stored four bytes (one word) further on. dword ptr[esi + 4] identifies this field, since it takes the contents of ESI, adds four to it, then de-references the resultant address in memory. So the add instruction adds the contents of ECX to the value stored at that location in memory, then stores the result back to that same memory location. Amazingly, we have the complete encoding of the C# statement test.x += i; into one single native executable instruction! This feat is even more impressive when you consider that this operation will have been represented in IL by several instructions. This kind of efficiency should hopefully start to give you an idea of the potential capabilities of the JIT compiler.
Now let's run through the code for the loop. I've already indicated that, of the local variables, i is stored in register ECX and the test reference in register ESI. We also need to be aware that the argument numIters is stored in a register called EDI. (Note that there is nothing magic about this choice of registers - it simply happens to be the registers the JIT compiler chose for this particular code.) After initializing i to zero, the code examines numIters to see if it is less than or equal to zero. If that's the case, the loop shouldn't get executed at all. You normally think of a for loop as having the condition for continuing the loop at the start of each iteration. The code generated by the JIT compiler works a bit differently: it places the test at the end of each iteration, with an additional test before we first enter the loop to see if the loop should be executed at all.
Assuming we are in the loop, we first execute that add instruction to add i onto test.x. Then we need to divide test.x by two. The code for the division is more complex - and the actual division is performed on an in-register copy of the data. The test.x value is first copied into a register called the EAX register (that's the mov instruction). Instead of dividing by 2, the JIT compiler has gone for right-shifting the value (that's the sar instruction). However, sar may in principle introduce an error if a one got shifted into the high value bit of the register. The following jns and adc instructions check for this and correct if necessary. Presumably the reasoning here is that right-shifting is faster than doing a full division, even after checking for errors. Finally, the new contents of EAX are copied back into the memory location that holds the test.x field.
Finally, we need to test to see if we need to go around the loop again. We increment i (or ECX, depending how you look at it), test whether the result is less than numIters, and if it is, jump back to the start of the loop.
So that's the loop for the field. Now let's see what happens when we have to deal with a property. In other words, what does the JIT compiler generate that corresponds to this C# code?
for (int i=0; i<numIters; i++) { test.X += i; test.X /= 2; } In fact, despite the optimizations, the code generated on my machine is not identical to that for the field access. Examining the native code shows that the calls to the X property have indeed been optimized into straight field accessors, but there are a couple of minor differences in how the registers are used (though these differences are unlikely to significantly impact execution times). Here's the optimized native code for the above loop. The instructions that are different from those in the previous loop are shown highlighted:
[002f] xor edx,edx [0031] cmp edi,0 [0034] jle 0000001C [0036] mov eax,dword ptr[esi+4] [0039] add eax,edx [003b] mov dword ptr[esi+4],eax [003e] mov eax,dword ptr[esi+4] [0041] sar eax,1 [0043] jns 00000005 [0045] adc eax,0 [0048] mov dword ptr[esi+4],eax [004b] inc edx [004c] cmp edx,edi [004e] jl FFFFFFE8
Some of the changes compared to the previous code represent the relatively trivial facts that i is now stored in register EDX rather than ECX, and that the relative offsets in the jle and j1 branch instructions are different because the number of bytes occupied by the instructions in the new loop is slightly greater. The significant difference is in the treatment of the test.x field. For a start, instead of adding i to this field in memory, the field is first copied into the EAX register (the first mov instruction), where the contents of EDX (= i) are added to it. The result is immediately copied back to test.x in the following mov instruction - rather senselessly in this case, since the value will get overwritten again a couple of instructions further on. Even more senselessly, this same value is then copied back from test.x into the EAX register again! After that, the code carries on as for the ProfileField() method.
So what can we learn from this? Well, evidently, the JIT compiler has optimized the property accessor away, but in the process it's missed a couple of other possible optimizations to do with copying data around. Hopefully future versions of the JIT compiler will improve on that performance, but in the meantime it is clear that code does get optimized to a reasonable extent.
Finally, just for comparison, here is the native code for the same for loop, in the ProfileProperty() method, but with JIT optimizations switched off:
[004c] mov dword ptr[ebp-1Ch], 0 [0053] nop [0054] jmp 00000045 [0056] mov edi,ebx (This is where we jump back to) [0058] mov ecx,ebx [005a] cmp dword ptr[ecx],ecx [005c] call dword ptr ds:[003F5298h] [0062] mov esi,eax [0064] mov edx,dword ptr[ebp-1Ch) [0067] add esi,edx [0069] mov edx,esi [006b] mov ecx,edi [006d] cmp dword ptr[ecx],ecx [006f] call dword ptr ds:[003F529Ch] [0075] mov esi,ebx [0077] mov ecx,ebx [0079] cmp dword ptr[ecx],ecx [007b] call dword ptr ds:[003F5298h] [0081] mov edi,eax [0083] sar edi, 1 [0085] jns 00000005 [0087] adc edi,0 [008a] mov edx,edi [008c] mov ecx,esi [008e] cmp dword ptr[ecx],ecx [0090] call dword ptr ds:[003F529Ch] [0096] inc dword ptr[ebp-1Ch] [0099] mov eax,dword ptr[ebp-1Ch] [009c] cmp eax,dword ptr[ebp-4] [009f] jl FFFFFFB7
I'm not going to go over this code in detail, but you can see that not only is it a lot longer, but that the four call statements (instructions 005c, 006f, 007b, and 0090) which invoke the test.X property are clearly visible. Two of these calls invoke the get accessor, and the other two invoke the set accessor. Clearly you can pay a heavy price for not optimizing!
I haven't shown the native assembly code for the loop in ProfileField() without optimizations, since it's virtually identical to the code with optimizations.
EAN: 2147483647
Pages: 124