Advanced Breakpoints and How to Use Them
| Setting a breakpoint on a source line in the Visual Studio debugger is simple. Just load the source file, put the cursor on the line you want to stop on, and then press the default breakpoint key, F9. Alternatively, you can click in the left margin next to the line. Setting a breakpoint on a source line this way is called setting a location breakpoint.When the code for such a line executes, the debugger will stop at that location. The ease of setting a location breakpoint belies its importance; the location breakpoint on a specific source code line is what separates the modern age of debugging from the debugging dark ages. In the early days of computing, breakpoints simply didn't exist. Your only "strategy" for finding a bug was to run your program until it crashed and then look for the problem by wading through page after page of hexadecimal core-dump printouts of the state of memory. The only debuggers in the debugging dark ages were trace statements and faith. In the renaissance age of debugging, made possible by the introduction of higher-level languages, developers could set breakpoints but had to debug only at the assembly-language level. The higher-level languages still had no provisions for viewing local variables or seeing a program in source form. As the languages evolved into more sophisticated tools, the modern debugging age began, and developers were able to set a breakpoint on a line of source code and see their variables in a display that interpreted the variables' values into the exact types they specified. This simple location breakpoint is still extremely powerful, and by using just it alone, my guess is that you can solve 99.46 percent of your debugging problems. However wonderful, though, location breakpoints can get tedious very quickly. What would happen if you set the breakpoint on a line inside a for loop that executed from 1 through 10,000, and the bug turned up on the 10,000th iteration? Not only would you wear your index finger down to a nub from pressing the F5 key assigned to the Go command, but you would also spend hours waiting to get to the iteration that produced the bug. Wouldn't it be nice if there were some way to tell the debugger that you want the breakpoint to execute 9,999 times before stopping? Fortunately, there is a way: welcome to the realm of advanced breakpoints. In essence, advanced breakpoints allow you to program some smarts into breakpoints, letting the debugger handle the menial chores involved in tracking down bugs and minimizing the time and effort you have to spend in the debugger. A couple of conditions you can add with advanced breakpoints are having the breakpoint skip for a certain count and break when an expression is true. The advanced breakpoint capabilities have finally moved debuggers solidly into the modern age, allowing developers to do in minutes what used to take hours with simple location breakpoints. Developers coming from a native C++ background invariably ask if they can still set data breakpoints in .NET. Unfortunately, data breakpoints are a native-only feature. Data breakpoints work by using the CPU debug registers to tell the CPU to watch a physical address and when that address comes on the memory bus, trigger a single step exception. Although technically you could still write code to put the address of a .NET object into the debug register, the fact that we are now working with a garbage-collected system means that the address where you think the object resides will move when the heap is compacted. Thus, the debug register would still trigger, but you'd be looking at a completely different address if you stopped in the debugger. In native C++, we needed data breakpoints because there was no protection stopping you from reaching out and writing to any memory address randomly, which is also known as a wild write. With .NET, we have the memory protection, so there is no possibility of a .NET code doing a wild write into other objects. When developers are asking for data breakpoints in .NET, they are really asking to know when a field is changing. If you have public fields in your class, which is a horrible practice, there's no way for you to find those changes other than searching for all accesses of that field across all your source code and setting a location breakpoint. If you have a property setter on your field, you could set a location breakpoint on the property, and you'll know all the accesses. When it comes to fields, you should never access them directly even inside your class; you should always go through the accessor just to know when they are being changed. If you have several fields that you want to watch, it can get tedious to manually set breakpoints on all of them. Part of the Wintellect.VSMacros file, included with the book's source code, is a module, BreakPointHelper, which contains SetBreakpointsOnDocMethods. That will run through the active document and set a breakpoint on the entry point of each method. What's nice about the macro is that it uses the Breakpoint object's Tag property to identify the breakpoints set by the macro. If you want to clear the breakpoints with RemoveBreakpointsOnDocMethods, only those breakpoints set with SetBreakpointsOnDocMethods are cleared, so your other breakpoints are not lost. Since .vsmacro files are binary files, you'll have to load it into your copy of Visual Studio by going to the Tools menu, pointing to Macros, and then selecting Macro Explorer to bring up the Macro Explorer window. Right-click the Macros parent node and select Load Macro Project to load .\Macros\Wintellect.vsmacros. Breakpoint TipsBefore we jump into advanced breakpoints, I just want to quickly mention four things you might not have been aware of when setting breakpoints. The first is that when setting advanced breakpoints, before you set them, it's always best if you start debugging with a single-step command. When you aren't debugging, the debugger uses Microsoft IntelliSense to set advanced breakpoints. However, when you start debugging, you also get the actual Program Database (PDB) debugging symbols in addition to the IntelliSense to help set your breakpoints. As you've probably realized with .NET, having completely self-describing objects in the assembly itself means that the debugger uses that metadata to find the type information about an object. Type data used to make up the bulk of the data in the native binary's PDB files, but simply disappears in .NET; which is the reason why .NET PDB files are so much smaller. In a .NET PDB file, the two main pieces of data are the source and line information (so you can do the single-step debugging) and the names of the local variables. One recommendation I have is that you should ensure that your Breakpoints windowthe view that shows which breakpoints are setisn't docked. Sometimes when you're setting breakpoints, Visual Studio will set them, and you'll wonder why they aren't triggered. By having the Breakpoints window as a full-fledged window, you'll be able to find it among all the other thousands of dockable windows in the Visual Studio IDE. I don't know about you, but running Visual Studio makes me long for a dual 35-inch monitor setup. To view the Breakpoints window, press Ctrl+Alt+B with the default keyboard mappings. Right-click the Breakpoints window title bar, or tab and select Tabbed Document on the shortcut menu. You'll need to do this for both the normal editing mode and the debugging mode. Once you have the Breakpoint window set as a full-fledged window, drag its tab over to the first position so that you can always find it. The Breakpoints window shows various glyphs that indicate whether the breakpoint was set. Table 5-1 shows all the codes you'll see. Unlike Visual Studio .NET 2003, which featured only flat red circles to indicate breakpoints, Visual Studio 2005 now shows new and improved three-dimensional spheres! That's certainly one of the key reasons for upgrading. Additionally, Visual Studio 2005 introduces tracepoints, which are really breakpoints with additional capabilities. Tracepoints are shown as three-dimensional diamonds. I'll discuss tracepoints in depth in the "Tracepoints" section later in this chapter.
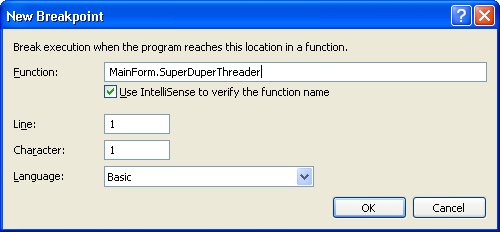
The Warning breakpoint/tracepoint, the empty circle or triangle with the yellow warning sign, needs some extra explanation. In your normal debugging, you'll see the Warning glyph when you set a location breakpoint in a source file whose module has not been loaded yet, so the breakpoint is in essence an unresolved breakpoint. Since I recommend that you start debugging before you set advanced breakpoints, if you see the Warning glyph in the Breakpoints window, you have a sign that the breakpoint wasn't set correctly. Although you might never have realized it, you can set breakpoints in the Call Stack window except when doing SQL debugging. This capability is extremely helpful when trying to get stopped on recursion or deeply nested stacks. All you need to do is highlight the call you want to stop on and either press F9 or right-click on the line and select Insert Breakpoint from the shortcut menu. Even nicer, just as with margin breakpoints, you can right-click any breakpoint in the Call Stack window to enable, disable, or set the properties of that breakpoint. Another much-underused feature for setting breakpoints is the Run To Cursor option for setting one-shot breakpoints. You can set them in source edit windows by right-clicking on the line and selecting the Run To Cursor option from the menu, which is available both when debugging and editing, and which will start debugging. For the default keyboard layout, pressing Ctrl+F10 will do the same thing. As with breakpoints, right-clicking in the magical Call Stack window opens the shortcut menu, which also has a Run To Cursor command. If you hit a breakpoint before execution takes place on the Run To Cursor line, the debugger stops on that breakpoint and discards your Run To Cursor one-shot breakpoint. Finally, subexpression breakpoints are supported in managed code. For example, if you have this expression for ( int i = 0 , m = 0 ; i < 10 ; i++ , m-- ) { }when you are debugging, and you click in the margin next to the line, the red highlight extends only on the i = 0, m = 0 or on the initializer's portion of the expression. If you wanted to stop on the iterator's subexpression (in which the increment and decrement take place), place the cursor anywhere in the i++, m-- portion of the statement, and press F9. In this statement, you can have up to three breakpoints on the line. You can differentiate them in the Breakpoints window because each will indicate the line and character position. There will be only a single red dot in the margin indicating the breakpoints. To clear all breakpoints at once, click the red dot in the left margin. Quickly Breaking on Any FunctionThe starting point for any advanced breakpoint is the New Breakpoint dialog box, which is accessible by pressing Ctrl+B in the default keyboard mapping. In many ways, the New Breakpoint dialog box is simply a front end to the IntelliSense system. IntelliSense is extremely helpful for writing your code, but it's also used to help set breakpoints. If you clear the Use IntelliSense To Verify The Function Name check box in the New Breakpoint dialog box, you'll be relying on the PDB file to set the breakpoint, which has only a portion of the information you need. Finally, you'll get only IntelliSense breakpoints if you have a project with source code open. By using IntelliSense, you get a very powerful breakpoint-setting feature that can save you a tremendous amount of time. In the midst of my debugging battles, if I know the name of the class and method I want to break on, I can type it directly into the Function edit control in the New Breakpoint dialog box. The Line and Character fields in the New Breakpoint dialog box seem to indicate that you can specify spots inside the function, but if you try any values in those fields other than 1, you'll get the ever-helpful error: "The breakpoint cannot be set. Function breakpoints are only supported on the first line." The last field in the New Breakpoint dialog box is the language list. If you have a monolingual project, it will default to the appropriate language. If your project is multilingual, select the language for the class and method you want to set the breakpoint in. I've looked over the shoulder of countless developers who know the name of the method but spend 20 minutes wandering all over the project opening files just so they can move the cursor to the line and press F9. An additional benefit of setting breakpoints by using the New Breakpoint dialog box is that the Breakpoints window, which shows the breakpoints you have set, shows the fully qualified name of the method in the Name column. Setting a margin breakpoint will show the source file and line number, which isn't nearly as descriptive. When dealing with lots of breakpoints spread out across a large application, seeing the fully qualified name is extremely helpful. Numerous things can happen when you try to set a breakpoint on a function by using the Breakpoint dialog box. I want to go through the possible outcomes you'll see and explain how to work around any problems you might encounter. What you might want to do so that you can see the outcomes yourself is open up one of your projects and try to set a few breakpoints with the New Breakpoint dialog box as I go through this discussion. The first case of quickly setting a breakpoint that I'll discuss is when you want to set the breakpoint on a class and method. For example, I have a Visual Basic class named MainForm with a method named SuperDuperThreader. When I open the New Breakpoint dialog box by pressing Ctrl+B, all I have to type in is mainform.superduperthreader (remember that Visual Basic is a case-insensitive language) and click OK. Figure 5-1 shows the filled-out Breakpoint dialog box using the Visual Basic example. If you aren't currently debugging when you set the breakpoint, the breakpoint dot appears in the margin, but the red highlight doesn't appear on the Public Sub SuperDuperThreader because the breakpoint still must be resolved. Once you start debugging, Public Sub SuperDuperThreader is highlighted in red. If you're currently debugging, the breakpoint will be fully resolved by showing a filled-in red dot in the Breakpoints window, and you'll see that the Public Sub SuperDuperThreader is highlighted in red. Figure 5-1. Breakpoint dialog box about to set a quick breakpoint on a function
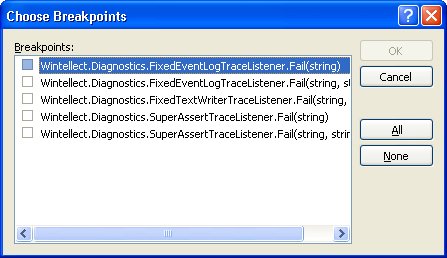
If the class and method name you specify in the Breakpoint dialog box is incorrect, you'll see a message box that says, "IntelliSense could not find the specified location. Do you still want to set the breakpoint?" If you go ahead and set the breakpoint on the nonexistent method, the Breakpoints window shows one of two glyphs because of a bug. If you are already debugging and you set a breakpoint on an invalid location, the breakpoint glyph is incorrectly set to the red circle. However, if you see the invalid breakpoint before you start debugging, the yellow glyph is properly shown in the Breakpoints window because the breakpoint can't be resolved. Because setting a breakpoint by specifying the class and method works well, I had to experiment with attempting to set a breakpoint in the Breakpoint dialog box by just specifying the method name. If the method name is unique in the application, the debugger will set a breakpoint on the method just as if you typed in the complete class and method. Since setting a breakpoint with just the method name works quite well and will save you time debugging, you might be wondering what would happen if you had a large project and you wanted to set a breakpoint on a common method name or an overloaded method. For example, suppose you have the Wintellect.Diagnostics solution open and you want to set a breakpoint on the Fail method used anywhere in the solution. If you type Fail in the Breakpoint dialog box and click OK, something wonderfully interesting happens and is shown in Figure 5-2. Figure 5-2. The Choose Breakpoints dialog box
What you see in Figure 5-2 is the IntelliSense listing from all classes in the Wintellect.Diagnostics project that have Fail as a method. I don't know about you, but I think this is an outstanding featureespecially because you can see that clicking the All button allows you to set breakpoints on all those methods all at once! The Choose Breakpoints dialog box also appears for overloaded methods in the same class. I don't know how many times I've gone to set a breakpoint and the Choose Breakpoints dialog box reminded me that I should consider stopping on other methods also. If you know the parameter types or names of the overloaded method, you can type those also in the New Breakpoints dialog box to skip the Choose Breakpoints dialog box entirely. For example, the Wintellect.Windows.Forms.GlobalMessageBox class has six overloaded Show methods. If I wanted to set the breakpoint only on the method that takes types of a Control and two Strings as parameters, I'd type Show(Control,String,String) to set the one breakpoint I wanted. If I wanted to use parameter names, for the Show overloaded method whose parameter names are control and text, I'd type Show(control,text) to enable that breakpoint. Of course, as soon as I saw that the Choose Breakpoints dialog box appeared on overloaded methods, I set about trying to find if I could get it to show me all the methods in the class. No matter what I've tried, the New Breakpoint dialog box won't show all the methods in the class for managed code. Interestingly, it will for native C++ code if you type in classname::*. Given that all the IntelliSense information is available to add-ins, if you're looking for a fun project, you should write that add-in. I'm simply amazed that the ability to select from multiple methods in your application when setting a breakpoint in the debugger isn't pointed out in big, bold type as a killer feature of Visual Studio. In fact, there's only a passing reference to the Choose Breakpoints dialog box in the MSDN documentation. We all owe the debugger team a big thanks for this feature. If you're debugging when you want to set a quick breakpoint, things get a little more interesting than what I've already discussed because there is some very interesting power in the New Breakpoint dialog box. During a brain cramp one day while debugging, I typed in the name of a class and method in the Microsoft .NET Framework class library instead of the class and method from my project, and a whole bunch of really weird-looking breakpoints popped up in the Breakpoints window. Let's say that I have a C# console application that calls Console.WriteLine, and while debugging, you type Console.WriteLine into the Breakpoint dialog box. You'll get the usual message about IntelliSense not knowing what to do. If you click Yes and go to your Breakpoints window, you'll see something that looks like Figure 5-3. (You might have to expand the top tree node, and you'll need to have Just My Code turned off as I described at the beginning of the chapter.) Figure 5-3. Child breakpoints in the Breakpoints window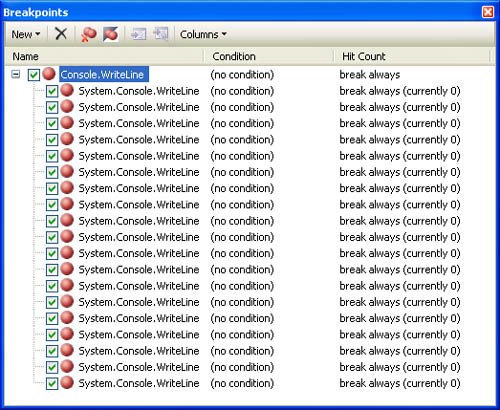 What you're looking at in Figure 5-3 are child breakpoints. Basically, the Visual Studio documentation says that they exist and that's it. For example, the documentation says child breakpoints occur when you set breakpoints on overloaded functions, because they'll show you the method name at the root level, and the child elements refer to the specific locations. You can also see child breakpoints when you're debugging multiple executables, both programs load the same control into their AppDomain/address spaces, and you set breakpoints in the same spot in that control in both programs. What's wild is that the Breakpoints window in Figure 5-3 is showing you a single program that's currently running in which I set a breakpoint on Console.WriteLine. If you right-click a child breakpoint while debugging and select Go To Disassembly, the Disassembly window displays the disassembly code. However, you'll get a clue as to what's happening if in the Breakpoints window you add the Address column to the display by selecting it from the Columns button. Figure 5-4 shows that all but one of the child breakpoints is set on the first instruction of Console.WriteLine. The screen shot in Figure 5-4 is from Windows XP Professional x64 Edition, and if you try the same breakpoint on a 32-bit operating system, the offsets will be different. I haven't found the pattern as to why the offsets are different values for some methods. Figure 5-4. Breakpoint on any call to Console.WriteLine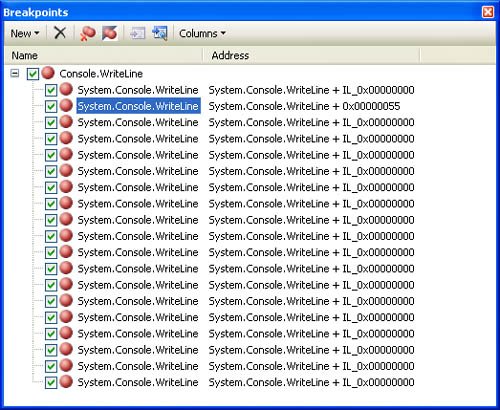 If that's not clear enough, you can always execute your program and notice that you stop deep down in the assembly language. If you pull up the Call Stack window, you'll see that you're stopped inside a call to Console.WriteLine, and you'll even see the parameter(s) passed. The beauty of this undocumented means of handling a breakpoint is that you'll always be able to get your applications stopped at a known point of execution. Although I made only a single call to Console.WriteLine in my program, the Breakpoints window shows 19 child breakpoints, as shown in Figure 5-3. Based on some trial and error, I discovered that the child breakpoints count is the number of overloaded methods. In other words, setting breakpoints by typing in the .NET Framework class and method name or typing where you don't have source code will set a breakpoint on all overloaded methods. The ability to stop on a method that's called anywhere in my AppDomain is amazingly cool. I've learned quite a bit about how the .NET Framework class library fits together by choosing to stop at specific .NET Framework class library methods. Although I've been using a static method as an example, this technique works perfectly well on instance methods in addition to properties as long as those methods or properties are called in your AppDomain. Keep in mind that to set breakpoints on a property, you'll need to prefix the property with get_ or set_, depending on what you want to break on because a property is really just a method. For example, to set a breakpoint on the Console.In property, you'd specify Console.get_In. Also, the language selected in the New Breakpoint dialog box is still important. For C# applications you can leave the language set to C#, and they work fine. For Visual Basic applications, you'll need to set the Language combo box to Unknown for this undocumented trick to work. In setting these breakpoints deep in the .NET Framework, I need to mention three final items. The first is that the development environment now saves them across debugging sessions. In prior versions of Visual Studio, you'd have to set these breakpoints each time you restarted debugging. The second is that you'll need to watch the New Breakpoint dialog box carefully after setting these breakpoints. The debugger has a tendency to clear the Use IntelliSense To Verify The Function Name check box in the New Breakpoint dialog box. The third item is that these breakpoints are per AppDomain. If my example had two AppDomains that both called Console.WriteLine, you would have seen 38 total child breakpoints. That's because each AppDomain is getting its own set of breakpoints. A .NET AppDomain is equivalent to a process, and you can have as many as you want in a single Windows EXE. Although you might think that I've beaten the topic of setting quick location breakpoints to death, there's still one completely non-obvious but extremely powerful place to set location breakpoints. Figure 5-5 shows the Find combo box on the Standard toolbar. If a source file is active in the main window and you type the name of the class and method you want to break on in that combo box and press F9, a breakpoint on that method is set if that method exists. If you specify an overloaded method, the system will automatically set breakpoints on all the overloaded methods. The Find combo box is a little more discriminating in that if it can't set the breakpoint, it won't. Figure 5-5. The Find combo box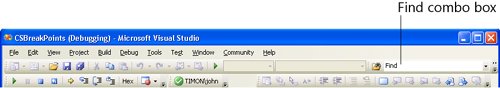 That little Find combo box has two other hidden secrets. For the default keyboard layout, if you type in the name of a project file or an include file in the INCLUDE environment variable and press Ctrl+Shift+G, the Find combo box opens the file ready for editing. Finally, if you like the Command window in Visual Studio, try this: in the Find combo box, type the greater than symbol (>), and see the window turn into a mini Command window with its own IntelliSense. With all this undocumented magic in the Find combo box, I often wonder if I could type in "Fix my bugs!" and with a magic keystroke have it do just that. Location Breakpoint ModifiersNow that you know how to set location breakpoints anywhere with aplomb, I can turn to some of the scenarios discussed in the opening section on breakpoints. The whole idea is to add some real smarts to breakpoints so that you can use the debugger even more efficiently. The vehicles for these smarts are hit counts and conditional expressions. Hit CountsThe simplest modifier applicable to location breakpoints is a hit count, also sometimes referred to as a skip count. A hit count tells the debugger that it should put the breakpoint in but not stop on it until the line of code executes a specific number of times. With this modifier, breaking inside loops at the appropriate time is trivial. Adding a hit count to a location breakpoint is easy. First, set a regular location breakpoint either on a line or a subexpression of the line. Right-click the red dot for the location breakpoint, and select Hit Count from the context menu. Alternatively, you could also select the breakpoint in the Breakpoints window and select Hit Count. No matter how you do it, you'll end up in the Breakpoint Hit Count dialog box. In the Breakpoint Hit Count dialog box, you'll see that Microsoft improved the hit-count options from previous debuggers. In the When The Breakpoint Is Hit drop-down list, you can choose how you want the hit count calculated in four different ways, as shown in Table 5-2. After choosing the evaluation you want, type the hit-count number in the edit box next to the drop-down list.
What makes hit counts so useful is that when you're stopped in the debugger, the debugger tells you how many times the breakpoint has executed. If you have a loop that's crashing or corrupting data, but you don't know which iteration is causing the problem, add a location breakpoint to a line in the loop and add a hit-count modifier that is larger than the total number of loop iterations. When your program crashes or the corruption occurs, bring up the Breakpoints window, and in the Hit Count column for that breakpoint, you'll see in parentheses the number of times that loop executed. The Breakpoints window shown in Figure 5-6 shows that the breakpoint has been hit 17 times so far. Figure 5-6. An example of remaining hit-count breakpoint expressions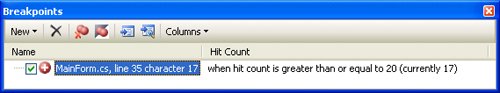 Hit counts are also fantastic when you're trying to see what's executing in an application. When we go into debugging someone else's code, we rarely have any idea of how everything fits together. What we'll do is set many breakpoints all over the application across the major subsystems and set the hit counts to 100,000. That way we can exercise the application without stopping in the debugger on one of those breakpoints. After a while, we'll break into the application and look at the execution counts. That gives you an excellent idea of which parts of the application are executing the most based on the data running through the system. When it comes to finding that needle in a haystack, hit-count modifiers can get you pointed in the right direction. Keep in mind that the remaining count works only when your program is running at full speed. Single-stepping over a breakpoint doesn't update the hit count because the single step takes precedence over a breakpoint in the debugger's internal state machine. You can reset the count back to zero at any time by right-clicking the breakpoint and selecting Hit Count from the shortcut menu. In the Breakpoint Hit Count dialog box, click the Reset button to set the execution count back to zero. One additional nice feature is that you can change the hit-count evaluation at any time or the hit-count number without changing the current hit count. Conditional ExpressionsThe second modifier for location breakpointsand the one that if used correctly saves you more time than any other type of breakpointis a conditional expression. A location breakpoint that has a conditional expression triggers only if its expression evaluates to true or changes from the last time it was evaluated. A conditional expression is a powerful weapon for gaining control exactly when you need it. The debugger can handle just about any expression you throw at it. To add a conditional expression to your breakpoint, right-click a location breakpoint and select Condition from the shortcut menu, which brings up the Breakpoint Condition dialog box. In the Condition edit box, enter the condition you want to check and click OK to set your condition. You can think of conditional modifiers like this: "What's in the parentheses of an if statement that I'd enter on the breakpoint line?" You have full access to local and global variables because they are evaluated in the context of the currently executing scope. The conditional expression breakpoint modifier is extremely powerful because it allows you to directly test the specific hypothesis that you're out to prove or disprove. The important point to remember is that the expression syntax must follow the same rules as the language in which the breakpoint is set, so remember to mind your And's and ||'s as appropriate. The default condition handling breaks into the debugger if the conditional expression you enter evaluates to true. However, if you want to break when the condition changes value, you can change the option button selection from Is True to Has Changed. One thing that can be confusing but makes sense after some thought is that the expression isn't evaluated when you enter the condition. The first time it's evaluated is when the associated location breakpoint is hit. Because the condition has never been evaluated, the debugger sees no value stored in the internal expression result field, so it saves off the value and continues execution. Thus it can possibly take two executions of that location before the debugger stops. What's extra nice about the Has Changed evaluation is that the condition you enter doesn't have to be an actual condition. You can also enter a variable that is accessible from the scope of the location breakpoint, and the debugger evaluates and stores the result of that variable so that you can stop when it changes. The expressions that the debugger can handle are quite interesting. Given the following C# source code: for ( i = 0 ; i < 20 ; i++ ) { Console.WriteLine ( "i = {0}" , i ); }What would happen if I set a breakpoint on the call to Console.WriteLine and set the conditional modifier to i=3 (notice that I used only a single equal sign instead of the double equal)? My first thought would have been that you would get an error in the Breakpoint Conditional dialog box telling you that the expression was incorrect. The expression is accepted, and when the debugger hits the location breakpoint, you'd just see i = 3 continually streaming to the console window. When I first saw this, I actually did a little victory dance around my office because I saw that the conditional modifier was doing more than calling methods; it supports full expression evaluation. Although you probably don't want to see me dancing, the fact the debugger supports full expression evaluation is very exciting because it means you can call a function from a location breakpoint conditional expression modifier. Calling functions or methods from conditional expressions opens up all sorts of excellent debugging capabilities, but as you can imagine, the side effects can make debugging almost impossible if you don't pay careful attention. In case you're wondering, the Common Language Runtime (CLR) Debugging API has this functionality built right in and fully documented. The magic is through the ICorDebugEval interface, and the technique of calling a function in the debugger is called func-eval. When I first started learning .NET, I didn't realize that this extra power in conditional expressions existed because the functionality seemed natural. For example, I was using expressions such as userName.Length == 7, thinking the debugger was reaching into the debuggee and getting the length value by reading memory directly just as it does in native debugging. After using an expression that called a more interesting property get accessor that did more work, I started experimenting to see everything I could do. Essentially, I figured out that I could make any valid calls I wanted except to Web methods. Probably the best way to show you the process of calling methods from conditional expressions is through an example. Listing 5-1 is a simple program, ConditionalBP, which has a class, TestO, which keeps track of the number of times a method is called.
Set a conditional breakpoint on Console.WriteLine in Main with the expression (x.Toggle() == true) || (x.CondTest() == 0), and think about what occurs when the breakpoint is executed. After pressing F5 for the first time, you'll stop when i equals 0. If you put z in the Watch window and expand it, you'd see that the value of the callCount field is 0 and the toggleValue field is true. That shows that the Toggle method has executed once. Since C# supports short circuit evaluation, the CondTest method was not executed. Pressing F5 again, will stop when the value if i is now 2. Looking at the fields of the x object in the Watch window, callCount is 1, and the toggleValue field is again true. What this is proving is that the methods are being called from the breakpoint. In the Condition edit box, when you type in the class and enter the period after an instance, you'll be greeted with a new surprise built into the debugger: full IntelliSense! That makes it trivial to call those methods from breakpoints because you'll see exactly what you can and can't call. The debugger team wants you to start calling methods from your conditional breakpoints, so they made it easy. Before you start slinging any property or method calls in your location breakpoint conditional expression modifiers, you should probably take a good look at what the property or method does. If it happens to copy a 3-GB database or otherwise changes state, you probably don't want to call it. What's also interesting about how the debugger evaluates the methods and properties you call is that the 20-second timeout that applies to the Watch window doesn't apply to calling methods from a conditional expression. If you have a method that happens to take days to evaluate, the debugger will merrily wait for the expression to finish. Fortunately, the Visual Studio user interface (UI) isn't frozen, so pressing Ctrl+Alt+Break or selecting Break All from the Debug menu will immediately stop the debuggee. In Visual Studio .NET 2003, the debugger had a giant bug with which if you set the conditional modifier incorrectly after you started debugging, the debugger would report the problem but would not stop at the location. The development team fixed that problem and now when you enter an invalid expression, the Breakpoint Condition dialog box warns you immediately. Also, in C#, the expression evaluator now properly evaluates null so you use it in your conditional modifier expressions. Before I leave the conditional modifier, I want to show you one of my favorite debugging tricks. Because you can call a method from a conditional modifier, that essentially gives us method injection on the fly. This is especially important because this gives you assertions on the fly. For example, Listing 5-2 shows a class with an IsNameNull method that returns true if the private field name is null.
Because the IsNameNull method returns true or false, you can use it in any location breakpoint conditional modifier in which you want to ensure that the name field is properly set. For example, you could set breakpoints class methods themselves by using the expression this.IsNameNull() as the conditional modifier. As those location breakpoints execute, you'd get checking of the currently executing instance. If you wanted to check outside the class, you'd use the specific variable name in the expression. I'm amazed at how much I rely on the debugger to do those additional assertions on the fly. TracepointsA new feature of the debugger in Visual Studio 2005 is tracepoints, which are really just another custom action on breakpoints, such as a conditional or hit-count modifier. From the name, you can guess that it has something to do with tracing. The original impetus with tracepoints was to have the option to do logging of some sort as part of a breakpoint. What confuses most developers when they want to insert a tracepoint is that there are no user interface options for setting one. All tracepoints start life as a breakpoint. Once you have your breakpoint set, right-click the red circle in the margin and select When Hit from the shortcut menu. That will bring up the When Breakpoint Is Hit dialog box, which gives you two options for action when the breakpoint triggers: printing a message and running a macro. Selecting the Continue Execution check box at the bottom of the dialog box turns your breakpoint into a tracepoint, and you'll get the fancy diamond in the margin instead of the old boring sphere. If you choose to print a message, you can print any variable value to the Output window by surrounding it in curly braces ({}). The ability to jam in that trace statement on the fly is a very welcome addition to your debugging arsenal. To make life even better, there's a set of special keywords that you can use in the trace message to get even more information. They are all listed in Table 5-3.
What I especially appreciate is that the $CALLSTACK special variable shows you the mixed native-managed stack if you have turned on both managed and native debugging in the same process, which I'll discuss how to do in the "Mixed-Mode Debugging" section later in this chapter. However, it does not show you the method parameters or their values. The one bit of frustration with the trace statement is that you are limited to a single line. There's no way you can get a carriage return or linefeed to split the trace message apart to make it easier to read. Tracing from a tracepoint was designed to handle those quick and small pieces of data you need to see during debugging. If you want to change the default message the When Breakpoint Is Hit dialog box shows, you can edit the DefaultTracepointMessage value under the HKEY_CURRENT_USER \Software\Microsoft\VisualStudio\8.0\Debugger registry key. To get better formatting from a tracepoint, you can take advantage of the second option at a tracepoint, specifying a macro to run. Because a Visual Studio macro has full access to the debugger object, you can do all the formatting you could ever want in the macro. Because I wanted to see the parameters and their values at a tracepoint, I wrote the DumpTheCallstack macro you can find in the Wintellect.VSMacros file, TracePointMacros module. It's an excellent example of the type of macro tracepoints were designed to call. When I first saw the ability to call macros from tracepoints, I was very excited because I thought that we would now be able to do seriously programmed breakpoints. For example, I once worked on a heavy parsing system on which we needed to stop only when there were at least 1,000 items on the call stack. Because nearly everything you could ever want from the debugger is exposed in the Visual Studio automation model, I would now be able to write a macro that verified that you were debugging and grabbed the current thread, and if the stack frame count was greater than 1,000, I could stop. As you start thinking about it, you can come up with many super programmable breakpoint options calling a macro can offer. For example, what about breakpoints when a file on the disk is a specific size? How about a breakpoint that will cause you to stop only when a registry key exists or has a certain value in it? The possibilities become endless and can really go a long way to doing some amazing power debugging. Sadly, macros at breakpoints don't work as expected. When I wrote my first macro to be executed at a tracepoint, I called the Debugger.Break method to have the macro stop in the debugger. When the tracepoint with my macro executed, I got a message box with the following text: "A macro called a debugger action which is not allowed while responding to an event or while being run because a breakpoint was hit." Sadly, the debugger does not support stopping from a macro directly, which bothered me because I think being able to stop from a macro is a highly valuable feature. My next attempt was in the When Breakpoint Is Hit dialog box. I cleared Continue Execution and rewrote my macro to call Debugger.Go when my condition was not met. I figured that although it was an extra step, at least I'd get my super-programmable breakpoints. Alas, calling Debugger.Go triggers the same annoying message, so that plan didn't work either. I was stumped trying to figure this out and was swapping mail with Shahar Prish, a developer on the Microsoft Office Excel Server team whose blog is at http://blogs.msdn.com/cumgranosalis/default.aspx, in which we were lamenting that this feature didn't work the way anyone wanted. Shahar kept fiddling around and came up with an excellent workaround. There seems to be an issue from having the macro control the debugger from the thread the debugger is running on. Shahar's trick is to have the macro continue execution by calling Debugger.Go on another thread. Of course, this trick may break in the next release of the debugger, but at least it lets us use more powerful breakpoints today. In the When Breakpoint Is Hit dialog box, you'll clear Continue Execution so the debugger thinks it's going to stop. In the Run a macro list, you'll select your macro as normal. Inside your macro is where you'll take advantage of Shahar's workaround. The following code shows a macro, StopOnCallstackBiggerThanFive, that will continue execution by calling DeferredContinueExecution if the stack has fewer than five items in it. The magic is using a ThreadPool thread to do the work of continuing execution. All of this code is in the Wintellect.VSMacros file TracePointMacros module, so you can try it out. ' Shahar Prish's cool trick Private Sub DeferredContinueExecution() ThreadPool.QueueUserWorkItem(New _ Threading.WaitCallback(AddressOf ContinueExecution)) End Sub Private Sub ContinueExecution(ByVal o As Object) DTE.Debugger.Go() End Sub Public Sub StopOnCallstackBiggerThanFive() Dim dbg As EnvDTE.Debugger = DTE.Debugger If (dbg.CurrentProgram IsNot Nothing) Then Dim thread As EnvDTE.Thread = dbg.CurrentThread If (thread.StackFrames.Count <= 5) Then DeferredContinueExecution() End If End If End Sub FiltersThe last breakpoint modifier I want to discuss is the new Filter modifier. In prior versions of Visual Studio, setting a per-thread breakpoint was an adventure. The only way to do it in .NET code was to either remember to set the thread name in your code or rely on a private variable called DONT_USE_InternalThread on the thread. Neither trick allows you to set that per-thread breakpoint on something as simple as the thread ID as listed in the Thread window. The idea behind filter breakpoint modifiers is that in today's multithreaded machine world, you need a consistent way to easily set a breakpoint on a specific thread, process, or machine. After you've set the location breakpoint, right-click the red dot and select Filter to get to the Breakpoint Filter dialog box. As you'll see in the dialog box, you can set a conditional style breakpoint by using machines, threads, and processes. Although it's not mentioned in the dialog box, the C# == operator is fully supported. |
EAN: 2147483647
Pages: 99