Process- and Infrastructure-Related Questions
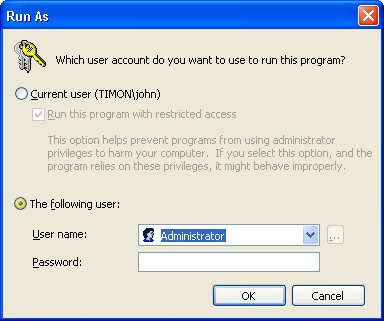
| Many questions I've gotten are about debugging and process-related issues. Although I've done my best to make Chapter 1, "Bugs: Where They Come From and How You Solve Them," and Chapter 2, "Preparing for Debugging," which discussed those issues, as complete as possible, I still get many questions about those issues. Additionally, some common questions are even about the nature of using computers. Why must you always develop as a non-admin?If you are logging on to your computer using an account with administrator privileges, you need to raise your right hand and repeat after me: "I do solemnly swear that by the time I get to the end of this question's answer, I will put this book down and immediately correct the situation. Additionally, I will make all my coworkers do the same." There is absolutely no reason at all for logging in with administrator rights to develop software! The only time you need to use an account with administrator rights is if you are debugging across user accounts. Fortunately, it's easy to start individual processes with greater rights so you can do the debugging. One of the most important features of Microsoft Windows Vista is User Account Control (UAC), which defaults users to less privileged accounts and prompts for required credentials whenever a process tries to do something that needs higher privileges. Even with the release of Windows Vista imminent, we will realistically be developing on and using Microsoft Windows XP and Microsoft Windows Server 2003 for many years before we have most of our development teams using the new operating system. That doesn't even consider the end-user or corporate-user scenario, which will take even longer to migrate over. The most important reason you need to be developing without administrator rights, in other words using a limited user account, is to ensure that your application works correctly on a less privileged account. As someone who's been developing as a limited user for years, it's hugely frustrating to run an application and see it crash or have an unhandled exception because the developers assumed that everyone runs with administrator rights. This is a completely preventable bug that tells the user that the developers are lazy and certainly aren't doing their job. The good news is that on Windows XP and Windows Server 2003, it's easy to find all the tricks because there's now an excellent Web site that will get you started: Jonathan Hardwick's http://nonadmin.editme.com. Many of the links and articles on the Web site point to Aaron Margosis's blog (http://blogs.msdn.com/aaron_margosis)he's done the best writing on the subject. Both Web sites are excellent and are part of your required reading. The main idea behind using your computer without administrator rights is that you'll use the Runas.exe program that comes with Windows to start particular processes as a user with administrator rights on that machine. For example, if you wanted to debug a Microsoft ASP.NET application running inside Internet Information Services (IIS), the debugger would need administrator rights to debug across the user accounts (your account to Local Service), so you would run the following command (assuming that Microsoft Visual Studio is in the path and the account you want to use is Administrator): runas /u:Administrator devenv.exe The runas command will prompt you for the Administrator account password, and after you type it, Visual Studio will start. From the new instance of Visual Studio, you can now debug the IIS-based application without exposing your whole system to viruses and spyware because you logged in as an administrator. Note that you can also use Mark Russinovich's excellent Psexec.exe program (http://www.sysinternals.com/Utilities/PsExec.html), which even allows you to start programs on other machines. The last thing I want to mention about runas is that when you start a program with it, the program is using the profile from a different user, not the logged-in user. You probably already guessed that, but I've seen people get tripped up with setting an environment variable in their logged in account and wonder why their program started with runas doesn't see the environment variable. If you're still not convinced that running with a non-administrator account is worthwhile, you should read the wonderful study done by Andrew Garcia in the magazine eWeek, "Is System Lockdown the Secret Weapon?" (http://www.eweek.com/article2/0,1759,1891447,00.asp). He took two fully patched systems, one running Microsoft Windows 2000 Professional SP4 and the other running Windows XP Professional SP2, and surfed some not-so-good Web sites using Administrator, Power User, and User accounts. After each surfing session, he ran spy-ware scans. On Windows XP, the Administrator and Power User accounts had 16 total threats! In setting up my friends' and family members' machines so they all run as a limited user, I've eliminated nearly all the spyware and virus calls I used to get. The http://nonadmin.editme.com site does a great job of getting you started, but I wanted to share some of my tips about running and developing in a limited user account to help you make the transition. The Runas program is great from the command line, but there's a hidden feature with shortcuts (.lnk files) that I like to use to automatically be prompted for the user account to run in when clicking the shortcut. After you've created the .lnk file, right-click its icon and select Properties from the shortcut menu. On the Shortcut tab, click Advanced to open the Advanced Properties dialog box. If you select the first check box, Run With Different Credentials, now whenever you double-click the shortcut, you'll be prompted with the Run As dialog box, shown in Figure 4-1, in which you can specify the user name and password to run the application. Figure 4-1. Shortcut prompt for user account
This is a very convenient way to start applications such as Visual Studio. However, there seems to be a bug in saving the shortcut, because if you change other values in the .lnk file properties, Windows Explorer randomly forgets that you selected the Run With Different Credentials check box. To work around this bug, make all the other changes to the shortcut and save those changes. Go back into the Properties dialog box for the shortcut and select the Run With Different Credentials check box as the last change. One shortcut I like to set up with Run With Different Credentials is one to a Command Prompt. If the Command Prompt is running with administrator privileges, any applications you start from it are also under the same account. If you need to run multiple items with administrator privileges, this trick is very convenient. I even change the icon for that link to be a pirate skull and bones so it appears when pressing Alt+Tab thus helping me find it quickly. When logged on with limited privileges, you sometimes need to access to Windows Explorer to set security on a directory or set up a share. To allow you to run Windows Explorer for another account, you'll first need to log on to that account and then set Windows Explorer to use separate instances. On the Tools menu, select Folder Options, click the View tab, and in the Advanced Settings box, scroll down and select the Launch Folder Windows In A Separate Process check box. It is a very good idea to enable this setting in general because each Explorer window is in a separate processif one hangs, you don't hang the desktop, the taskbar, and everything else on the machine. From your limited user account, you can now use Runas.exe or the shortcut trick I just discussed to start Windows Explorer for the account with administrator privileges. The only problem is that now you'll have trouble telling your limited account's Explorer windows from your administrator privilege account's windows. Fortunately, that's easy to fix with a bitmap and a registry key; the technique works with all Windows operating systems and CPUs. For the account with administrator privileges you want to use, set the HKEY_CURRENT_USER\Software\Microsoft\Internet Explorer\Toolbar key, BackBitmap string value to the complete file name of a bitmap file you want displayed behind the Microsoft Internet Explorer and Windows Explorer toolbars. I use a solid red 32 x32 pixel bitmap to make it completely obvious which windows have administrator privileges. There's a fairly nasty bug you're going to run into running Windows Explorer in an account with administrator privileges when logged on with limited privileges. The UI of the Explorer instance running with administrator privileges does not properly refresh. When you delete a file, it's deleted, but the UI doesn't reflect the change. Just get in the habit of pressing F5 after each operation to force the refresh. One of the greatest contributions that Aaron Margosis made in his quest to having everyone running in limited privileges accounts is a deceptively simple batch file that solves the hardest problem: temporarily grant your limited account administrator privileges. His script is called MakeMeAdmin (http://blogs.msdn.com/aaron_margosis/archive/2004/07/24/193721.aspx). Now you can log on with your domain account as a limited privilege account on your development computer, but if you need to run something that needs both network access and administrator privileges on the computer, you're in business. Using your computer as a limited user works great until you need to access something in Control Panel. You've had great luck with Runas to install applications and perform other tasks that require administrator privileges, but you'll eventually run into the wall with Control Panel. When you attempt to start Control.exe from Runas.exe, you will find that no window appears. This is incredibly frustrating and means you have to start Windows Explorer with administrator privileges and browse to My Computer\ Control Panel in Explorer's folder view so you can click the particular item you want. Fortunately, there's an easy workaround, but it appears to be undocumented. Go ahead and start Control Panel from your limited privilege account. You may have noticed that in Explorer, if you right-click an executable, one of the menu items is Run As, which brings up the same dialog box shown in Figure 4-1 so you can type the user credentials. If you right-click a Control Panel application, you see Open, but no Run As. However, if you hold down the Shift key and right-click, the elusive Run As command will appear so you can start that individual Control Panel application with different credentials! From a debugging standpoint, the only difference is if you need to debug across accounts, you'll need to start the debugger to run with administrator privileges. If you want to debug a process that's running under your limited account, you can run Visual Studio in your limited account and debug all day long. Not only is saving yourself from viruses and spyware always worthwhile, but if there's any chance that your application could be run in limited accounts, you are developing and testing the application in the same usage scenarios as those of your application's users. Now that you've read this whole question, I'll remind you of your promise to put the book down and go set up your development machines so your main account has limited privileges. Some of you might be grumbling that running as a limited user isn't worth the pain, but I hope I've proven to you that it's well worth it. You have no excuse not to do the right thing. The book will wait; your customers and users will not. What's the secret to debugging?In my consulting work, everyone asks if there is a single key to debugging better to produce great code. I'll sum up the secret in two words: code coverage. Code coverage is simply the percentage of lines (or blocks) you've executed in your module. If 100 lines are in your module and you execute 85, you have 85 percent code coverage. The simple fact is that a line not executed is a line waiting to crash. I'm to the point now at which I enter "religion mode" because I believe in code coverage so much. If you were standing in front of me right now, I'd be jumping up and down and extolling the virtues of code coverage with evangelical fervor. Many developers tell me that taking my advice and trying to get good code coverage has paid off with huge improvements in code quality. It works, and is the only secret there is. You can get code-coverage statistics in two ways. The first way is the hard way and involves using the debugger and setting a breakpoint on every single line in your module. As your module executes a line, clear the breakpoint. Continue running your code until you've cleared all the breakpoints, and you have 100 percent coverage. With .NET, there are far easier ways. If you have either Visual Studio Team Developer Edition, Visual Studio Tester Edition, or Visual Studio Team Suite Edition, you have an excellent code-coverage product built right in. Alternatively, you can use the free NCover (http://www.ncover.net). There are other tools out there, but those are the two I use. Personally, I don't check in any code to the master sources until I've executed at least 85 to 90 percent of the lines in my code. I know some of you are groaning right now. Yes, getting good code coverage can be time consuming. Sometimes you need to do far more testing than you ever considered, and it can take awhile. Getting the best coverage possible means that you need to run your application in the debugger and change data variables to execute code paths that are hard to hit though normal execution. Your job is to write solid code, however, and in my opinion, code coverage is about the only way you'll get it during the unit test phase. Granted, I don't expect developers to test on every flavor of the operating system that customers might be using. However, if engineers can get 90 percent coverage on at least one operating system, the team wins 66 percent of the battle for quality. If you're not using a code-coverage tool, you're cheating yourself on quality. When it comes to debugging, you can't debug code that isn't executing. By driving the code coverage during your unit tests to high levels, you're doing the most effective debugging possible: executing the code! What sort of development methodology should I use?A Google search for "software development methodologies" yields 82,600,000 different links (at the time I wrote this) expounding on all sorts of wild-sounding names: Adaptive Software Development, Scrum XP (Extreme Programming, not the operating system), Context Driven Testing, Test Driven Development (TDD), and many more. It gets even more confusing when you realize that there are 10 to 15 different versions of Agile development. In addition, people are extremely passionate about their chosen methodology. The last thing you want to do is get caught in the middle of a rumble between Chrystal and Scrum supporters. It's just like the Capulets and the Montagues, but without the sexy iambic pentameter. I very much like the ideas of Agile development because they've done a good bit to help focus developers on quality, and I try to use the appropriate form of Agile development on all my projects. However, like most things in software, you just can't walk in to the office one day and say, "We're going to be a Scrum shop!" What you need to do is have everyone, including upper management, do a complete dump on what went right and wrong on the last few development cycles. You can use that as a base to start your research into the pros and cons of different methodologies. You'll be looking for the one that best matches the type of development you are doing. This is a major undertaking in which you have to have absolute full support from management to do the experimenting and learning to change how your shop works. The ideal situation is to try to pilot different methodologies on smaller pieces of the development. The goal is to try to get an apples-to-apples comparison on what will work best in your development shop. I'd also strongly recommend getting real training for managers and developers in the methodologies you are interested in. It's one thing to read a book on how to use the Windows Presentation Foundation, but a whole other problem to tackle the fuzziness of software development methodologies that way. The whole team has to go to this training, not just one or two members, so you can practice as a team, and most importantly, think about the ramifications of the ideas as they relate to your company. When it comes down to the level of developers with their day-to-day work, I'm a firm believer in the precepts of Test Driven Development (TDD)the idea of developing test cases right along with your code. I'm not a zealot who goes off and blindly follows the extreme view of writing all the tests before I ever tackle a line of the actual code. For me it's an iterative approach. For example, I'll write the parameter checking for a method and then write the tests to call the method with all the good and bad conditions. If you look at the code for the book, you'll also see that my tests are always compiled with the main application code so that no unit tests are ever out of date. Should we do code reviews?Absolutely! Unfortunately, many companies go about them in completely the wrong way. One company I worked for required formal code reviews that were straight out of one of those only-in-fantasyland software engineering textbooks I had in college. Everything was role-based: there was a Recorder for recording comments, a Secretary for keeping the meeting moving, a Door Keeper to open the door, a Leader to suck oxygen, and so on. All that you really had, however, were 40 people in a room, none of whom had read the code. It was a huge waste of time. The kind of code reviews I like are the one-on-one informal kind. You simply sit down with a printout of the code and read it line by line with the developer. As you read it, you're keeping track of all the input and output so that you can see what's happening in the code. Think about what I just wrote. If that sounds perilously close to debugging the code, you're exactly right. Focus on what the code doesthat's the purpose of a code review. One of the wonderful members of the Review Crew, who reviewed this book as I was writing it, pointed out that on one project he was on, the management dictated that these informal code reviews be done before checking in any code. His reaction was, "This is absolutely nuts, and they won't accomplish anything!" As he was forced to go through with the reviews, he was pleasantly surprised at how much good advice and bug fixes came out of the review. Even better, the overhead was so much lower than that from actual debugging. Another trick for ensuring that your code reviews are worthwhile is to have the junior developers review the senior developer's code. Not only does that teach the less-experienced developers that their contribution is valuable, but it's also a fine way to teach them about the product and show them great programming tips and tricks. When you're doing these code reviews, your focus is on finding logic errors and bugs and making performance tweaks. The first step is to do a very quick read-through after the developer has given a verbal presentation on his requirements and a general description of how he went about solving the problem. What you're looking for here is if the developer is meeting the requirements. The reviewer has already read the code, but this gives the developer the chance to explain the reason why the developer picked certain implementations and handled situations the way they did. These reviews are also where the reviewer asks the general questions he composed during the initial reading. The next step is the bulk of the review: reading through the code with the developer. In this stage, you're manually executing the code. When I do this, I like to sit down, start with good data passed into the module, and follow the flowthrough. As I'm reading, I'm asking the developer who wrote the code the detail questions I came up with in my prior reading. The key to this process is that confrontation is absolutely not allowed. I know it's sometimes very hard to avoid offending people when reading their code, but it's not the job of the reviewer to show any superiority, only to make suggestions. The one way to prevent confrontation is by keeping the two or three folks doing the code reviews together so they are very aware that if they get out of line, their turn in the review seat is next and their reviews will be done by the person whose code they are currently reviewing. What do we do if we're having trouble reproducing builds sent to others outside the team?Every time you do a build for someone outside the team, you should make a complete copy of the project build directory on CD/DVD or tape. This copy will include all your source files, the intermediate files, the symbol files, and the final output. Also include the installation kit that you sent the customer. CD/DVDs and tapes are inexpensive insurance against future problems. Even when I've done everything possible to preserve a particular build in version control, I've still experienced cases in which a rebuild produced a binary that differed from the original. By having the complete build tree archived, you can debug the user's problem with exactly the same binaries that you sent. What additional C# compiler options will help me with my proactive debugging of managed code?Although managed code eliminates many of the most common errors that plagued us with native code, certain errors can still affect your code. Fortunately, there are some fine command-line options to help find some of those errors. The good news about Microsoft Visual Basic is that it has all the appropriate defaults, so no additional compiler switches are necessary. If you don't want to set all of these manually, the SettingsMaster add-in from Chapter 7, "Extending the Visual Studio IDE," will do the work for you. /checked+ (Check Integer Arithmetic)You can specify the checked keyword around potential problem areas, but it's something you have to remember to do as you're typing the code. The /checked+ command-line option will turn on integer underflow and overflow checking for the whole program. If a result is outside the range of the data type, the code will automatically throw a run-time exception. This switch will cause quite a bit of extra code generation, so I like to leave it on in debug builds and look for the places in code where I would need to use the checked keyword for explicit checking in release builds. To turn this switch on, in the project Properties, select the Build tab and click Advanced. In the Advanced Build Settings dialog box, select the Check For Arithmetic Underflow/Overflow check box. /noconfig (Ignore Csc.rsp)Interestingly, you can't set this switch in Visual Studio. However, it's worth knowing what the switch can allow you to do if you want to build from the command line. By default, the C# compiler reads in the Csc.rsp file to set default command-line options before it processes the command line. You can set any valid command-line options in that file you want to be globally applied. In fact, the default supplied Csc.rsp file includes a slew of /REFERENCE command-line options to common assemblies that we all use over and over. If you've ever wondered why you don't need to specifically reference something like System.XML.dll, it's because System.XML.dll is included in Csc.rsp with the /r: System.XML.dll switch. Csc.rsp is located in the .NET Framework version directory, %SystemRoot%\Microsoft.NET\Framework\Framework_Version. What CPU should I set my build to?The default for .NET applications is anycpu, and you should leave it at that. That enables what I think is one of the most interesting features in .NET: automatic bitness. What that means is that your application automatically becomes a full-fledged 64-bit application on 64-bit machines. I think it's amazing that for the price of a single compile, you have a binary that will run as a natural binary on 32-bit CPUs, 64-bit CPUs, and even the 64-bit Itanium. The automatic bitness can, though, come back to hurt you. If your code relies on an in-process DLL, either through COM or straight Platform Invoke (PInvoke), you might be in for a shock the first time you run on a 64-bit system. Since your program is loaded and automatically switches to being a 64-bit application, what do you think happens when you go to load that 32-bit dependency you have? Suddenly, your application is no longer happy, and you're dealing with an unexpected unhandled exception. If you are dependent on a 32-bit native DLL, you'll want to look at building your application with the /platform:x86 switch to ensure that your code will run on all .NET platforms. The 64-bit version of the .NET Framework also installs the 32-bit version, so your code will still run just fine. This does not excuse you from testing on 64-bit operating systems at all. Consider this the perfect excuse to justify an x64 box in your office. As I mentioned in Chapter 2, I did much of the development for this book on Windows XP Professional x64 Edition. What's been interesting about being an early adopter of 64-bit technology is finding out how much code is still making bad pointer-size assumptions. This is especially prevalent on PInvoke declarations. Even if your code does not knowingly rely on any 32-bit DLLs, you can still cause havoc with incorrectly sized structures. The one structure I've seen consistently wrong is the NMHDR structure, which is the basis of the shell notifications for all the common controls. The problem is that the MSDN documentation shows the wrong structure, not the one that's actually in the headers. The documentation says that the second field is a UINT (unsigned integer), but the actual type is UINT_PTR (unsigned integer pointer) If you're hand-crafting PInvoke declarations, go directly to the headers and verify exactly what the native types are. The correct C# declaration is as follows: [StructLayout(LayoutKind.Sequential)] public struct NMHDR { public IntPtr hwndFrom; public IntPtr idFrom; public int code; }Even if you get your structure declarations from the wonderful http://www.PInvoke.net, double-check them anyway. I updated the NMHDR definition on the site, but I'm sure there are others that don't properly account for 64-bit variants. When should I freeze upgrades to the compiler and other tools?Once you've hit feature complete, also known as beta 1, you should definitely not upgrade any tools. You can't afford the risk of a new compiler optimization scheme, no matter how well thought out, changing your code. By the time you hit beta 1, you've already done some significant testing, and if you change the tools, you'll need to restart your testing from zero. Is there anything I can do to speed up the Source Server when I first debug a program?The Source Server support in Srcsrv.dll executes your version-control system to pull files one at a time. If your version-control software or network isn't the fastest in the world, you may start dreading bouncing around the stack while debugging because you'll be waiting for the file to show up. Fortunately, there's a way to pre-pull the source code versions in a binaryby using the Srctool.exe program. When I described in Chapter 2 how Source Server performed the source indexing, I mentioned that the Source Server code uses Srctool.exe to extract the names of the source files in a PDB. The developers added many more capabilities to the tool, which you can see by passing ? on the command line. The -x and -d options are the interesting options: -x tells Srctool.exe to do an extraction operation on a specified PDB file, and -d is followed by the destination directory of the extraction. Note that all the -x switch does is extract all the source files indexed in the PDB file. There's a small bug in the Srctool.exe directory parsing that you need to be aware of. If you specify C:\Symbols\Source, the actual directory will be C:\Symbols\Source\Src because Srctool.exe appends the SRC no matter what. What I do is extract the files to a temporary directory and copy the directories under the SRC file to my cache directory to work around the bug. How does ConditionalAttribute work?There's a good bit of confusion and misinformation about ConditionalAttribute and conditional compilation, so I want to clear up exactly what happens in both. Because code is worth a million words of prose, I'll use the following program to show exactly what's happening: using System; using System.Collections.Generic; using System.Text; using System.Diagnostics; namespace CondComp { class Program { [Conditional ( "DEBUG" )] static void ConditionalWriteALine ( String data ) { Console.WriteLine ( data ); } #if DEBUG static void IfDefWriteALine ( String data ) { Console.WriteLine ( data ); } #endif static String ReturnData ( String data ) { return ( data ); } static void Main ( string [] args ) { ConditionalWriteALine ( ReturnData ( "Hello from " ) + ReturnData ( "ConditionalWriteALine" )); #if DEBUG IfDefWriteALine ( ReturnData ( "Hello from " ) + ReturnData ( "IfDefWriteALine" )); #endif } } }By applying ConditionalAttribute to a method, which can have only a void return value because of the way ConditionalAttribute is declared, you're telling the compiler to not generate any calls to that method if the defined value is not specified with the /define: compiler switch. The compilers are also smart enough to look at the calls to the method with ConditionalAttribute specified, and if the attributed method has any method calls as parameters, as shown in Main with ConditionalWriteALine in the example above, those calls to ReturnData are also removed. If you look at the release build of the above code with ILDASM, where DEBUG is not defined, Main shows the following intermediate language (IL): .method private hidebysig static void Main(string[] args) cil managed { .entrypoint // Code size 1 (0x1) .maxstack 8 IL_0000: ret } // end of method Program::MainAs you can see, neither the calls to the ConditionalWriteALine or IfDefWriteALine methods appear, nor do any of the calls to the return ReturnData method in the parameter lists. Where things are a little more interesting with ConditionalAttribute is that the definition of the ConditionalWriteALine method is still in the IL for the whole program. That means that a nefarious person who has physical access to your assembly can load it through reflection and call that method you meant only to be called in a debug build because the method is still there in a release build. Depending on your application, that could potentially open up a security hole. As you saw in the IL snippet, the method that uses the #if DEBUG. . .#endif conditional compilation is not called either by Main. The advantage to conditional compilation is that the method definition is stripped from the program, so in the example above, the IfDefWriteALine method doesn't appear in the release build. Of course, the drawback of conditional compilation is shown in the C# code at the beginning of this question: you'll have to surround every call to that method with conditional compilation to avoid compiler errors. Spencer Low, one of the excellent Review Crew members, suggested a workaround with which you can get the benefit of ConditionalAttribute without letting any debug-only code slide into your released bits. You'll use ConditionalAttribute on the method, but use conditional compilation inside the method as in the following: [Conditional ( "DEBUG" )] static void ConditionalWriteALine ( string data ) { #if DEBUG Console.WriteLine ( data ); #endif }With Spencer's trick, you won't have to litter your code with conditional compilation around all the callers. Why do you always put the constants on the left side of conditional statements?As you look through my code, you'll notice that I always use statements such as if (0 == processId)" instead of "if (processId == 0). The reason I use this style is that I'm an ancient C programmer from a bygone era. In the old days, it was very easy to forget one of the equal signs, and unlike the latter statement, using the former syntax will yield a compiler error if you do forget the second equal sign. The C# compiler is good enough that it will produce a warning if you forget an equal sign on the latter. Having been burned so many times in the old days with the insidious bug of doing an assignment in a conditional statement, it's ingrained in my DNA to always put the constant on the left side. By trying to assign to a constant, this becomes a compiler error instead of a warning, thus stopping all builds no matter what the compiler settings are. I've found that it's a lot easier to fix compiler warnings and errors than to fix bugs in the debugger. Some developers have complained, sometimes vociferously, that the way I write conditional statements makes the code more confusing to read. I don't agree. My conditional statements take only a second longer to read and translate. I'm willing to give up that second to avoid wasting huge amounts of time later. What's the difference between a .NET debug and release binary?Much like native C++, it's all about the optimizations. From a physical standpoint, a debug build has less optimized IL instructions, so more IL instructions mean more CPU instructions when JIT compiling. The main reason for the additional IL instructions is to increase debuggability. For example, the release build code for the ExtendedTask.ToolLocation property in Wintellect.Build.Tasks.DLL consists of three straightforward instructions to return a private field: .method public hidebysig specialname instance string get_ToolLocation() cil managed { // Code size 7 (0x7) .maxstack 8 IL_0000: ldarg.0 IL_0001: ldfld string Wintellect.Build.Tasks.ExtendedTask::toolLocation IL_0006: ret } // end of method ExtendedTask::get_ToolLocationThe debug build, on the other hand, has seven instructions and introduces a compiler-generated local variable: .method public hidebysig specialname instance string get_ToolLocation() cil managed { // Code size 12 (0xc) .maxstack 1 .locals init ([0] string CS$1$0000) IL_0000: nop IL_0001: ldarg.0 IL_0002: ldfld string Wintellect.Build.Tasks.ExtendedTask::toolLocation IL_0007: stloc.0 IL_0008: br.s IL_000a IL_000a: ldloc.0 IL_000b: ret } // end of method ExtendedTask::get_ToolLocationThe first instruction in the bug build is a NOP, which just like the x86 instruction with the same mnemonic, means no operation. The C# and Visual Basic compilers put these in for debug builds so that you can set breakpoints at the beginning of a basic block. A basic block is a section of code with exactly one entry and one exit. Another major difference between a debug and release build is the DebuggableAttribute value. As you can see from the name, this has something to do with debuggability and is what the JIT compiler looks for to determine how to compile the IL. DebuggableAttribute is initialized with the OR'd values from the DebuggingModes structure shown here: public enum DebuggingModes { // Fields Default = 1, DisableOptimizations = 0x100, EnableEditAndContinue = 4, IgnoreSymbolStoreSequencePoints = 2, None = 0 }In a debug build, the compiler sets all the flags in the DebuggerAttribute constructor. Obviously, the DebuggingModes.DisableOptimizations value does what the name says and tells the JIT compiler to do no optimizations. The DebugggingModes.IgnoreSymbolStoreSequencePoints, if set, tells the debugger to use the implicit sequence points in the IL itself instead of the PDB file. The sequence points tell the debugger where a source line maps to an IL instruction. Rick Byers, a developer on the CLR debugging team, has an excellent blog post that describes exactly why you always want to set the DebugggingModes.IgnoreSymbolStoreSequencePoints if you are a compiler writer or using Reflection.Emit at http://blogs.msdn.com/rmbyers/archive/2005/09/08/462676.aspx. In essence, by using the implicit sequence points in the IL, the debugger doesn't have to read the PDB file, thus producing a large performance boost. In the "Build All Builds with Debugging Symbols" section in Chapter 2, I mentioned that you want to use /debug:pdbonly when compiling your release builds instead of /debug. As far as the DebuggerAttribute constructor is concerned, the difference is that with /debug, the DebuggingModes value is Default and IgnoreSymbolStoreSequencePoints OR'd together. The Default is present for backwards compatibility with .NET 1.1, so the debugger runs .NET 2.0 binaries the same way they were run in .NET 1.1. The new .NET 2.0 /debug:pdbonly compilation switch specifies only IgnoreSymbolStoreSequencePoints. |
EAN: 2147483647
Pages: 99