Translating EXCEPTION_POINTERS Structures
|
Translating EXCEPTION_POINTERS Structures
Now that you've written your exception handlers and crash handlers, it's time to talk about those EXCEPTION_POINTERS structures that each is passed. Because these structures are where all the interesting information about the crash is stored, I wanted to develop a set of functions that you can call to translate the information into human-readable form. With these functions, all you need to concentrate on is the display of information to the user in a manner that's appropriate for your particular application. You can find all these functions in Listing 13-4.
I tried to keep the functions as simple as possible. All you need to do is to pass in the EXCEPTION_POINTERS structures. Each function returns a pointer to a global string that holds the text, which allows me to write the code so that it doesn't rely on any heap memory and so that the big buffers it needs are always present. Some of you might look at the code and cringe because it uses global variables and recycles buffers, but it's the safest code I could possibly write.
The GetRegisterString function simply returns the formatted register string. The GetFaultReason function is a little more interesting in that it returns a complete description of the problem. The returned string shows the process, the reason for the exception, the module that caused the exception, the address of the exception, and—if symbol information is available—the function, source file, and line number where the crash occurred.
CrashHandlerTest.exe caused an EXCEPTION_ACCESS_VIOLATION in module CrashHandlerTest.exe at 001B:004011D1, Baz()+0088 byte(s), d:\dev\booktwo\disk\bugslayerutil\tests\crashhandler\crashhandler.cpp, line 0061+0003 byte(s)
The most interesting functions are GetFirstStackTraceString and GetNextStackTraceString. As their names indicate, these functions let you walk the stack. As with the FindFirstFile and FindNextFile API functions, you can call GetFirstStackTraceString and then continue to call GetNextStackTraceString until it returns FALSE to walk the entire stack. The second parameter these functions take is the EXCEPTION_POINTERS structure that is passed to your crash handler function. The crash handler code does the right thing and caches the value passed to GetFirstStackTraceString, so the EXCEPTION_POINTERS structure in your crash handler function is kept pristine if you subsequently want to pass it on to the minidump writing functions. Although GetNextStackTraceString doesn't actually use the passed-in EXCEPTION_POINTERS structure, I didn't want to break any code that was already using ![]() CRASHHANDLER.CPP.
CRASHHANDLER.CPP.
The first parameter to the GetFirstStackTraceString and GetNextStackTraceString functions is a flag option parameter that lets you control the amount of information that you want to see in the resultant string. The following string shows all the options turned on:
001B:004017FD (0x00000001 0x00000000 0x00894D00 0x00000000) CrashHandlerTest.exe, wmain()+1407 byte(s), d:\dev\booktwo\disk\bugslayerutil\tes ts\crashhandler\crashhandler.cpp, line 0226+0007 byte(s)
The values in parentheses are the first four possible parameters to the function. Table 13-1 lists the options and what each will include in the output string. Some of you might wonder why I didn't include local variables as one of the output options. There were two main reasons. The first is that the main use of my CrashHandler code is intended to be at customer sites. Unless you like giving away your proprietary secrets, you're probably not distributing PDB files with private information to your customers. The second reason is that local variables, especially when you want them expanded, take up quite a bit of memory. I felt I was already pushing the limits with the static buffers I was using and that adding more to cover local variables would be prohibitive.
| Option | |
|---|---|
| 0 | Just the stack address |
| GSTSO_PARAMS | The first four possible parameters |
| GSTSO_MODULE | The module name |
| GSTSO_SYMBOL | The symbol name of the stack address |
| GSTSO_SRCLINE | The source file and line number information of the stack address |
To show you the GetFirstStackTraceString and GetNextStackTraceString functions in action, I included two sample test programs with the sample files for this book. The first, BugslayerUtil\Tests\CrashHandler, exercises the CrashHandler methods. The second program, CrashTest, shows a full dialog box example you could display in the event of an unhandled crash. Between these two programs, you should get a pretty good idea of how to use all the functions I've presented. Figure 13-2 shows CrashTest displaying its crash dialog box.
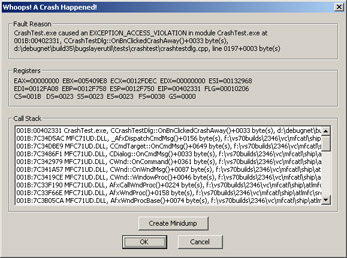
Figure 13-2: CrashTest dialog box
|
EAN: 2147483647
Pages: 177