WDBG: A Real Debugger
|
I thought the best way to show you how a debugger worked was to write one, so I did. Although WDBG might not replace the Visual Studio .NET or WinDBG debuggers any time soon, it certainly does nearly everything a debugger is supposed to do. WDBG is available with this book's sample files. If you look at Figure 4-3, you'll see WDBG debugging the CrashFinder program from Chapter 12. In the figure, CrashFinder is stopped at the third instance of a breakpoint I set on GetProcAddress in KERNEL32.DLL. The Memory window, in the upper right-hand corner, is showing the second parameter that CrashFinder passed to this particular instance of GetProcAddress, the string InitializeCriticalSectionAndSpinCount. As you look around Figure 4-3, you'll see that WDBG takes care of the business you'd expect a debugger to tend to, including showing registers, disassembling code, and showing the currently loaded modules and the currently running threads. The exciting window is the Call Stack window, which is shown in the middle-right section of Figure 4-3. Not only does WDBG show the call stack as you would expect, but it also fully supports all locals and structure expansion. What you don't see in the picture but what will become apparent when you first run WDBG is that WDBG also supports breakpoints, symbol enumeration and display in the Symbols window, and breaking the application to stop in the debugger.
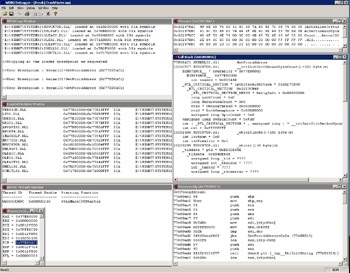
Figure 4-3: WDBG in action
Overall, I'm happy with WDBG because it's an excellent sample, and I'm proud that WDBG shows all the internals techniques that a debugger uses. Looking at the WDBG user interface (UI), however, you can see that I didn't spend a great deal of time fiddling with the UI portions. In fact, all the multiple-document interface (MDI) windows in WDBG are edit controls. That was intentional—I kept the UI simple because I didn't want UI details to distract you from the essential debugger code. I wrote the WDBG UI using the Microsoft Foundation Class (MFC) library, so if you're so inclined, you shouldn't have any trouble designing a spiffier UI.
Before moving into the specifics of debugging, let's take a closer look at WDBG. Table 4-2 lists all the main subsystems of WDBG and describes what they do. One of my intentions in creating WDBG was to define a neutral interface between the UI and the debug loop. With a neutral interface, if I wanted to make ![]() WDBG.EXE support remote debugging over a network, I'd just have to replace the local debugging DLLs.
WDBG.EXE support remote debugging over a network, I'd just have to replace the local debugging DLLs.
| Subsystem | Description |
|---|---|
| | This module contains all the UI code. Additionally, all the breakpoint processing is taken care of here. Most of this debugger's work occurs in |
| | This module contains the debug loop. Because I wanted to be able to reuse this debug loop, the user code, |
| | This simple module is just a wrapper around the API functions for manipulating the debuggee's memory and registers. By using the interface defined in this module, |
| | This module is the IA32 (Pentium) helper module. Although this module is specific to Pentium processors, its interface, defined in |
Reading and Writing Memory
Reading from a debuggee's memory is simple. ReadProcessMemory takes care of it for you. A debugger has full access to the debuggee if the debugger started it because the handle to the process returned by the CREATE_PROCESS_DEBUG_EVENT debug event has PROCESS_VM_READ and PROCESS_VM_WRITE access. If your debugger attaches to the process with DebugActiveProcess, you must have SeDebugPrivileges for the process you're attaching to get read and write access.
Before I can talk about writing to the debuggee's memory, I need to briefly explain an important concept: copy-on-write. When Windows loads an executable file, Windows shares as many mapped memory pages of that binary as possible with the different processes using it. If one of those processes is running under a debugger and one of those pages has a breakpoint written to it, the breakpoint obviously can't be present in all the processes sharing that page. As soon as any process running outside the debugger executed that code, it would crash with a breakpoint exception. To avoid that situation, the operating system sees that the page changed for a particular process and makes a copy of that page that is private to the process that had the breakpoint written to it. Thus, as soon as a process writes to a page, the operating system copies the page.
Writing to the debuggee memory is almost as straightforward as reading from it. Because the memory pages you want to write to might be marked as read-only, however, you first need to call VirtualQueryEx to get the current page protections. Once you have the protections, you can use the VirtualProtectEx API function to set the page to PAGE_EXECUTE_READWRITE so that you can write to it and Windows is prepared to do the copy-on-write. After you do the memory write, you'll need to set the page protection back to what it originally was. If you don't, the debuggee might accidentally write to the page and succeed when it should fail. If the original page protections were read-only, the debuggee's accidental write would lead to an access violation. By forgetting to set the page protection back, the accidental write wouldn't generate the exception and you'd have a case in which running under the debugger is different from running outside the debugger.
An interesting detail about the Win32 Debugging API is that the debugger is responsible for getting the string to output when an OUTPUT_DEBUG_STRING_EVENT comes through. The information passed to the debugger includes the location and the length of the string. When it receives this message, the debugger goes and reads the memory out of the debuggee. Since calls to OutputDebugString come through the Win32 Debugging API, which suspends all threads each time a debug event triggers, trace statements can easily change your application's behavior when running under a debugger. If your multithreading is correctly programmed, you can call OutputDebugString all you want without affecting your application. However, if you have bugs in your multithreading code, you can occasionally run into deadlocks from the subtle timing changes related to calling OutputDebugString.
Listing 4-2 shows how WDBG handles the OUTPUT_DEBUG_STRING_EVENT. Notice that the DBG_ReadProcessMemory function is the wrapper function around ReadProcessMemory from ![]() LOCALASSIST.DLL. Even though the Win32 Debugging API implies that you can receive both Unicode and ANSI strings as part of your OUTPUT_DEBUG_STRING_EVENT processing, up through Windows XP and Windows Server 2003, pass in only ANSI strings, even if the call comes from OutputDebugStringW.
LOCALASSIST.DLL. Even though the Win32 Debugging API implies that you can receive both Unicode and ANSI strings as part of your OUTPUT_DEBUG_STRING_EVENT processing, up through Windows XP and Windows Server 2003, pass in only ANSI strings, even if the call comes from OutputDebugStringW.
Listing 4-2: OutputDebugStringEvent from PROCESSDEBUGEVENTS.CPP
static DWORD OutputDebugStringEvent ( CDebugBaseUser * pUserClass , LPDEBUGGEEINFO pData , DWORD dwProcessId , DWORD dwThreadId , OUTPUT_DEBUG_STRING_INFO & stODSI ) { // OutputDebugString can dump huge numbers of characters so I'll // just allocate each time. DWORD dwTotalBuffSize = stODSI.nDebugStringLength ; if ( TRUE == stODSI.fUnicode ) { dwTotalBuffSize *= 2 ; } PBYTE pODSData = new BYTE [ dwTotalBuffSize ] ; DWORD dwRead ; // Read the memory. BOOL bRet = DBG_ReadProcessMemory( pData->GetProcessHandle ( ) , stODSI.lpDebugStringData , pODSData , dwTotalBuffSize , &dwRead ) ; ASSERT ( TRUE == bRet ) ; if ( TRUE == bRet ) { TCHAR * szUnicode = NULL ; TCHAR * szSelected = NULL ; if ( TRUE == stODSI.fUnicode ) { szSelected = (TCHAR*)pODSData ; } else { szUnicode = new TCHAR [ stODSI.nDebugStringLength ] ; BSUAnsi2Wide ( (const char*)pODSData , szUnicode , stODSI.nDebugStringLength ) ; int iLen = (int)strlen ( (const char*)pODSData ) ; iLen = MultiByteToWideChar ( CP_THREAD_ACP , 0 , (LPCSTR)pODSData , iLen , szUnicode , stODSI.nDebugStringLength ) ; szSelected = szUnicode ; } LPCTSTR szTemp = pUserClass->ConvertCRLF ( szSelected , stODSI.nDebugStringLength ); if ( NULL != szUnicode ) { delete [] szUnicode ; } // Send the converted string on to the user class. pUserClass->OutputDebugStringEvent ( dwProcessId , dwThreadId , szTemp ) ; delete [] szTemp ; } delete [] pODSData ; return ( DBG_CONTINUE ) ; }
Breakpoints and Single Stepping
Most engineers don't realize that debuggers use breakpoints extensively behind the scenes to allow the debugger to control the debuggee. Although you might not directly set any breakpoints, the debugger will set many to allow you to handle tasks such as stepping over a function call. The debugger also uses breakpoints when you choose to run to a specific source file line and stop. Finally, the debugger uses breakpoints to break into the debuggee on command (via the Debug Break menu option in WDBG, for example).
The concept of setting a breakpoint is simple. All you need to do is have a memory address where you want to set a breakpoint, save the opcode (the value) at that location, and write the breakpoint instruction into the address. On the Intel Pentium family, the breakpoint instruction mnemonic is INT 3 or an opcode of 0xCC, so you need to save only a single byte at the address you're setting the breakpoint. Other CPUs, such as the Intel Itanium, have different opcode sizes, so you would need to save more data at the address.
Listing 4-3 shows the code for the SetBreakpoint function. As you read through this code, keep in mind that the DBG_* functions are those that come out of ![]() LOCALASSIST.DLL and help isolate the various process manipulation routines, making it easier to add remote debugging to WDBG. The SetBreakpoint function illustrates the processing (described earlier in the chapter) necessary for changing memory protection when you're writing to it.
LOCALASSIST.DLL and help isolate the various process manipulation routines, making it easier to add remote debugging to WDBG. The SetBreakpoint function illustrates the processing (described earlier in the chapter) necessary for changing memory protection when you're writing to it.
Listing 4-3: SetBreakpoint from I386CPUHELP.C
int CPUHELP_DLLINTERFACE __stdcall SetBreakpoint ( PDEBUGPACKET dp , LPCVOID ulAddr , OPCODE * pOpCode ) { DWORD dwReadWrite = 0 ; BYTE bTempOp = BREAK_OPCODE ; BOOL bReadMem ; BOOL bWriteMem ; BOOL bFlush ; MEMORY_BASIC_INFORMATION mbi ; DWORD dwOldProtect ; ASSERT ( FALSE == IsBadReadPtr ( dp , sizeof ( DEBUGPACKET ) ) ) ; ASSERT ( FALSE == IsBadWritePtr ( pOpCode , sizeof ( OPCODE ) ) ) ; if ( ( TRUE == IsBadReadPtr ( dp , sizeof ( DEBUGPACKET ) ) ) || ( TRUE == IsBadWritePtr ( pOpCode , sizeof ( OPCODE ) ) ) ) { TRACE0 ( "SetBreakpoint : invalid parameters\n!" ) ; return ( FALSE ) ; } // Read the opcode at the location. bReadMem = DBG_ReadProcessMemory ( dp->hProcess , (LPCVOID)ulAddr , &bTempOp , sizeof ( BYTE ) , &dwReadWrite ) ; ASSERT ( FALSE != bReadMem ) ; ASSERT ( sizeof ( BYTE ) == dwReadWrite ) ; if ( ( FALSE == bReadMem ) || ( sizeof ( BYTE ) != dwReadWrite ) ) { return ( FALSE ) ; } // Is this new breakpoint about to overwrite an existing // breakpoint opcode? if ( BREAK_OPCODE == bTempOp ) { return ( -1 ) ; } // Get the page attributes for the debuggee. DBG_VirtualQueryEx ( dp->hProcess , (LPCVOID)ulAddr , &mbi , sizeof ( MEMORY_BASIC_INFORMATION ) ) ; // Force the page to copy-on-write in the debuggee. if ( FALSE == DBG_VirtualProtectEx ( dp->hProcess , mbi.BaseAddress , mbi.RegionSize , PAGE_EXECUTE_READWRITE , &mbi.Protect ) ) { ASSERT ( !"VirtualProtectEx failed!!" ) ; return ( FALSE ) ; } // Save the opcode I'm about to whack. *pOpCode = (void*)bTempOp ; bTempOp = BREAK_OPCODE ; dwReadWrite = 0 ; // The opcode was saved, so now set the breakpoint. bWriteMem = DBG_WriteProcessMemory ( dp->hProcess , (LPVOID)ulAddr , (LPVOID)&bTempOp , sizeof ( BYTE ) , &dwReadWrite ) ; ASSERT ( FALSE != bWriteMem ) ; ASSERT ( sizeof ( BYTE ) == dwReadWrite ) ; if ( ( FALSE == bWriteMem ) || ( sizeof ( BYTE ) != dwReadWrite ) ) { return ( FALSE ) ; } // Change the protection back to what it was before I blasted the // breakpoint in. VERIFY ( DBG_VirtualProtectEx ( dp->hProcess , mbi.BaseAddress , mbi.RegionSize , mbi.Protect , &dwOldProtect ) ) ; // Flush the instruction cache in case this memory was in the CPU // cache. bFlush = DBG_FlushInstructionCache ( dp->hProcess , (LPCVOID)ulAddr , sizeof ( BYTE ) ) ; ASSERT ( TRUE == bFlush ) ; return ( TRUE ) ; } After you set the breakpoint, the CPU will execute it and will tell the debugger that an EXCEPTION_BREAKPOINT (0x80000003) occurred—that's where the fun begins. If it's a regular breakpoint, the debugger will locate and display the breakpoint location to the user. After the user decides to continue execution, the debugger has to do some work to restore the state of the program. Because the breakpoint overwrote a portion of memory, if you, as the debugger writer, were to just let the process continue, you would be executing code out of sequence and the debuggee would probably crash. What you need to do is move the current instruction pointer back to the breakpoint address and replace the breakpoint with the opcode you saved when you set the breakpoint. After restoring the opcode, you can continue executing.
There's only one small problem: How do you reset the breakpoint so that you can stop at that location again? If the CPU you're working on supports single-step execution, resetting the breakpoint is trivial. In single-step execution, the CPU executes a single instruction and generates another type of exception, EXCEPTION_SINGLE_STEP (0x80000004). Fortunately, all CPUs that Win32 runs on support single-step execution. For the Intel Pentium family, setting single-step execution requires that you set bit 8 on the flags register. The Intel reference manual calls this bit the TF, or Trap Flag. The following code shows the SetSingleStep function and the work needed to set the TF. After replacing the breakpoint with the original opcode, the debugger marks its internal state to reflect that it's expecting a single-step exception, sets the CPU into single-step execution, and then continues the process.
// SetSingleStep from i386CPUHelp.C BOOL CPUHELP_DLLINTERFACE __stdcall SetSingleStep ( PDEBUGPACKET dp ) { BOOL bSetContext ; ASSERT ( FALSE == IsBadReadPtr ( dp , sizeof ( DEBUGPACKET ) ) ) ; if ( TRUE == IsBadReadPtr ( dp , sizeof ( DEBUGPACKET ) ) ) { TRACE0 ( "SetSingleStep : invalid parameters\n!" ) ; return ( FALSE ) ; } // For the i386, just set the TF bit. dp->context.EFlags |= TF_BIT ; bSetContext = DBG_SetThreadContext ( dp->hThread , &dp->context ) ; ASSERT ( FALSE != bSetContext ) ; return ( bSetContext ) ; } After the debugger releases the process by calling ContinueDebugEvent, the process immediately generates a single-step exception after the single instruction executes. The debugger checks its internal state to verify that it was expecting a single-step exception. Because the debugger was expecting a single-step exception, it knows that a breakpoint needs to be reset. The single step caused the instruction pointer to move past the original breakpoint location. Therefore, the debugger can set the breakpoint opcode back at the original breakpoint location. The operating system automatically clears the TF each time the EXCEPTION_SINGLE_STEP exception occurs, so there's no need for the debugger to clear it. After setting the breakpoint, the debugger releases the debuggee to continue running.
If you want to see all the breakpoint processing in action, look for the CWDBGProjDoc::HandleBreakpoint method in the ![]() WDBGPROJDOC.CPP file with this book's sample files. I defined the breakpoints themselves in
WDBGPROJDOC.CPP file with this book's sample files. I defined the breakpoints themselves in ![]() BREAKPOINT.H and
BREAKPOINT.H and ![]() BREAKPOINT.CPP, and those files contain a couple of classes that handle different styles of breakpoints. I set up the WDBG Breakpoints dialog box so that you could set breakpoints as the debuggee is running, just as you do in the Visual Studio .NET debugger. Being able to set breakpoints on the fly means that you need to keep careful track of the debuggee state and the breakpoint states. See the CBreakpointsDlg::OnOK method in
BREAKPOINT.CPP, and those files contain a couple of classes that handle different styles of breakpoints. I set up the WDBG Breakpoints dialog box so that you could set breakpoints as the debuggee is running, just as you do in the Visual Studio .NET debugger. Being able to set breakpoints on the fly means that you need to keep careful track of the debuggee state and the breakpoint states. See the CBreakpointsDlg::OnOK method in ![]() BREAKPOINTSDLG.CPP, which is with this book's sample files, for details on how I handle enabling and disabling breakpoints, depending on what the debuggee state is.
BREAKPOINTSDLG.CPP, which is with this book's sample files, for details on how I handle enabling and disabling breakpoints, depending on what the debuggee state is.
One of the neater features I implemented in WDBG was the Debug Break menu option. This option means that you can break into the debugger at any time while the debuggee is running. In the first edition of this book, I went through a huge explanation of a technique in which I suspended all the debuggee threads, set a one-shot breakpoint in each thread, and to ensure the breakpoints executed, posted WM_NULL messages to the threads. (To find out more about one-shot breakpoints, see the section "Step Into, Step Over, and Step Out" later in this chapter.) It took quite a bit of code to get it working, and it generally worked fairly well. However, in the one case in which it didn't work, all the debuggee's threads were deadlocked on kernel-mode objects. Since the threads were suspended in kernel mode, there was no way I could bump them back down to user mode. I had to do all this work and live with the limitation of my implementation because WDBG needed to run on Windows 98 and Microsoft Windows Me as well as on Windows NT–based operating systems.
Since I dropped support for Windows 98 and Windows Me, implementing the Debug Break menu became absolutely trivial and always works. The magic is the wonderful function CreateRemoteThread, which isn't available on Windows 98 or Windows Me but is available on Windows 2000 and later. Another function that achieves the same effect as CreateRemoteThread but is available only on Windows XP and later is DebugBreakProcess. As you can see from the following code, the implementation of the function that does the work is simple. When the remote thread executes the DebugBreak call, I just treat the resulting breakpoint exception as if it were a user-defined breakpoint in the exception handling code.
HANDLE LOCALASSIST_DLLINTERFACE __stdcall DBG_CreateRemoteBreakpointThread ( HANDLE hProcess , LPDWORD lpThreadId ) { HANDLE hRet = CreateRemoteThread ( hProcess , NULL , 0 , (LPTHREAD_START_ROUTINE)DebugBreak , 0 , 0 , lpThreadId ) ; return ( hRet ) ; } Although it might appear risky to pop a thread into a debuggee, I felt it was safe enough, especially because this is the exact same technique that WinDBG uses to affect its Debug Break menu. However, I do want to mention that there are side effects from calling CreateRemoteThread. When a thread starts in a process, the contract it has with the operating system is that it will call each DllMain for all loaded DLLs that haven't called DisableThreadLibraryCalls. Correspondingly, when the thread ends, all those DllMain functions that were called with the DLL_THREAD_ATTACH notification will be called with the DLL_THREAD_DETACH notification as well. This all means that if you have a bug in one of your DllMain functions, the CreateRemoteThread approach of stopping the debuggee could exacerbate the trouble. The odds are slim, but it's something to keep in mind.
Symbol Tables, Symbol Engines, and Stack Walking
The real black art to writing a debugger involves symbol engines, the code that manipulates symbol tables. Debugging at the straight assembly-language level is interesting for the first couple of minutes you have to do it, but it gets old quickly. Symbol tables, also called debugging symbols, are what turn hexadecimal numbers into source file lines, function names, and variable names. Symbol tables also contain the type information your program uses. This type information allows the debugger to take raw data and display it as the structures and variables you defined in your program.
Dealing with modern symbol tables is difficult. The most commonly used symbol table format, Program Database (PDB), finally has a documented interface, but the interface is quite challenging to work with and doesn't yet support extremely useful functionality such as stack walking. Fortunately, ![]() DBGHELP.DLL supplies enough of a wrapper to make things easier, as I'll discuss in a moment.
DBGHELP.DLL supplies enough of a wrapper to make things easier, as I'll discuss in a moment.
The Different Symbol Formats
Before diving into a discussion of accessing symbol tables, I need to go over the various symbol formats available. I've found that people are a little confused about what the different formats are and what they offer, so I want to set the record straight.
Common Object File Format (COFF) was one of the original symbol table formats and was introduced with Windows NT 3.1, the first version of Windows NT. The Windows NT team was experienced with operating system development and wanted to bootstrap Windows NT with some existing tools. The COFF format is part of a larger specification that different UNIX vendors followed to try to make common binary file formats. Visual C++ 6 was the last version of the Microsoft compilers to support COFF.
The C7, or CodeView, format first appeared as part of Microsoft C/C++ version 7 back in the MS-DOS days. If you're an old-timer, you might have heard the name CodeView before—CodeView was the name of the old Microsoft debugger. The C7 format has been updated to support the Win32 operating systems, and Visual C++ 6 is the last compiler to support this symbol format. The C7 format was self-contained in the executable module because the linker appends the symbolic information to the binary after it links. Attaching the symbol information to your binary means that your debugging binaries can be quite large; symbol information can easily be larger than your binary file.
The PDB (Program Database) format is the most common symbol format used today, and Visual C++, Visual C#, and Visual Basic .NET support it. As everyone with more than five minutes of experience has seen, PDB files store the symbol information separately from the binary. To see whether a binary contains PDB symbol information, run the DUMPBIN program that comes with Visual Studio .NET against the binary. Specifying the /HEADERS command-line option to DUMPBIN will dump out the Portable Executable (PE) file header information. Part of the header information contains the Debug Directories. If the information listed says the format is cv with the format as RSDS, it's a Visual Studio .NET–compiled binary with PDB files.
DBG files are unique because, unlike the other symbol formats, the linker doesn't create them. A DBG file is basically just a file that holds other types of debug symbols, such as COFF or C7. DBG files use some of the same structures defined by the PE file format—the format used by Win32 executables. REBASE.EXE produces DBG files by stripping the COFF or C7 debugging information out of a module. There's no need to run REBASE.EXE on a module that was built using PDB files because the symbols are already separate from the module. Microsoft distributes DBG files with the operating system debugging symbols because, for debuggers prior to Visual Studio .NET and the latest WinDBG, they're needed to find the appropriate PDB file for operating system binaries.
Accessing Symbol Information
The traditional way of handling symbols has been through the ![]() DBGHELP.DLL supplied by Microsoft. Previously,
DBGHELP.DLL supplied by Microsoft. Previously, ![]() DBGHELP.DLL supported only public information, which basically amounts to function names and rudimentary global variables. However, that's more than enough information to write some excellent utilities. In the first edition of this book, I spent a few pages talking about how to get
DBGHELP.DLL supported only public information, which basically amounts to function names and rudimentary global variables. However, that's more than enough information to write some excellent utilities. In the first edition of this book, I spent a few pages talking about how to get ![]() DBGHELP.DLL to load your symbols, but with the latest releases,
DBGHELP.DLL to load your symbols, but with the latest releases, ![]() DBGHELP.DLL has improved dramatically and it just works. There's no need for me to discuss what's already in the documentation about how to use the
DBGHELP.DLL has improved dramatically and it just works. There's no need for me to discuss what's already in the documentation about how to use the ![]() DBGHELP.DLL symbol functions, so I'll just refer you to the MSDN documentation. An updated
DBGHELP.DLL symbol functions, so I'll just refer you to the MSDN documentation. An updated ![]() DBGHELP.DLL is always distributed with Debugging Tools for Windows, so you should check www.microsoft.com/ddk/debugging occasionally to get the latest and greatest version.
DBGHELP.DLL is always distributed with Debugging Tools for Windows, so you should check www.microsoft.com/ddk/debugging occasionally to get the latest and greatest version.
When the first Visual Studio .NET betas came out, I was excited because Microsoft was supposed to provide an interface to PDB files. At first glance, I thought the Debug Interface Access (DIA) SDK was going to be quite a help to us folks who were interested in developing tools that could access local variables and parameters as well as provide a means for expanding structures and arrays—in short, a complete solution to our symbol needs.
When I first started the second edition of this book, I set out to write a symbol engine using DIA that came with Visual Studio .NET 2002. The first issue I encountered was that the DIA symbol engine is essentially nothing more than a PDB reader. That's no big deal, but it meant I was going to have to handle a good deal of the higher-level management functions myself. DIA does what it's supposed to do; I was just assuming that it might do more. I sat down and started to work and noticed that there didn't seem to be any support for walking the stack with DIA. The StackWalk64 API, which I discuss later, expects some special functions to help it access various symbol information necessary to walk the stack. Unfortunately, it appears that DIA at the time didn't expose all the necessary information. For example, one piece of information the StackWalk64 function needs is the frame pointer omission (FPO).
It looks the like the Visual Studio .NET 2003 release of DIA does support interfaces that have to do with stack walking, but it was given interfaces only in the IDL and there is very little documentation on how to actually use the new code. With this new support for stack walking, I thought I should still go on using DIA because it seemed to be the wave of the future even though DIA looked quite daunting. As I continued designing and developing, I ran into the biggest problem of all: the DIA interface is pseudo COM-based in that it looks like COM but is quite unwieldy, so you get all the extreme pain of COM with none of the benefits.
As I started working on some of the basic code, I ran into the interface that best demonstrates why good COM design is critical. The symbol interface, IDiaSymbol, has 95 documented methods. Unfortunately, nearly everything in DIA is a symbol. In fact, there are 31 unique symbol types in the SymTagEnum enumeration. What DIA calls symbols are things like array types or labels, not actual values. The huge problem with the IDiaSymbol interface is that all the types support only a few of the 95 interfaces. For example, a base type, the most rudimentary type for a symbol that describes items like integers, supports only two interfaces—one to get the basic type enumeration itself and one to get the length of the type. The rest of the interfaces simply return E_NOTIMPLEMENTED. Having a super-flat hierarchy in which a single interface does multiple duty is fine when the shared items are relatively small, but with the number of different types in DIA, it just leads to a ton of coding and gyrations that are, in my opinion, unnecessary. The types DIA uses are hierarchical, and the interface should have been designed as such. Instead of using a single interface for everything, the types should have been defined as their own interfaces, because they would be much easier to work with. As I started designing my wrapper on top of DIA, I quickly realized that I was going to be writing tons of code to put a hierarchy on top of DIA that should already have been in the interface.
I started to realize that I was about to reinvent the wheel while working on my DIA-based symbol engine, and I knew I was in trouble. The wheel I was looking at designing in this case was the ![]() DBGHELP.DLL symbol engine. I'd already looked at the DBGHELP.H header and figured out that
DBGHELP.DLL symbol engine. I'd already looked at the DBGHELP.H header and figured out that ![]() DBGHELP.DLL from the latest release of WinDBG was supporting some form of local and parameter enumeration along with structure and array expansion. The only problem was that large portions of the local and parameter enumeration appeared to be undocumented. Fortunately, as I continued grinding through the DIA header files, I started to see some patterns in the return values in the
DBGHELP.DLL from the latest release of WinDBG was supporting some form of local and parameter enumeration along with structure and array expansion. The only problem was that large portions of the local and parameter enumeration appeared to be undocumented. Fortunately, as I continued grinding through the DIA header files, I started to see some patterns in the return values in the ![]() DBGHELP.DLL code and, sure enough, they matched values I'd been seeing in one of the DIA SDK header files,
DBGHELP.DLL code and, sure enough, they matched values I'd been seeing in one of the DIA SDK header files, ![]() CVCONST.H. That was a big breakthrough because it allowed me to get started using the
CVCONST.H. That was a big breakthrough because it allowed me to get started using the ![]() DBGHELP.DLL local symbol information. It looks like
DBGHELP.DLL local symbol information. It looks like ![]() DBGHELP.DLL is a wrapper on top of DIA and is quite a bit easier to deal with than raw DIA, so I decided to build on top of
DBGHELP.DLL is a wrapper on top of DIA and is quite a bit easier to deal with than raw DIA, so I decided to build on top of ![]() DBGHELP.DLL instead of completely rewriting it on my own.
DBGHELP.DLL instead of completely rewriting it on my own.
The code I ended up writing is all in the SymbolEngine project, which is with this book's sample files. That code provides the local symbols for WDBG as well as for the SUPERASSERT dialog box. In general, the SymbolEngine project is a wrapper around the ![]() DBGHELP.DLL symbol engine functions to make it easier to use and extend the symbol handling. To avoid problems with exporting classes out of DLLs, I made SymbolEngine a static library. As you look at the SymbolEngine implementation, you might notice several builds that end in _BSU. Those are special builds of SymbolEngine for
DBGHELP.DLL symbol engine functions to make it easier to use and extend the symbol handling. To avoid problems with exporting classes out of DLLs, I made SymbolEngine a static library. As you look at the SymbolEngine implementation, you might notice several builds that end in _BSU. Those are special builds of SymbolEngine for ![]() BUGSLAYERUTIL.DLL, because
BUGSLAYERUTIL.DLL, because ![]() BUGSLAYERUTIL.DLL is used as part of SUPERASSERT. I didn't want it to use SUPERASSERT for its assertions, which would cause grief with reentrant code, so don't link against those versions. You might also notice in my use of the
BUGSLAYERUTIL.DLL is used as part of SUPERASSERT. I didn't want it to use SUPERASSERT for its assertions, which would cause grief with reentrant code, so don't link against those versions. You might also notice in my use of the ![]() DBGHELP.DLL symbol engine that I always used the versions of the functions that end in 64. Although the documentation says that the non-64-bit functions are supposed to be just wrappers around the 64-bit functions, I found in a few cases that calling the 64-bit versions directly worked better than the wrappers. Consequently, that's why I always use them. You might want to pull up the SymbolEngine project because there's way too much code involved to print it here in the book and follow along with this discussion. I want to explain how to use my symbol enumeration as well as touch on a few of the implementation high points. Here is one last point about my SymbolEngine project: the
DBGHELP.DLL symbol engine that I always used the versions of the functions that end in 64. Although the documentation says that the non-64-bit functions are supposed to be just wrappers around the 64-bit functions, I found in a few cases that calling the 64-bit versions directly worked better than the wrappers. Consequently, that's why I always use them. You might want to pull up the SymbolEngine project because there's way too much code involved to print it here in the book and follow along with this discussion. I want to explain how to use my symbol enumeration as well as touch on a few of the implementation high points. Here is one last point about my SymbolEngine project: the ![]() DBGHELP.DLL symbol engine supports only ANSI characters. My SymbolEngine project is partially Unicode aware, so I didn't have to constantly convert every
DBGHELP.DLL symbol engine supports only ANSI characters. My SymbolEngine project is partially Unicode aware, so I didn't have to constantly convert every ![]() DBGHELP.DLL string into Unicode when using SymbolEngine. As I was working with it, I widened ANSI parameters to Unicode parameters as I needed them. Not everything has been converted over, but enough has to handle most uses.
DBGHELP.DLL string into Unicode when using SymbolEngine. As I was working with it, I widened ANSI parameters to Unicode parameters as I needed them. Not everything has been converted over, but enough has to handle most uses.
The basic algorithm for enumerating the locals is shown in the following code. As you can see, it's rather simple. In the pseudocode, I used actual ![]() DBGHELP.DLL function names.
DBGHELP.DLL function names.
STACKFRAME64 stFrame ; CONTEXT stCtx ; Fill out stFrame GetThreadContext ( hThread , &stCtx ) ; while ( TRUE == StackWalk ( . . . &stFrame . . . ) ) { // Set the context information to indicate which locals you want to // enumerate. SymSetContext ( hProcess , &stFrame , &stCtx ) ; // Enumerate the locals. SymEnumSymbols ( hProcess , // Value passed to SymInitialize. 0 , // DLL base, set to zero to look across DLLs. NULL , // RegExp mask to search for, NULL==all. EnumFunc , // The callback function. NULL ); // User context passed to callback. } The callback function passed to SymEnumSymbols gets a SYMBOL_INFO structure, as shown in the following code. If all you want is basic information for the symbol, such as the address and its name, the SYMBOL_INFO structure is all you need. Additionally, the Flags field will tell you whether the symbol is a local or a parameter.
typedef struct _SYMBOL_INFO { ULONG SizeOfStruct; ULONG TypeIndex; ULONG64 Reserved[2]; ULONG Reserved2; ULONG Size; ULONG64 ModBase; ULONG Flags; ULONG64 Value; ULONG64 Address; ULONG Register; ULONG Scope; ULONG Tag; ULONG NameLen; ULONG MaxNameLen; CHAR Name[1]; } SYMBOL_INFO, *PSYMBOL_INFO; As with most things in computers, the difference between the minimal and what you want is pretty large, which is why there's so much code in my SymbolEngine project. I wanted functionality that would enumerate the locals but show me the types and values in the same way Visual Studio .NET does. As you can see from Figure 4-3 and the SUPERASSERT screen shots in Chapter 3, I was able to accomplish that.
Using my symbol enumeration code is quite simple. First define a function with the prototype shown in the next bit of code. This function is called back on each variable decoding. The string parameters are the completely expanded type, the variable name (if appropriate), and the value for the particular variable. The indent parameter tells you how far indented the value is compared with previous values. For example, if you have a local structure on the stack with two member fields and you told my enumeration code to expand up to three levels, your callback function would be called three times for the structure. The first call would be for the structure variable name and address with an indent level of zero. Each member variable would get its own callback with an indent level of one. And there you have your three callbacks.
typedef BOOL (CALLBACK *PENUM_LOCAL_VARS_CALLBACK) ( DWORD64 dwAddr , LPCTSTR szType , LPCTSTR szName , LPCTSTR szValue , int iIndentLevel , PVOID pContext ) ;
To enumerate the locals in the middle of your stack walk, you simply call the EnumLocalVariables method; it takes care of setting the appropriate context and doing the symbol enumeration for you. The EnumLocalVariables prototype is shown in the following code. The first parameter is to your callback function. The second and third parameters tell the local enumeration code how much to expand and whether you want arrays to be expanded. As you can imagine, the more you expand, the slower the code executes. Additionally, expanding arrays can be very expensive because there's no way of telling how many elements appear in an array. The good news is that my expansion code does the right thing when it sees char * or wchar_t * arrays and doesn't expand each character, but expands the string directly. The fourth parameter is the memory read function that you pass to StackWalk. If you pass NULL, my enumeration code will use ReadProcessMemory. The rest of the parameters are self-explanatory.
BOOL EnumLocalVariables ( PENUM_LOCAL_VARS_CALLBACK pCallback , int iExpandLevel , BOOL bExpandArrays , PREAD_PROCESS_MEMORY_ROUTINE64 pReadMem , LPSTACKFRAME64 pFrame , CONTEXT * pContext , PVOID pUserContext ) ;
To see the local enumeration code in action, your best bet is to start with the SymLookup test program in the SymbolEngine\Tests\SymLookup directory, which is with this book's sample files. SymLookup is small enough to enable you to see what's going on. It also shows every possible type of variable generated by the C++ compiler so that you can see how the different variables expand.
The implementation for all the local expansion is in three source files. ![]() SYMBOLENGINE.CPP contains the higher-level functions for decoding variables and expanding arrays. All the type decoding takes place in
SYMBOLENGINE.CPP contains the higher-level functions for decoding variables and expanding arrays. All the type decoding takes place in ![]() TYPEDECODING.CPP, and all the value decoding is in
TYPEDECODING.CPP, and all the value decoding is in ![]() VALUEDECODING.CPP. When you read over the code, keep in mind Captain Recursion! (When I was in college, the professor teaching Computer Science 101 came into class dressed as Captain Recursion, wearing tights and a cape, to teach us all about recursion. It was a fairly scary sight, but I certainly learned all about recursion in one easy lesson.) The way symbols are decoded is much like they are stored in memory. Figure 4-4 shows an example of what gyrations the symbol expansion goes through when expanding a pointer to a structure. The SymTag* values are those types defined as the tag values according to
VALUEDECODING.CPP. When you read over the code, keep in mind Captain Recursion! (When I was in college, the professor teaching Computer Science 101 came into class dressed as Captain Recursion, wearing tights and a cape, to teach us all about recursion. It was a fairly scary sight, but I certainly learned all about recursion in one easy lesson.) The way symbols are decoded is much like they are stored in memory. Figure 4-4 shows an example of what gyrations the symbol expansion goes through when expanding a pointer to a structure. The SymTag* values are those types defined as the tag values according to ![]() CVCONST.H. The SymTagData value is the type that indicates that the subsequent recursion will be a data type. The basic rules are that you continue to recurse down until you hit a type of some kind. Various types such as user-defined types (UDTs) and classes have child classes, so you always need to check for children.
CVCONST.H. The SymTagData value is the type that indicates that the subsequent recursion will be a data type. The basic rules are that you continue to recurse down until you hit a type of some kind. Various types such as user-defined types (UDTs) and classes have child classes, so you always need to check for children.
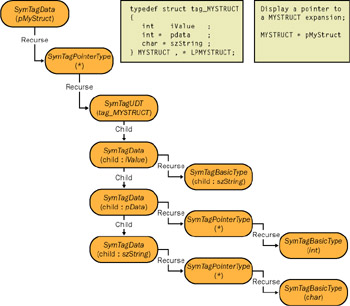
Figure 4-4: An example symbol expansion
Although I went into the development of the ![]() DBGHELP.DLL symbol engine thinking it was going to be relatively straightforward, I found Robert Burns was right: "The best laid plans of mice and men oft gang agley." Of all the code in this book, implementing SymbolEngine and getting it working correctly took far longer than anything else. As I had no clear picture of what symbol types derive down to, it took quite a bit of trial and error to eventually get everything working. The biggest lesson I learned is that even when you think you completely understand something, the proof is in the implementation.
DBGHELP.DLL symbol engine thinking it was going to be relatively straightforward, I found Robert Burns was right: "The best laid plans of mice and men oft gang agley." Of all the code in this book, implementing SymbolEngine and getting it working correctly took far longer than anything else. As I had no clear picture of what symbol types derive down to, it took quite a bit of trial and error to eventually get everything working. The biggest lesson I learned is that even when you think you completely understand something, the proof is in the implementation.
Walking the Stack
Earlier I alluded to the fact that ![]() DBGHELP.DLL has the StackWalk64 API function, so we don't have to write our own stack walking code. StackWalk64 is straightforward and takes care of all your stack walking needs. WDBG uses the StackWalk64 API function, just as the WinDBG debugger does. The only snag you might encounter is that the documentation isn't explicit about what needs to be set in the STACKFRAME64 structure. The code here shows you the exact fields that need to be filled out in the STACKFRAME64 structure.
DBGHELP.DLL has the StackWalk64 API function, so we don't have to write our own stack walking code. StackWalk64 is straightforward and takes care of all your stack walking needs. WDBG uses the StackWalk64 API function, just as the WinDBG debugger does. The only snag you might encounter is that the documentation isn't explicit about what needs to be set in the STACKFRAME64 structure. The code here shows you the exact fields that need to be filled out in the STACKFRAME64 structure.
// InitializeStackFrameWithContext from i368CPUHelp.C. BOOL CPUHELP_DLLINTERFACE __stdcall InitializeStackFrameWithContext ( STACKFRAME64 * pStack , CONTEXT * pCtx ) { ASSERT ( FALSE == IsBadReadPtr ( pCtx , sizeof ( CONTEXT ) ) ) ; ASSERT ( FALSE == IsBadWritePtr ( pStack , sizeof ( STACKFRAME64) )); if ( ( TRUE == IsBadReadPtr ( pCtx , sizeof ( CONTEXT ) ) ) || ( TRUE == IsBadWritePtr ( pStack , sizeof ( STACKFRAME ) ) ) ) { return ( FALSE ) ; } pStack->AddrPC.Offset = pCtx->Eip ; pStack->AddrPC.Mode = AddrModeFlat ; pStack->AddrStack.Offset = pCtx->Esp ; pStack->AddrStack.Mode = AddrModeFlat ; pStack->AddrFrame.Offset = pCtx->Ebp ; pStack->AddrFrame.Mode = AddrModeFlat ; return ( TRUE ) ; } StackWalk64 does such a good job of taking care of the details that you might not be aware that stack walking can be difficult with optimized code. The reason for the difficulty is that the compiler can optimize away the stack frame, the place where the code pushes stack entries, for some functions. The Visual C++ compiler is aggressive when it does the optimization, and if it can use the stack frame register as a scratch register, it will. To facilitate walking the stack in such situations, the compiler generates FPO data. The FPO data is a table of information that StackWalk64 uses to figure out how to handle those functions missing a normal stack frame. I wanted to mention FPO because occasionally you'll see references to it on MSDN and in various debuggers. If you're curious, WINNT.H contains the FPO data structures.
Step Into, Step Over, and Step Out
Now that I've described breakpoints and the symbol engine, I want to explain how debuggers implement the excellent Step Into, Step Over, and Step Out functionality. I didn't implement these features in WDBG because I wanted to concentrate on the core portions of the debugger. Step Into, Step Over, and Step Out require source and disassembly views that allow you to keep track of the current executing line or instruction. After you read the discussion in this section, you'll see that the core architecture of WDBG has the infrastructure you need to wire these features in and that adding these features is mostly an exercise in UI programming. Step Into, Step Over, and Step Out all work with one-shot breakpoints, which are breakpoints that the debugger discards after the breakpoints trigger.
Step Into works differently depending on whether you're debugging at the source level or the disassembly level. When debugging at the source level, the debugger must rely on one-shot breakpoints because a single high-level language line translates into one or more assembly language lines. If you set the CPU into single-step mode, you would be single-stepping individual instructions, not the source lines.
At the source level, the debugger knows the source line you're on. When you execute the debugger's Step Into command, the debugger uses the symbol engine to look up the address of the next line to execute. The debugger will do a partial disassembly at the next line address to see whether the line is a call instruction. If the line is a call instruction, the debugger will set a one-shot breakpoint on the first address of the function the debuggee is about to call. If the next line address isn't a call instruction, the debugger sets a one-shot breakpoint there. After setting the one-shot breakpoint, the debugger will release the debuggee so that it runs to the freshly set one-shot breakpoint. When the one-shot breakpoint triggers, the debugger will replace the opcode at the one-shot location and free any memory associated with the one-shot breakpoint. If the user is working at the disassembly level, Step Into is much easier to implement because the debugger will just force the CPU into single-step execution.
Step Over is similar to Step Into in that the debugger must look up the next line in the symbol engine and does the partial disassembly at the line address. The difference is that in Step Over, the debugger will set a one-shot breakpoint after the call instruction if the line is a call.
The Step Out operation is in some ways the simplest of the three. When the user selects the Step Out command, the debugger walks the stack to find the return address for the current function and sets a one-shot breakpoint on that address.
The processing for Step Into, Step Over, and Step Out seems straightforward, but there's one small twist that you need to consider. If you write your debugger to handle Step Into, Step Over, and Step Out, what are you going to do if you've set the one-shot breakpoint for those cases and a regular breakpoint triggers before the one-shot breakpoint? As a debugger writer, you have two choices. The first is to leave your one-shot breakpoints alone so that they trigger. The other option is to remove your one-shot breakpoint when the debugger notifies you that a regular breakpoint triggered. The latter option is what the Visual Studio .NET debugger does.
Either way of handling this case is correct, but by removing the one-shot breakpoint for Step Into, Step Over, and Step Out, you avoid user confusion. If you allow the one-shot breakpoint to trigger after the normal breakpoint, the user can easily be left wondering why the debugger stopped at an odd location.
|
EAN: 2147483647
Pages: 177
- Chapter X Converting Browsers to Buyers: Key Considerations in Designing Business-to-Consumer Web Sites
- Chapter XI User Satisfaction with Web Portals: An Empirical Study
- Chapter XIV Product Catalog and Shopping Cart Effective Design
- Chapter XV Customer Trust in Online Commerce
- Chapter XVIII Web Systems Design, Litigation, and Online Consumer Behavior