Schedule Time for Building Debugging Systems
|
As you're doing the design and initial scheduling for your project, make sure to add in time for building your debugging systems. You need to decide up front how you're going to implement your crash handlers (a topic covered in Chapter 13), file data dumpers, and other tools you'll need to help you reproduce problems reported from the field. I've always liked to treat the error handling systems as if they were a product feature. That way, others in the company can see how you're going to handle bugs proactively when they come up.
As you're planning your debugging systems, you need to establish your preventive debugging policies. The first and most difficult parts of this process involve determining how you're going to return error conditions in the project. Whatever you do, make sure you pick only one way and stick with it. One project I encountered long ago (and fortunately wasn't a part of) had three different ways to return errors: return values, setjmp/longjmp exceptions, and through a global error variable similar to the C run-time library's errno variable. Those developers had a very difficult time tracking errors across subsystem boundaries.
When it comes to .NET development, choosing how to handle error conditions is fairly simple. You can either continue to rely on return values or use exceptions. The beauty of .NET is that, unlike native code, there's a standard exception class, System.Exception, which all other exceptions derive from. The one drawback to .NET exceptions is that you still have to rely on excellent documentation or code inspections to know exactly which exception is thrown by a method. As you'll see in my code, I still tend to use the return value approach for normal operation and expected errors, because it will always be a little faster than the overhead necessary to generate the throw and catch code. However, for any anomalous errors, I always throw.
With native code, on the other hand, you're basically forced to use only the return value approach. The problem is that C++ has no standard exception class that's automatically assumed to be thrown, and the implementation issues of technologies such as COM can't have exceptions crossing apartment or process boundaries. As you'll see in great detail in Chapter 13, C++ exceptions are one of the biggest performance and bug producing areas known to developer-kind. Do yourself a great favor and forget that C++ exceptions exist. They are great from a theoretical standpoint, but you have to keep in mind that reality is a cruel master.
Build All Builds with Debugging Symbols
Some of the debugging system recommendations that I do make aren't that controversial. I've been harping on my first recommendation for years: build all builds, including release builds, with full debugging symbols. Debugging symbols are the data that let the debugger show you source and line information, variable names, and data type information for your program. All that information is stored in a .PDB (Program Database) file associated with your modules. If you're paid by the hour, spending forever at the assembly language level could do wonders for paying your mortgage. Unfortunately, the rest of us don't have the luxury of infinite time, so speedily finding those bugs is a priority.
Of course, debugging release builds with symbols has its drawbacks. For example, the optimized code that the just-in-time (JIT) compiler or native compiler produces won't always match the flow of execution in the source code, so you might find that stepping through release code is a little harder than stepping through debug code. Another problem to watch out for in native release builds is that sometimes the compiler optimizes the stack registers such that you can't see the complete call stack, as you would in a straight debug build. Also be aware that when you do add debugging symbols to the binary, it will grow a small amount to account for the debug section string that identifies the .PDB file. However, the few-byte size increase is negligible when compared to the ease of being able to solve bugs quickly.
Turning on debug symbols for a release build is quite easy, though it should have been turned on by default in the wizard-generated projects. For a C# project, open the project Property Pages dialog box and select the Configuration Properties folder. Select All Configurations or Release in the Configurations dropdown list, display the Configuration Properties folder, Build property page, and set the Generate Debugging Information field to True. This sets the /debug:full flag for CSC.EXE. Figure 2-1 shows the project Property Pages dialog box in which you turn on debugging information.
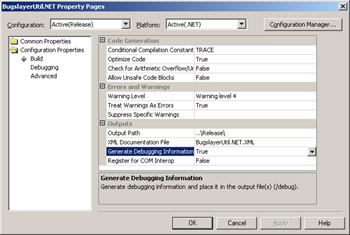
Figure 2-1: Generating debugging information for a C# project
For reasons that I still can't quite fathom, the Microsoft Visual Basic .NET project Property Pages dialog box is different from the one for C# projects, but the compiler switch is still the same. Figure 2-2 shows setting a release build that produces full debug symbols. Open the project Property Pages dialog box and select the Configuration Properties folder. Select All Configurations or Release in the Configuration drop down list, display the Configuration Properties folder, Build property page, and check the Generate Debugging Information check box.
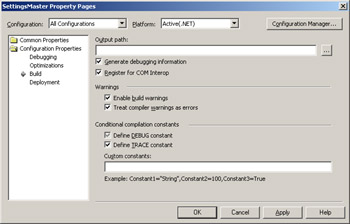
Figure 2-2: Generating debugging information for a Visual Basic .NET project
For native C++, the /Zi switch turns on the PDB file for the compiler. In the project Property Pages dialog box, display the C/C++ folder, General property page, and set Debug Information Format to Program Database (/Zi). Make sure you don't select Program Database For Edit & Continue or your release build will be built with all the extra padding bytes necessary for editing and continuing, and thus be quite fat and slow. Figure 2-3 shows the appropriate compiler settings. There are other settings for better builds set in Figure 2-3, and I'll discuss them in the Common Debugging Question, "What additional compiler and linker options will help me with my proactive debugging of native code?"
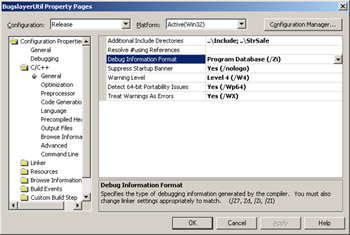
Figure 2-3: Setting the C++ compiler to generate debugging information
After setting the compiler switch, you'll need to set the appropriate linker switches: /INCREMENTAL:NO, /DEBUG, and /PDB. The incremental linking option resides in the project Property Pages dialog box, Linker folder, General property page, and Enable Incremental Linking field. Figure 2-4 shows the switch location.
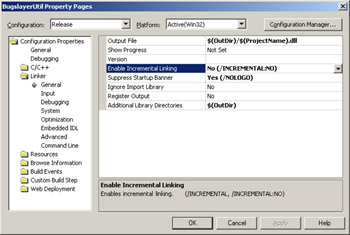
Figure 2-4: Turning off incremental linking in the C++ linker
In the project Property Pages dialog box, Linker folder, Debugging property page, set the Generate Debug Info option to Yes (/DEBUG). To set the /PDB option, place $(OutDir)/$(ProjectName).PDB in the Generate Program Database File option, which is directly below the Generate Debug Info field. In case you haven't noticed, the Microsoft Visual Studio .NET project system finally fixed some of the big problems prior versions had with generic build options. The values starting with $ and in parentheses are macro values. From their names, you can probably guess what they are. All the other macros are accessible by clicking in most editable options in the property page and then selecting <Edit…> from the drop-down list. The dialog box that pops up will show all the macros and what they'll expand to. Figure 2-5 demonstrates how to set the /DEBUG and /PDB switches. The rest of the settings in the figure are important for native C++ code. Later in the chapter, I'll discuss the Common Debugging Question, "What additional compiler and linker options will help me with my proactive debugging of native code?"
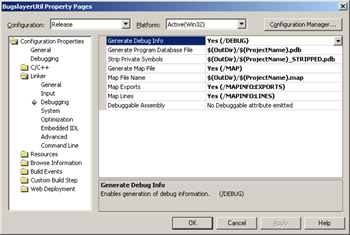
Figure 2-5: C++ linker debug node settings
To properly get debugging symbols for C++, two more settings are necessary: /OPT:REF and /OPT:ICF. Both switches are set in the Linker folder, Optimization property page, as shown in Figure 2-6. Set the References option to Eliminate Unreferenced Data (/OPT:REF). Set the Enable COMDAT Folding option to Remove Redundant COMDATs (/OPT:ICF). Using the /DEBUG switch with the linker automatically tells the switch to bring in all functions whether or not they are referenced, which is the default for debug builds. The /OPT:REF switch tells the linker to bring in only functions that your program calls directly. If you forget to add the /OPT:REF switch, your release application will also contain the functions that are never called, making the application much larger than it should be. The /OPT:ICF switch will combine identical data COMDAT records when necessary so that you'll have only one constant data variable for all references to that constant value.
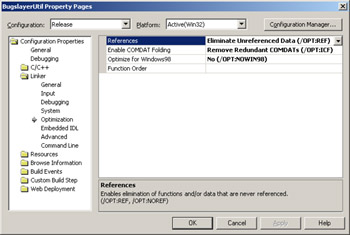
Figure 2-6: C++ optimization linker settings
After you build your release builds with full PDB files, you need to store the PDB files in a safe place along with any binary files you ship to customers. If you lose your PDB files, you'll be right back to debugging at the assembly-language level. Treat your PDB files as you would your distributed binaries.
If the thought of manually changing your project's settings to build with debug symbols, as well as the rest of the proper build switches, has you dreading the work, don't worry—there's hope. For Chapter 9, I wrote an extremely cool add-in, SettingsMaster, that takes all the work out of changing project settings. SettingsMaster's defaults are to set up your projects using the settings recommended in this chapter.
For Managed Code, Treat Warnings as Errors
If you've written anything more than "Hello World!" in managed code, you've certainly noticed that the compilers don't let much slide as far as compiler errors are concerned. For those of you coming from a C++ background and new to .NET, you are probably amazed at how much tighter everything feels—in C++, you could cast values to almost anything and the compiler would blindly go on its merry way. In addition to making sure data types are explicit, the managed code compilers can do much more to help you with errors if you let them. As usual, the trick to debugging smarter is not one big gesture, but taking advantage of lots of small steps along the way. Making your tools as smart as possible is one of those steps.
In the Visual Studio .NET documentation, if you browse the Contents pane and then go to Visual Studio .NET\Visual Basic and Visual C#\Reference\Visual C# Language\C# Compiler Options\Compiler Errors CS0001 Through CS9999, you'll see all the compiler errors for C#. (The Visual Basic .NET compiler errors are also included in the documentation, but amazingly the compiler errors aren't indexed in the Contents pane.) As you scroll down the list of errors, you'll notice that some say Compiler Warning and indicate a level, for example, Compiler Warning (level 4) CS0028. If you keep scrolling down the list, you'll find warning levels from 1 through 4. When you have a warning, the compiler indicates that the construct at that location in the source code is syntactically correct but might not be contextually correct. A perfect example is CS0183, shown in the following code. (The given expression is always of the provided ('type') type.)
// Generates warning CS0183 because a string (or any type in .NET for that // matter) is ALWAYS derived from Object. public static void Main ( ) { String StringOne = "Something pithy. . ." ; if ( StringOne is String ) // CS0183 { Console.WriteLine ( StringOne ) ; } } Given that the compiler can tell you all sorts of wonderful contextual problems like this, doesn't it make sense to fix these problems? I don't like to call the problems warnings because they are really errors. If you've ever had the opportunity to learn about compiler construction, particularly parsing, you probably walked away with two thoughts: parsing is extremely hard, and people who write compilers are different from the rest of us. (Whether that's a good different or bad different, I'll let you decide.) If the compiler writers go to tremendous trouble to report a warning, they are telling you something they obviously feel is quite important and is probably a bug. When a client asks us to help with a bug, the first thing we do is verify with them that the code compiles with no warnings. If it doesn't, I tell them that I'll be glad to help, but not until their code compiles cleanly.
Fortunately, Visual Studio .NET generates projects with the appropriate warning levels by default, so you shouldn't have to set the warning levels manually. If you're building your C# project manually, you'll want to set the /WARN switch to / WARN:4. For Visual Basic .NET manual compiles, warnings are on by default, so you specifically have to turn them off.
Although the warning levels are appropriately set by Visual Studio .NET, the default for treating warnings as errors is not set correctly. Cleanly compiling code is next to godliness, so you'll want to get the /WARNASERROR+ switch set for both the C# and Visual Basic .NET compilers. That way you can't even begin to start debugging until the code is perfect. For C# projects, in the project Property Pages dialog box, Configuration Properties, Build property page, under the Errors And Warnings column, set Treat Warnings As Errors to True. See Figure 2-1 for an illustration of that page. For Visual Basic .NET projects, in the project Property Pages dialog box, Configuration Properties, Build property page, check the Treat Compiler Warnings As Errors check box, as shown in Figure 2-2.
For C# projects in particular, treating warnings as errors will stop the build on all sorts of excellent problems such as CS0649 (Field 'field' is never assigned to, and will always have its default value 'value'), which indicates you have a class member that is uninitialized. However, other messages, such as CS1573 (Parameter 'parameter' has no matching param tag in XML comment (but other parameters do)), might seem so annoying that you'll be tempted to turn off treating warnings as errors. I strongly suggest you don't.
In the case of CS1573, you're using the phenomenal /DOC switch to generate the XML documentation for your assembly. (Personally, I think it's a huge crime that Visual Basic .NET and C++ don't support the /DOC switch and XML documentation.) This is a perfect error because if you're using XML documentation, someone else on your team is probably going to be reading that documentation, and if you aren't documenting everything you assume with parameters, or anything else for that matter, you're doing everyone on your team a disservice.
One warning that's improperly treated as an error is CS1596: (XML documentation not updated during this incremental rebuild; use /incremental-to update XML documentation.) Although creating the XML documentation is great, this error stops the build cold. Because there's no way to turn off this error, the only workaround is to turn off incremental building in either debug or release. Since fast compiles are nice, I turn off incremental building in the release build and produce only XML documentation in the release build. That way I can still benefit from the fast turnaround compiles but get my XML documentation when I need it.
For Native Code, Treat Warnings as Errors—Mostly
Compared to managed code, native C++ not only lets you shoot yourself in the foot when it comes to compilation issues, but it also hands you the loaded gun and cocks it for good measure. When you get a warning in C++ code, you're really being told that the compiler is taking a wild guess as to what you intended. A warning such as C4244 ('conversion' conversion from 'type1' to 'type2', possible loss of data), which is always reported on conversions between signed and unsigned types, is an excellent example. This is where the compiler has a fifty-fifty chance of reading your mind and picking what should happen with that upper bit.
In many cases, fixing the error is as trivial as applying a cast to a variable. The whole idea is to make the code as unambiguous as possible so that there is no guessing on the compiler's part. Some of the warnings are fantastic for clarifying your code, such as C4101 ('identifier' : unreferenced local variable), which tells you that a local variable is never referenced. Fixing the C4101 warning will make your code much more readable for code reviews and maintenance programmers, and no one will waste time wondering what that extra variable is for or where it's used. Other warnings, such as C4700 (local variable 'name' used without having been initialized), tell you exactly where you've got a bug in your code. For some of our clients, simply bumping the warning level up and fixing these warnings solved bugs they would otherwise have spent weeks trying to track down.
The default projects that the Visual C++ wizards create are at warning-level 3, which corresponds to the /W3 switch in CL.EXE. The next step up is warning-level 4, /W4, and you should even have the compiler treat all warnings as errors with /WX. These levels are all easy to set in the project Property Pages dialog box, C/C++ folder, General property page. In the Warning Level field, select Level 4 (/W4). Two fields down is the Treat Warnings As Errors field, which you'll want to set to Yes (/ WX). Figure 2-3 shows both fields properly filled out.
Although I can almost justify making the global statement "All builds should compile with warning-level 4, and you should treat all warnings as errors," reality intrudes to force me to temper this remark. The Standard Template Library (STL) that comes with Visual C++ has many warning-level 4 issues in it. The compiler also has a few problems with templates. Fortunately, you can work around most of these issues.
You might think that just setting the warning level to 4 and turning off treating warnings as errors would be fine; in fact, that scheme defeats the purpose. I've found that developers quickly become desensitized to warnings in the Build window. If you don't fix all the warnings as they happen, no matter how innocuous a warning seems, you'll start to lose more important warnings because they'll be hidden amid the output stream. The trick is to be more explicit about which warnings you want to handle. Although your goal should be to get rid of most warnings by writing better code, you can also turn off specific errors with the #pragma warning directive. Additionally, you can use the #pragma warning directive to control the error level around specific headers.
A good example of lowering the error level is when you're including headers that don't compile at warning-level 4. The extended #pragma warning directive, first offered in Visual C++ 6, can lower the warning level. In the following code snippet, I set the warning level before including the suspect header and reset it so that my code compiles with warning-level 4:
#pragma warning ( push , 3 ) #include "IDoNotCompileAtWarning4.h" #pragma warning ( pop )
You can also disable individual warnings with the #pragma warning directive. This directive comes in handy when you're using a nameless structure or union and you get a C4201 error, "nonstandard extension used : nameless struct/union," with warning-level 4. To turn off that warning, you use the #pragma warning directive as in the following code. Notice that I commented what I was turning off and explained why I was turning it off. When disabling individual warnings, be sure to restrict the scope of the #pragma warning directive to specific sections of code. If you place the directive at too high a level, you can mask other problems in your code.
// Turning off "nonstandard extension used : nameless struct/union" // because I'm not writing portable code #pragma warning ( disable : 4201 ) struct S { float y; struct { int a ; int b ; int c ; } ; } *p_s ; // Turn warning back on. #pragma warning ( default : 4201 ) One warning, C4100, "'identifier' : unreferenced formal parameter," seems to cause confusion about how to fix it. If you have a parameter that's not being referenced, you should probably remove that parameter from the definition of the method. However, if you're doing object-oriented programming, you can derive from a method that no longer needs the parameter and then you can't change the base class. The following code snippet shows how to properly work around the C4100 error:
// This code will generate the C4100 error. int ProblemMethod ( int i , int j ) { return ( 5 ) ; } // The following code properly avoids the C4100 error. int GoodMethod ( int /* i */ , int /* j */ ) { return ( 22 ) ; } If you're not using STL, this scheme works well. If you're using STL, it might work, but it might not. Your best bet with STL is to include only the STL headers in your precompiled headers. It makes isolating the #pragma warning ( push , 3 ) and #pragma warning ( pop ) around the headers much easier. The other huge benefit is that your compiles will speed up dramatically. A precompiled header is essentially the parse tree, and because STL includes so much stuff, precompiling headers will save lots of time. Finally, to fully track memory leaks and corruptions in the C run-time library, you'll need to keep the STL headers together. The debug C run-time library is discussed in Chapter 17.
The bottom line is that you must compile at warning-level 4 and treat all warnings as errors from the start of your project. When you first boost the warning level for your project, you'll probably be surprised by the number of warnings you get. Go through and fix each one. You'll probably notice that just fixing the warnings will solve a bug or two. For those of you who think getting your program to compile with /W4 and /WX is impossible, I have proof otherwise: all the native sample code on this book's companion CD compiles with both flags set for all configurations.
I realize that people much smarter than I wrote the STL supplied with Visual Studio .NET, but even so, it's nearly impossible to understand. On one hand, the concept of STL is good because it has a consistent interface and is widely used. On the other hand, the reality of the STL supplied with Visual Studio .NET and with templates in general is that if you have any kind of problem, you have more difficulty figuring it out than you would debugging straight at the assembly-language level.
Better than the Visual Studio .NET–supplied STL is the free STL from STLport (www.stlport.org). Not only is STLport infinitely more readable, but it also has much better support for multithreading and excellent debugging support built in. Given these advantages and the fact that it has absolutely no restrictions on commercial use, I would highly recommend that you use it instead of the STL supplied with Visual Studio .NET if you have to use STL at all.
For Native Code, Know Where Your DLLs Load
If you've ever been hiking in the woods, you know that landmarks can be very important in keeping you from getting lost. When you don't have any landmarks, you can end up going around in circles. When your application crashes, you need a similar kind of landmark to help point you in the right direction so that you're not wandering around in the debugger.
The first big landmark for crashes is the base address of your dynamic-link libraries (DLLs) and ActiveX controls (OCXs), which indicates where they loaded into memory. When a customer gives you a crash address, you should be able to narrow down which DLL it came from quickly by the first two or three numbers. I don't expect you to have all the system DLLs memorized, but you should memorize at least the DLL base addresses for the DLLs in your project.
If all your DLLs load at unique addresses, you have some good landmarks to help guide your search for the crash. But what do you think would happen if all your DLLs had the same load address? Obviously, the operating system doesn't map them all into the same place in memory. It has to "relocate" any incoming DLL that wants to occupy memory that's already filled by putting the incoming DLL into a different place. The issue then becomes one of trying to figure out which DLL is loaded where. Unfortunately, you have no way of knowing what the operating system will do on different machines. This means you'll get a crash address and literally have no idea where that address came from. And that means your boss will be extremely upset because you can't tell him why the application died.
By default for wizard-created projects, Visual Basic 6 ActiveX DLLs load at 0x11000000, and Visual C++ DLLs load at 0x10000000. I'm willing to bet that at least half the DLLs in the world today try to load at one of those addresses. Changing the base address for your DLL is called rebasing, and it's a simple operation in which you specify a load address different from the default.
Before we jump into rebasing, let's look at two easy ways to find out whether you have load conflicts in your DLLs. The first way is to use the Visual Studio .NET debugger Modules window. Run your application in Visual Studio .NET and display the Modules window, which is accessible from the Debug menu, Windows submenu, or by pressing CTRL+ALT+U with the default keyboard mapping. If a module has been rebased, its icon displays a red ball with an exclamation point next to the name. Additionally, the load address for the module has an asterisk after the address range. Figure 2-7 shows where the SYMSRV.DLL was relocated in the debugging session.
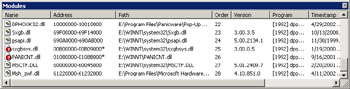
Figure 2-7: The Visual Studio .NET debugger Modules window with a relocated DLL
The second way is to download the free Process Explorer, written by my good friend and onetime neighbor, Mark Russinovich, from Sysinternals (www.sysinternals.com). Process Explorer, as its name implies, shows you all sorts of information about your processes, for example, loaded DLLs and all open handles. It's such a useful tool that if you don't have it on your machines right now, stop immediately and go download it! Also, make sure to read Chapter 14 for additional hints and tricks you can use to make your debugging life easier with Process Explorer.
Seeing whether you have relocated DLLs is very easy. Just follow the next set of steps. Figure 2-8 shows what it looks like to have relocated DLLs in a process.
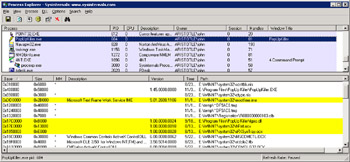
Figure 2-8: Process Explorer showing relocated DLLs
-
Start Process Explorer as well as your process.
-
Select View DLLs from the View menu.
-
Select Highlight Relocated DLLs from the Options menu.
-
Select your process in the upper half of the main window.
If any DLLs show up highlighted in yellow, they have been relocated.
Another excellent tool that will show relocated DLLs with not only the relocated address but also the original address is ProcessSpy from Christophe Nasarre's excellent "Escape from DLL Hell with Custom Debugging and Instrumentation Tools and Utilities, Part 2" in the August 2002 edition of MSDN Magazine. Process Explorer and ProcessSpy are similar utilities, but ProcessSpy comes with source code so that you can see how all the magic happens.
In addition to making it difficult to find a crash, when the operating system has to relocate a DLL, your application slows down. When relocating, the operating system needs to read all the relocation information for the DLL, run through each place in the code that accesses an address within the DLL, and change the address because the DLL is no longer at its preferred place in memory. If you have a couple of load address conflicts in your application, startup can sometimes take more than twice as long!
The other big problem is that because of the relocation, the operating system can't completely swap out that module from memory if it needs the room for other code. If the module loads at its preferred load address, the operating system can read the module back in directly from disk if the module was swapped out. If a module is rebased, the problem is that the code memory for that module has been changed for that process. Therefore, the operating system must keep that memory around someplace—which happens to be the page file—even if the module is swapped out. As you can imagine, this can eat up large chunks of memory and cause the computer to slow down as it's moving this memory around.
There are two ways to rebase the DLLs in your application. The first method is to use the REBASE.EXE utility that comes with Visual Studio .NET. REBASE.EXE has many different options, but your best bet is to call it using the /b command-line switch with the starting base address and place the appropriate DLLs on the command line. The good news is that once you do the rebasing, you'll almost never have to touch those DLLs again. Also make sure to do any rebasing before you sign a DLL. If you rebase a DLL after it's been signed, that DLL won't load.
Table 2-1 shows a table from the Visual Studio .NET documentation for rebasing your DLLs. As you can see, the recommended format is to use an alphabetical scheme. I generally follow this scheme because it's simple. The operating system DLLs load from 0x70000000 to 0x78000000, so using the range in Table 2-1 will keep you from conflicting with the operating system. Of course, you should always look in your application's address space by using Process Explorer or ProcessSpy to see whether any DLLs are already loaded at the address you want to use.
| DLL First Letter | Starting Address |
|---|---|
| A–C | 0x60000000 |
| D–F | 0x61000000 |
| G–I | 0x62000000 |
| J–L | 0x63000000 |
| M–O | 0x64000000 |
| P–R | 0x65000000 |
| S–U | 0x66000000 |
| V–X | 0x67000000 |
| Y–Z | 0x68000000 |
If you have four DLLs in your application, APPLE.DLL, DUMPLING.DLL, GINGER.DLL, and GOOSEBERRIES.DLL, you run REBASE.EXE three times to get all the DLLs rebased appropriately. The following three commands show how to run REBASE.EXE with those DLLs:
REBASE /b 0x60000000 APPLE.DLL REBASE /b 0x61000000 DUMPLING.DLL REBASE /b 0x62000000 GINGER.DLL GOOSEBERRIES.DLL
If multiple DLLs are passed on the REBASE.EXE command line, as shown here with GINGER.DLL and GOOSEBERRIES.DLL, REBASE.EXE will rebase the DLLs so that they are loaded back to back starting at the specified starting address.
The other method of rebasing a DLL is to specify the load address when you link the DLL. In Visual C++, specify the address by selecting Linker folder, Advanced property page in the project Property Pages dialog box. The Base Address field is where you'll set the hexadecimal address. The address will be used with the /BASE switch passed to LINK.EXE. Figure 2-9 shows where you set the base address.
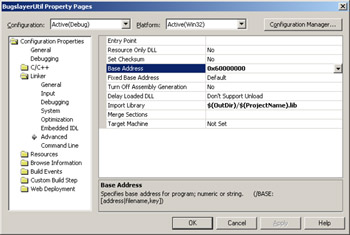
Figure 2-9: Setting the base address for a DLL
Although you can use REBASE.EXE to automatically handle setting multiple DLL load addresses at a time, you have to be a little more careful when setting the load address at link time. If you set the load addresses of multiple DLLs too close together, you'll see the relocated DLL in the debugger Module window. The trick is to set the load addresses far enough apart that you never have to worry about them after you set them.
Using the same DLLs from the REBASE.EXE example, I'd set their load address to the following:
APPLE.DLL 0x60000000 DUMPLING.DLL 0x61000000 GINGER.DLL 0x62000000 GOOSEBERRIES.DLL 0x62100000
The important two DLLs are GINGER.DLL and GOOSEBERRIES.DLL because they begin with the same character. When that happens, I use the third-highest digit to differentiate the load addresses. If I were to add another DLL that started with "G," its load address would be 0x62200000.
To see a project in which the load addresses are set manually, look at the WDBG project in Chapter 4. The /BASE switch also allows you to specify a text file that contains the load addresses for each DLL in your application. In the WDBG project, I use the text-file scheme.
Either method, using REBASE.EXE or rebasing the DLLs manually, will rebase your DLLs and OCXs, but it might be best to follow the second method and rebase your DLLs manually. I manually rebased all the sample DLLs on this book's companion CD. The main benefit of using this method is that your MAP file will contain the specific address you set. A MAP file is a text file that indicates where the linker put all the symbols and source lines in your program. You should always create MAP files with your release builds because they are the only straight text representation of your symbols that you can get. MAP files are especially handy in the future when you need to find a crash location and your current debugger doesn't read the old symbols. If you use REBASE.EXE to rebase a DLL instead of rebasing it manually, the MAP file created by the linker will contain the original base address, and you'll have to do some arithmetic to convert an address in the MAP file to a rebased address. In Chapter 12, I'll explain MAP files in more detail.
One of the big questions I get when I tell people to rebase their files is, "What files am I supposed to rebase?" The rule of thumb is simple: if you or someone on your team wrote the code, rebase it. Otherwise, leave it alone. If you're using third-party components, your binaries will have to fit around them.
What About Managed Modules and Base Addresses?
At this point you're probably thinking that since managed components are compiled to DLLs, you might want to rebase those as well. If you've explored the compiler switches for the C# and Visual Basic .NET compilers, you might have seen the /BASEADDRESS switch for setting the base address. Well, when it comes to managed code, things are quite a bit different. If you really look at a managed DLL with DUMPBIN.EXE, the Portable Executable (PE) dumper from Visual Studio .NET, or with Matt Pietrek's excellent PEDUMP (MSDN Magazine, February 2002), you'll notice a single imported function, _CorDllMain from MSCOREE.DLL, and a single relocation entry.
Thinking that there might be actual executable code in managed DLLs, I disassembled a few and everything in the module code section looked like data. I scratched my head a bit more and noticed something very interesting. The entry point of the module, which is the place where execution starts, happens to be the same address as the imported _CorDllMain. That helped confirm there's no native executable code.
In the end, rebasing isn't going to buy you a tremendous advantage in the same way it does for native code. Nonetheless, I do it anyway because it seems to me that the operating system loader is still involved, so in the end, loading a relocated managed DLL will be slightly slower. If you do choose to rebase your managed DLLs, you must do it at build time. If you use REBASE.EXE on a managed signed DLL, the security code will see that the DLL has been changed and refuse to load it.
Although managed code eliminates many of the most common errors that plagued us with native code, certain errors can still affect your code. Fortunately, there are some fine command-line options to help find some of those errors. The good news about Visual Basic .NET is that it has all the appropriate defaults, so no additional compiler switches are necessary. If you don't want to set all of these manually, the SettingsMaster add-in from Chapter 9 will do the work for you.
/checked+ (Check Integer Arithmetic)
You can specify the checked keyword around potential problem areas, but it's something you have to remember to do as you're typing the code. The /checked+ command-line option will turn on integer underflow and overflow checking for the whole program. If a result is outside the range of the data type, the code will automatically throw a run-time exception. This switch will cause quite a bit of extra code generation, so I like to leave it on in debug builds and look for the places in code where I would need to use the checked keyword for explicit checking in release builds. You can turn this switch on in the project Property Pages dialog box, Configuration Properties folder, Build property page by setting the Check For Arithmetic Overflow/ Underflow to True.
/noconfig (Ignore CSC.RSP)
Interestingly, you can't set this switch in Visual Studio .NET. However, it's worth knowing what the switch can allow you to do if you want to build from the command line. By default, the C# compiler reads in the CSC.RSP file to set default command-line options before it processes the command line. You can set any valid command-line options in that file to prime the pump. In fact, the default supplied CSC.RSP file includes a slew of /REFERENCE command-line options to common assemblies that we all use over and over. If you've ever wondered why you don't need to specifically reference something like System.XML.dll, it's because System.XML.dll is included in CSC.RSP with the /r: System.XML.dll switch. CSC.RSP is located in the .NET Framework version directory, <Windows Dir>\Microsoft.NET\Framework\<Framework Version>.
A number of compiler and linker switches can help you control your application's performance and better debug your application. Additionally, I don't completely agree with the default compiler and linker settings that the Visual C++ project wizards give you, as I mentioned earlier in the chapter. Consequently, I always change some of the settings. If you don't want to set all of these manually, the SettingsMaster add-in from Chapter 9 will do the work for you.
Compiler Switches for CL.EXE
Although you can add these switches manually in the project Property Pages dialog box, C/C++ folder, Command Line property page, Additional Options text box, you're much better off setting them in their appropriate locations. Adding command-line switches in the Additional Options text box can lead to problems because developers aren't used to looking there for command-line options.
/EP /P (Preprocess to a File)
If you're having trouble with a macro, the /EP and /P switches will preprocess your source file, expanding all macros and including all include files, and send the output to a file with the same name but with an .I extension. You can look in the .I file to see how your macro expanded. Make sure that you have sufficient disk space because the .I files can be several megabytes apiece. You might also want to specify the /C (Don't strip comments) option as well to keep comments in the preprocessed file.
Set the /EP and /P switches in the project Property Pages dialog box, C/C++ folder, Preprocessor property page, and set Generate Preprocessed File to Without Line Numbers (/EP /P). The Keep Comments option on the same property page allows you to set the /C compiler option. Keep in mind that using these switches will not pass the .I file on to the compiler for compilation, so your build will report errors. Once you're finished determining the problem, turn off these switches. As I've learned from personal experience, checking in a project with these switches still on won't endear you to your teammates or manager.
/X (Ignore Standard Include Paths)
Getting a correct build can sometimes be a pain if you have multiple compilers and SDKs installed on your machine. If you don't use the /X switch, the compiler, when invoked by a MAK file, will use the ![]() INCLUDE environment variable. To control exactly which header files are included, the /X switch will cause the compiler to ignore the
INCLUDE environment variable. To control exactly which header files are included, the /X switch will cause the compiler to ignore the ![]() INCLUDE environment variable and look only for header files in the locations you explicitly specify with the /I switch. You can set this switch in the project Property Pages dialog box, C/C++ folder, Preprocessor property page, Ignore Standard Include Path property.
INCLUDE environment variable and look only for header files in the locations you explicitly specify with the /I switch. You can set this switch in the project Property Pages dialog box, C/C++ folder, Preprocessor property page, Ignore Standard Include Path property.
/Zp (Struct Member Alignment)
You should not use this flag. Instead of specifying on the command line how structure members should be aligned in memory, you should align structure members by using the #pragma pack directive inside specific headers. I've seen some huge bugs in code because the development team originally built by setting /Zp. When they moved to a new build or another team went to use their code, the /Zp switch was forgotten, and structures were slightly different because the default alignment was different. It took a long time to find those bugs. You can set this switch in the project Property Pages dialog box, C/C++ folder, Code Generation property page\Struct Member Alignment property.
If you do happen to be setting the #pragma pack directive, don't forget about the new #pragma pack (show) option, which will report the packing to the Build window when compiling. That option will help you keep track of what the current alignment across sections of code actually is.
/Wp64 (Detect 64-bit Portability Issues)
This excellent switch will save you lots of time getting your code 64-bit ready. You can turn it on in the project Property Pages dialog box, C/C++ folder, General property page by setting Detect 64-bit Portability Issues to Yes (/Wp64). It's best to start your new development with this switch. If you try it on a bunch of code for the first time, you can be overwhelmed by the number of problems reported since it's very picky. Additionally, some of the Microsoft-supplied macros that are supposed to help with Win64 portability, such as SetWindowLongPtr, have errors reported by the /Wp64 switch.
/RTC (Run-Time Error Checks)
These are the greatest switches known to C++ kind! There are three run-time check switches. /RTCc enables checking for data loss when converting values to a smaller data type. /RTCu helps track down uninitialized variable references. /RTCs enables some excellent stack-frame checking by initializing all local variables to a known value (0xCC), detecting local variable underruns and overruns, and validating stack pointers for stack corruption. You can set these switches in the project Property Pages dialog box, C/C++ folder, Code Generation property page\Smaller Type Check and Basic Runtime Checks properties. These switches are so important that I discuss them in detail in Chapter 17.
/GS (Buffer Security Check)
One of the most common techniques of virus writers is to exploit buffer overruns so that they can redirect the return address to malicious code. Fortunately, the /GS switch inserts security checks to ensure that the return address isn't overwritten, which makes writing those kinds of viruses much more difficult. /GS is set by default in release builds, and I would encourage you to use it in your debug builds as well. The first time it tracks down that one wild write that just so happens to overwrite only the return address, you'll see how many weeks of horrific debugging this switch can save you. Turn on /GS in the project Property Pages dialog box, C/C++ folder, Code Generation property page by setting Buffer Security Check to Yes (/GS). I'll explain how to change the default notifications for errors caught by /GS in Chapter 17.
/O1 (Minimize Size)
By default, a C++ project created by wizards uses /O2 (Maximize Speed) for its release-build configurations. However, Microsoft builds all its commercial applications with /O1 (Minimize Size), and that's what you should be using. You can set this switch in the project Property Pages dialog box, C/C++ folder, Optimization property page and in the Optimization property. What Microsoft has found is that after picking the best algorithm and writing tight code, avoiding page faults can help speed up your application considerably. As I've heard it said, "Page faults can ruin your day!"
A page is the smallest block of code or data (4 KB for x86-based machines) that the memory manager can manipulate as a unit. A page fault occurs when a reference is made to an invalid page. A page fault can occur for a variety reasons, such as trying to access a page that is on standby or on the modified list, or trying to access a page that is no longer in memory. To resolve a page fault, the operating system must stop executing your program and place the new page on the CPU. If the page fault is soft, meaning that the page is already in memory, the overhead isn't too terrible—but it's extra overhead nonetheless. If the page fault is hard, however, the operating system must go out to disk and bring the page into memory. As you can imagine, this little trip will cause hundreds of thousands of instructions to execute, slowing down your application. By minimizing the size of your binary, you decrease the total number of pages your application uses, thereby reducing the number of page faults. Granted, the operating system's loaders and cache management are quite good, but why take more page faults than you have to?
In addition to using /O1, you should look at using the Smooth Working Set (SWS) utility from Chapter 19. SWS will help you order your most commonly called functions to the front of your binary so that you minimize your working set, that is, the number of pages kept in memory. With your common functions up front, the operating system can swap out the unneeded pages. Thus, your application runs faster.
/GL (Whole Program Optimization)
Microsoft has spent a considerable effort to improve the code generators, and they have done a masterful job of generating very small and very fast code with Visual C++ .NET. The big change is that instead of doing optimizations in only a single file (also known as a compiland) at compile time, they can now do cross-file optimization when the program is linked. I'm sure the first time anyone compiles a C++ project under Visual C++ .NET, he will see a dramatic reduction in code size. Amazingly, default Visual C++ projects release builds don't have this wonderful switch on by default. Set it in your release builds in the project Property Pages dialog box, Configuration Properties folder, General property page by ensuring Whole Program Optimizations is set to Yes. This will also set the appropriate linker switch, /LTCG, as well.
/showIncludes (List Include Files)
This switch does exactly what the name says. As you compile a file, it lists all the include files in a hierarchical listing so you can see who is including what from where. Turn on this switch in the project Property Pages dialog box, C/C++ folder, Advanced property page, and set the Show Includes property to Yes (/showIncludes).
Linker Switches for LINK.EXE
Although you can add these switches manually in the project Property Pages dialog box, Linker folder, Command Line property page, Additional Options text box, you're much better off setting these in their appropriate locations. Adding command-line switches in the Additional Options text box can lead to problems because developers aren't used to looking there for command-line options.
/MAP (Generate MAP File)
/MAPINFO:LINES (Include Line Information in MAP File)
/MAPINFO:EXPORTS (Include Export Information in MAP File)
These switches build a MAP file for the linked image. (See Chapter 12 for instructions on how to read a MAP file.) You should always create a MAP file because it's the only way to get textual symbolic information. Use all three of these switches to ensure that the MAP file contains the most useful information. You can set these switches in the project Property Pages dialog box, Linker folder, Debug property page.
/NODEFAULTLIB (Ignore Libraries)
Many system header files include #pragma comment ( lib#, XXX ) records to specify which library file to link with, where XXX is the name of the library. /NODEFAULTLIB tells the linker to ignore the pragmas. This switch lets you control which libraries to link with and in which order. You'll need to specify each necessary library on the linker command line so that your application will link, but at least you'll know exactly which libraries you're getting and in which order you're getting them. Controlling the order in which libraries are linked can be important any time the same symbol is included in more than one library, which can lead to very difficult-to-find bugs. You can set this switch in the project Property Pages dialog box, Linker folder, Input property page, Ignore All Default Libraries property.
/OPT:NOWIN98
If you aren't supporting Windows 9x and Windows Me, you can squeeze a little size out of your executables by not requiring sections to be aligned on 4 K boundaries by using this switch. You can set this switch in the project Property Pages dialog box, Linker folder, Optimization property page, Optimize For Windows98 property.
/ORDER (Put Functions in Order)
After you run Smooth Working Set (Chapter 19), the /ORDER switch allows you to specify the file that contains the order for the functions. /ORDER will turn off incremental linking, so use it only on release builds. You can set this switch in the project Property Pages dialog box, Linker folder, Optimization property page, Function Order property.
/VERBOSE (Print Progress Messages)
/VERBOSE:LIB (Print Libraries Searched Only Progress Messages)
If you're having trouble linking, these messages can show you what symbols the linker is looking for and where it finds them. The output can get voluminous, but it can show you where you're having a build problem. I've used /VERBOSE and /VERBOSE:LIB when I've had an odd crash because a function being called didn't look, at the assembly-language level, anything like I thought it should. It turned out that I had two functions with identical signatures, but different implementations, in two different libraries, and the linker was finding the wrong one. You can set these switches in the project Property Pages dialog box, Linker folder, General property page, Show Progress property.
/LTCG (Link-Time Code Generation)
The companion switch to /GL to perform the cross-compiland optimization. This switch is automatically set when the /GL switch is used.
/RELEASE (Set the Checksum)
Where the /DEBUG switch tells the linker to generate debug code, the misnamed /RELEASE switch does not do the opposite and tell the linker to do an optimized release build link. This switch should really be named /CHECKSUM. All this switch does is set the checksum value in the Portable Executable (PE) header. While required by device drivers in order to load, it's not required by your user-mode applications. However, it's not a bad idea to set it for your release builds because WinDBG, discussed in Chapter 8, will always report if the checksum isn't set for a binary. You shouldn't add /RELEASE to debug builds because it requires that incremental linking be turned off. To set /RELEASE for your release builds, go to the project Property Pages dialog box, Linker folder, Advanced property page, and set the Set Checksum property to Yes (/RELEASE).
/PDBSTRIPPED (Strip Private Symbols)
One of the biggest debugging problems you have at customer sites is getting a clean call stack. The reason you can't get good call stacks is that the stack walking code doesn't have the special frame pointer omission (FPO) data necessary for it to help decipher the current stack. Since the PDB files for your application are what contain the FPO data, you can just ship them to your customers. While that rightfully makes you and your manager nervous, up until Visual C++ .NET you were at a loss for getting those clean call stacks.
If you ever installed the operating system symbols from Microsoft (more on this later in the section "Install the Operating System Symbols and Set Up a Symbol Store"), you probably noticed that the Microsoft supplied symbols gave you the full call stacks without giving away any secrets. What they were doing was stripping the private information, such as variables and source and line information, and just leaving public functions as well as the all-important FPO data.
With the /PDBSTRIPPED switch, you can safely generate the same type of symbols for your application and not have to give away any secrets. Even better news is that the stripped PDB file is generated right alongside the full PDB file, so you'll want to turn on this switch in your release builds. In the project Property Pages dialog box, Linker folder, Debug property page, set the Strip Private Symbols property to the output location and name for the symbol. I always use the string $(OutDir)/ $(ProjectName)_STRIPPED.PDB so that it's obvious which PDB file is the stripped version. If you do send your stripped PDB files out to a customer site, make sure to remove the "_STRIPPED" on the name so that tools such as Dr. Watson will load them.
Design a Lightweight Diagnostic System for Release Builds
The bugs I hate the most are those that happen only on the machines of one or two users. Every other user is merrily running your product, but one or two users have something unique going on with their machines—something that is almost impossible to figure out. Although you could always have the user ship the misbehaving machine to you, this strategy isn't always practical. If the customer is in the Caribbean, you could volunteer to travel there and debug the problem. For some reason, however, I haven't heard of too many companies that are that quality conscious. Nor have I heard of many developers who would volunteer to go to the Arctic Circle to fix a problem either.
When you do have a problem situation that occurs on only one or two machines, you need a way to see the program's flow of execution on those machines. Many developers already track the flow of execution through logging files and writing to the event log, but I want to stress how important that log is to solving problems. The problem-solving power of flow logging increases dramatically when the whole team approaches tracking the program's flow of execution in an organized fashion.
When logging your information, following a template is especially important. With the information in a consistent format, developers will find it much easier to parse the file and report the interesting highlights. If you log information correctly, you can record tons of information and have scripts written in Perl or another language pull out the significant items so that you don't need to spend 20 minutes reading a text file just to track down one detail.
What you need to log is mostly project-dependent, but at a minimum, you should definitely log failure and abnormal situations. You also want to try to capture a logical sense of the program operation. For example, if your program is performing file operations, you wouldn't want to log fine-grained details such as "Moving to offset 23 in the file," but you would want to log the opening and closing of the file so that if the last entry in the log is "Preparing to open D:\Foo\BAR.DAT," you know that BAR.DAT is probably corrupt.
The depth of the logging also depends on the performance hit associated with the logging. I generally log everything I could possibly want and keep an eye on the release-build performance when not logging. With today's performance tools, you can quickly see whether your logging code is getting in the way. If it is, you can start to back off on the logging a little bit until you strike enough of a balance that you get sufficient logging without slowing down the application too much. The "what" to log is the hard part. In Chapter 3 I discuss the code necessary to log in managed applications, and in Chapter 18 I show how to do high-speed tracing in native applications with minimal effort. Another technology you might want to look at is the very fast but misnamed Event Tracing system, which is built into Windows 2000 and later. You can find more information at http:// msdn.microsoft.com/library/default.asp?url=/library/en-us/perfmon/base/event_tracing.asp.
|
EAN: 2147483647
Pages: 177