Performance-Monitoring Perspectives
Before we learn about exposing performance information in our applications, I want to explain the basic performance-monitoring facilities that Windows offers. You can examine performance monitoring from several perspectives, and I'd like to discuss a few of them.
Let's begin by examining performance monitoring from a user perspective. I'll explain how the system organizes performance information and how administrators, users, and developers can use the System Monitor ActiveX control to gauge system health.
I'll then discuss some of the more common reasons developers incorporate performance monitoring into their applications (or more likely, into a Windows service). With this introductory material out of the way, I'll get more technical and discuss the Windows performance-monitoring architecture from a system and programmer perspective.
Performance Monitoring from a User Perspective
Included with Windows is an ActiveX control, named the System Monitor control, that allows administrators to view performance information. Since I'm amazed daily by the number of people who are unfamiliar with this control, I'll start out with a brief introduction.
To experiment with this ActiveX control, you can choose Performance from the Administrative Tools menu, or you can add the ActiveX control to a Microsoft Management Console (MMC) by doing the following:
- Run the Microsoft Management Console application (MMC.exe).
- From the Console menu, select Add/Remove Snap-In, and then click the Add button.
- In the Add Standalone Snap-In dialog box, select ActiveX Control, and then click the Add button.
- In the start screen of the Insert ActiveX Control wizard, click the Next button.
- Select the System Monitor Control and click the Next button, followed by the Finish button.
- In the Add Standalone Snap-In dialog box, click the Close button.
- In the Add/Remove Snap-In dialog box, click OK.
- Select the System Monitor Control node in the left-hand pane.
Figure 7-1 shows how the MMC window should look if you have done everything correctly.
Initially, the System Monitor control has no idea what performance information you would like to monitor, so its chart is empty. To add information to the chart, you must display the Add Counters dialog box (shown in Figure 7-2) by clicking the Add (+) button on the toolbar. As you can see, many options are available for the user to select. I'm going to explain these options now so that you'll understand how all this information fits together when I discuss performance counters later in this chapter.
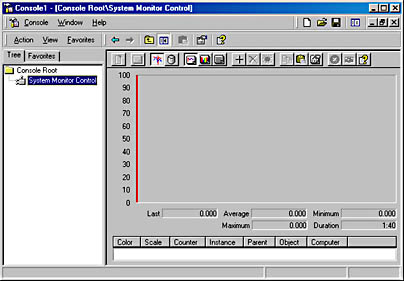
Figure 7-1. The System Monitor control in MMC

Figure 7-2. The Add Counters dialog box for the System Monitor control
Your first decision is which computer to collect performance information from. One of the System Monitor control's best features is its ability to collect performance information from the local machine as well as a remote machine. In fact, information from both machines can be collected simultaneously and displayed in a single graph. This makes it very easy for an administrator to compare the performance of two or more computers.
Once you have chosen a computer, you then select a performance object. A performance object is a component in the system offering performance information. Out of the box, Windows exposes many objects, most of which are system related. Here are a few examples of system objects: Processor (the CPU itself), Process (the applications currently running), PhysicalDisk (the hard disks), System (the operating system itself), Thread (the threads running in processes), and Memory (RAM).
Bear in mind that performance monitoring is not limited to operating system components; device drivers are also able to expose their own performance objects. Telephony and TCP are some examples of device driver objects. All these objects are of particular use when configuring Windows on a computer.
Microsoft was not shortsighted in its design of the performance-monitoring system: the system also allows services and applications to expose their own performance objects. Some service examples include the Indexing Service and the Distributed Transaction Coordinator (DTC). How to expose performance objects from a service or application constitutes the bulk of this chapter.
The designer of a performance object also defines what counters that object supports. For example, in the Add Counters dialog box, the Process object offers a choice of several counters (visible in the Select Counters From List list box). Each entry in the list box indicates one item you can monitor about a process. For example, the % Processor Time counter will show you the percentage of time that threads within a process are actually running on a processor. The Handle Count counter shows how many kernel objects a process has open. The ID Process counter shows the system-wide unique ID that was assigned to a process when it was created. These counters represent just a sampling of the counters available for a Process object.
Having selected a performance object, you can now turn your attention to the Select Instances From List portion of the dialog box. An instance is a name given to an instance of an object type. For example, there are many instances of Process objects running in the system; each Process object instance is identified by its .exe file name. Most objects support instances, but some do not. For example, the System object shows no entries in the Select Instances From List portion of the dialog box because only one operating system is running on the computer.
Figure 7-3 shows the relationships between objects, instances, and counters. On the left, you see an object that supports instances; it might have zero or more instances currently associated with it. Each of these instances has the same number of counters, but the values of the counters will differ from instance to instance. Keep in mind that if an object that supports instances has no instances currently associated with it, no counter information can be obtained.
The object on the right does not support instances; it will always have one set of counters associated with it.
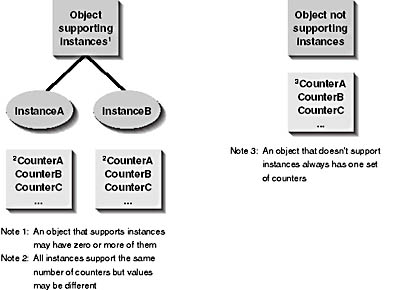
Figure 7-3. The relationships between objects, instances, and counters
As you navigate the Add Counters dialog box, you'll see that many objects are available, each with its own set of counters with cryptic names. If you click the Explain button in the dialog box, a separate window appears (shown in Figure 7-4) that offers a description of the currently selected counter.

Figure 7-4. The Explain Text window, which provides additional information about a performance counter
Windows actually allows explanatory text to be associated with a performance object itself in addition to its counters. However, at present the System Monitor control doesn't offer any way to display an object's Help text. I'm hoping that Microsoft will enhance the control in the future.
After selecting a computer, object, counter(s), and instance(s) (if applicable), click the Add button to have the System Monitor control start charting the specified information. The Add Counters dialog box will not close when you click the Add button, so you can easily add multiple counters to the chart. Keep in mind that when you are adding counter information to the chart, you can select multiple instances as well as multiple counters by using the Shift and Ctrl keys. The number of lines that will be charted is the product of the number of instances times the number of counters. Once you're finished adding counters, click the Close button.
By the way, you'll notice that some multi-instance objects support a pseudo-instance named _Total. This pseudo-instance is not actually an instance of the object, but a value that allows you to conveniently see the counter total for all instances of the object. For example, selecting the _Total instance for the Page Faults/sec counter of the Process object causes the chart to show the Page Faults/sec for all processes.
Be aware that displaying a total makes no sense for some counters. For example, if you were to chart the process ID for all process instances, you would see that the counter simply shows a value of 0, which never changes.
Performance Monitoring from a Designer Perspective
The reasons to consider adding performance counter information to your own applications and servers are manifold. First and foremost, you want to make it easy for administrators and help desk people to check on the health of a computer system. Further, the end users of most applications do not want to be bogged down by statistical information that is meaningless to them. It's far more expedient to use performance counters to expose information; that way, the people who can do something with the information can easily gain access to it. Also, Windows makes the performance information available across the network. As I mentioned in the previous section, a person using the System Monitor control can select which computer the information is to be collected from. Using Windows built-in performance monitoring to expose your application's performance information allows the information to be remotely accessible without any additional work from you.
One very important issue that turns a lot of people off to performance monitoring is, ironically, that of performance. Performance monitoring is not free. Somewhere inside your application, you need to allocate a block of memory to store current counter data, and your code must periodically update these values. Updating these values means that your code is going to be larger and will execute more slowly, something we always try to avoid. However, if performance monitoring affected the system drastically, no one would use it, and Microsoft certainly took this into account when designing performance monitoring into the system.
When designing performance information for your own applications, decide carefully what it is you want to monitor. If, for example, you have a tight calculation loop, you should avoid updating counters while inside this loop. On the other hand, you might be writing the server-side of a client/server application. In this case, you might want to have a performance counter that tracks how many clients have connected, how many clients are currently connected, the number of bytes received per client, the number of bytes sent per client, what types of requests your clients are making, and so on. In fact, Microsoft Internet Information Services (IIS) keeps track of exactly this type of information.
Performance monitoring can be a powerful tool for software developers. I've used performance counters to monitor how much dynamic memory my applications allocate and free up. If I'm forgetting to free memory, the System Monitor control shows my memory usage line as always increasing. Developers and testers alike can use performance counters to easily monitor whether an application is behaving correctly.
To demonstrate performance monitoring, I wanted to present a sample program that created a Stock object. This object would have one instance in it for each stock symbol, and the counters would be information about the stock—for example, last price, high price, low price, and P/E ratio. Using the System Monitor control, you could select the stocks and counters that you're interested in, and the application would connect over the Internet to gather this information and make it available using the System Monitor control's charting. Unfortunately, I could not find an Internet site that would allow me to legally produce a derivative work from its stock ticker information. So, although I'm presenting a different sample application in this chapter, the Stock object concept should give you a good idea of the possibilities inherent in Windows performance monitoring.
EAN: 2147483647
Pages: 126