EER
| < Day Day Up > |
DefinitionThe EER is defined as the crossover point on a graph that has both the FAR and FRR curves plotted. The EER can also be calculated from a receiver operating characteristic (ROC) curve, which plots FAR against FRR to determine a particular device's sensitivity and accuracy. The choice of using the crossover point of the FRR/FAR or using a ROC is a question of significance. An EER calculated using the FRR and FAR is susceptible to manipulation based on the granularity of threshold values. A ROC-based EER is not affected by such manipulations because the FRR and FAR are graphed together. Thus, the EER calculated using a ROC is less dependent on scaling. [2]
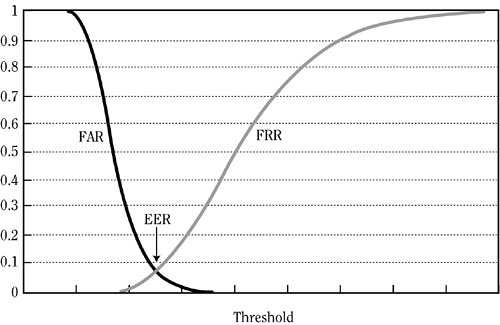
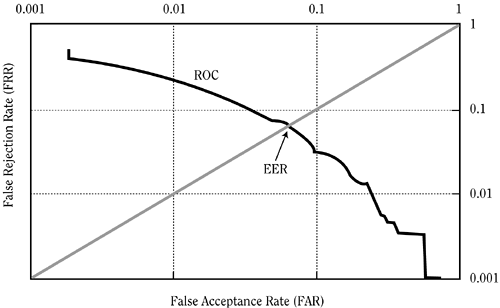
The Simple MathTo calculate the EER using the FRR/FAR crossover, the following is done: For any given threshold value from 0 to 1, respective FAR and FRR are calculated and plotted on the same graph. Since the granularity used for the values between 0 and 1 can be selected, this introduces the possibility of manipulating the results. A sample graph would look like Figure 10-1. Figure 10-1. Calculating EER from FAR “ FRR intersection. As you can see from the graph, the EER occurs where the two lines cross. To calculate the ROC of a biometric system, each corresponding FAR and FRR point is plotted on a logarithmic scale (Figure 10-2). The EER is then found by extending a 45-degree line from the point of origin (0,0). Where this line crosses the ROC is the EER. This happens because when the FRR has a value of 1, the FAR has a value of 0, and when the FRR has a value of 0, the FAR has a value of 1. Figure 10-2. Calculating EER from a ROC curve. Why Is This Important?The strength of the EER is that it gives a comparison of different biometric systems. That is, since biometric systems in general do not always offer the same threshold settings, it would be difficult to compare apples to apples. Thus, in comparing a normalized statistic like the EER, we can try to get some relative comparison of two biometric systems. |
| < Day Day Up > |
EAN: 2147483647
Pages: 123

