Mac OS X Server provides a variety of statistics for monitoring the Apache Web service. Using the Server Admin tool, you can monitor each Web site individually or the Web server as a whole. The information provided by the monitoring tools is invaluable for troubleshooting connection problems and determining if resources are being properly used.
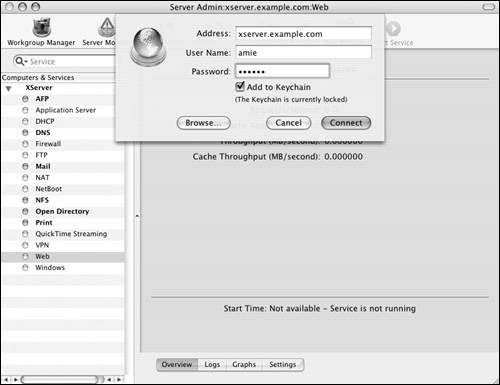
1. | Launch the Server Admin tool located in /Applications/Server, and authenticate as the administrator (Figure 9.88).
|
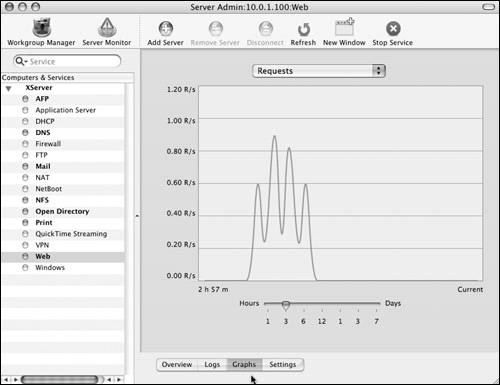
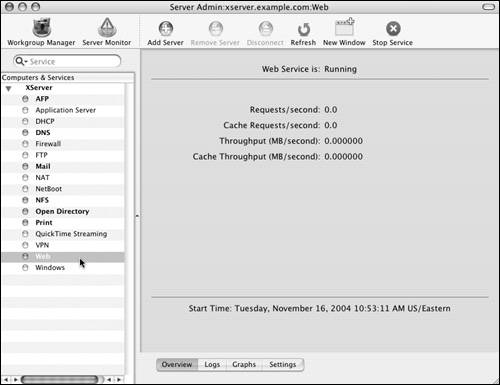
2. | Select the Web service for your server in the Computers & Services list (Figure 9.89).

|
3. | Click the Graphs tab  . .
The Graphs frame defaults to requests per second (Figure 9.90).
|
4. | Use the slider below the graph to manipulate the graph's sample timeframe.
|
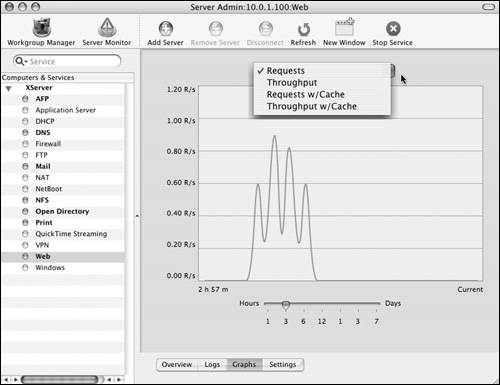
5. | Click the pop-up menu to select any of the other graphs (Figure 9.91):
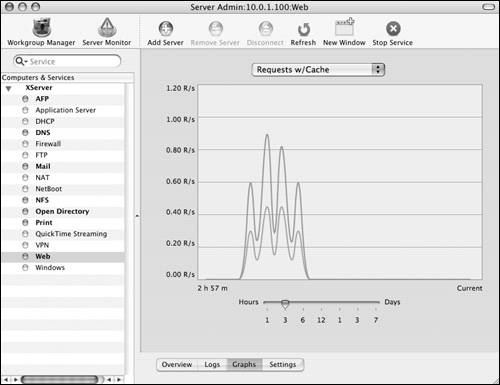
The graphs that include the performance cache show two series; the lower series is the cache results (Figure 9.92).
|
Although performance graphs in the Server Admin tool are nice to look at, the real business of Web site monitoring is in the log files. The Apache Web server is renowned for the extensive detailed information available in its log files. You can even modify the log-file formatting to meet your specific needs.
1. | Launch the Server Admin tool located in /Applications/Server, and authenticate as the administrator (Figure 9.94).
|
2. | Select the Web service for your server in the Computers & Services list (Figure 9.95).
|
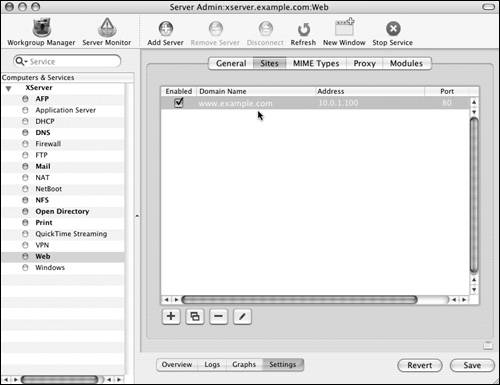
3. | Click the Settings button  and then the Sites tab and then the Sites tab  . .
|
4. | In the Sites list, double-click the Web site you wish to configure (Figure 9.96).
|
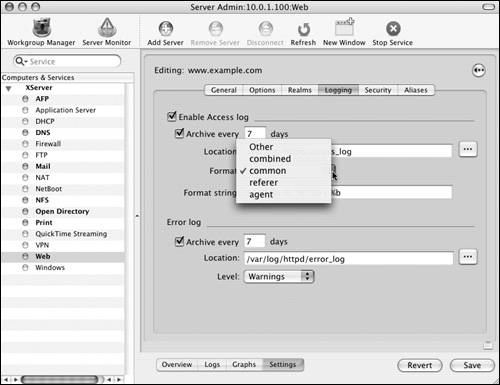
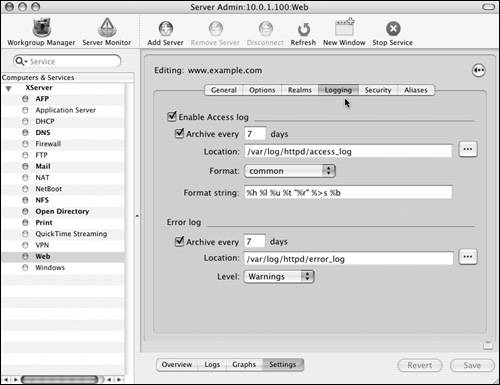
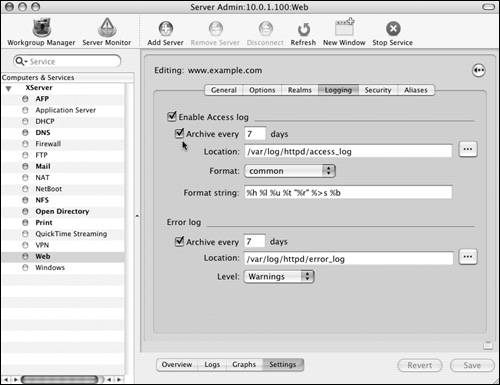
5. | If it isn't already selected, click the Logging tab  to see this Web site's log settings. to see this Web site's log settings.
The Logging frame shows settings for both the Access and Error logs. For every site, there is an Error log that can't be disabled and an Access log that is enabled by default (Figure 9.97).
|
6. | Select the Archive option, and enter the number of days between archives in the appropriate fields (Figure 9.98).
Neither the Access nor Error log is archived by default, and log files can become large on busy servers.
|
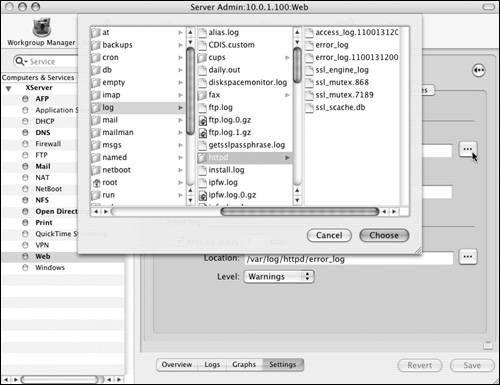
7. | To specify a custom location for the log files, do either of the following:
|
8. | To modify the Access log format string, do either of the following:
|
9. | To modify the Error log, click the Level pop-up menu and pick a log level (Figure 9.101).
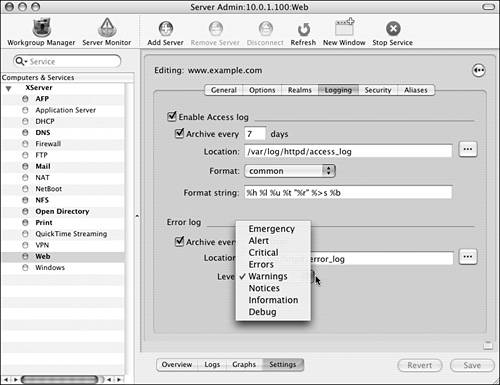
Levels range from Emergency, which provides the least logging; to Debug, which provides the most logging.
|
10. | When you've finished making changes, click the Save button  . .
|
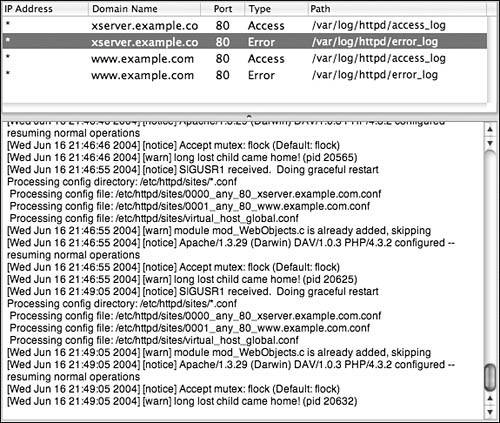
11. | To view the logs, click the Logs tab  . .
Notice that each Web site has its own Access and Error log. Select the log file you wish to view in the top list, and it appears in the pane below (Figure 9.102).
|
 Tips
Tips