Performance Server
| The purpose of the Performance Server is to analyze network data in order to:
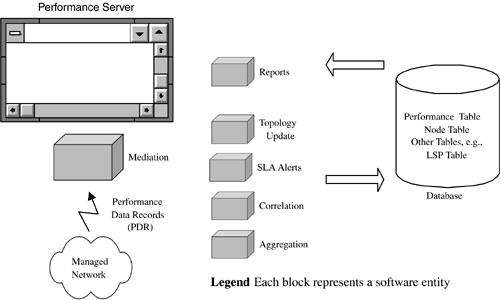
The Performance Server faces into the network and receives asynchronously generated NE data. It can also proactively retrieve from MIBs data such as the level of bandwidth consumption. Performance data, for example, the number of IP packets received by an LER, may change very rapidly . For this reason, performance data is often automatically generated and emitted by NEs rather than being polled. The number of IP packets landing at an MPLS LER ingress interface may be hundreds of thousands per second. For data such as this, the NE generally periodically creates a data record and emits it to a listening application (in this case, the Performance Server). In this discussion, we focus on the data issued by the NEs and the way this is processed and used by the Performance Server. Also, SLAs are introduced. Figure 6-7 illustrates a possible structure for a Performance Server. Figure 6-7. Performance Server components . MediationWe introduced mediation in this chapter and the previous one in the context of billing. It is a process of analyzing the raw data generated by NEs to produce standard format billing details. Mediation can also be applied to performance data to produce sanitized details for downstream use by third-party applications. AggregationThis is the process by which separate performance data records are combined. An example is an ATM SPVCC that spans a number of NEs. A given virtual circuit has certain performance parameters of interest:
Similarly, the performance details of other objects may be of interest:
Aggregation logically joins up the separate performance data records so that the relevant managed objects can be analyzed . An example is a count of all the cells transmitted by an ATM interface; at time T1 the number of cells may be x , and later at time T2 the number of cells may be x + y . Aggregation links this data together and stores it. CorrelationThe aggregated data is then correlated with the associated managed objects in readiness for reporting. Examples of correlated data are (for a single customer):
These data should help give a clear picture of the performance of the underlying objects. ReportsReports are the means by which end users can view the performance details. Examples of reports are:
Reports may be viewed by the network operator and may be accessible to customers via the Web. Important aspects of performance reports are:
Baseline measures are essential for effective performance management. This is a set of readings taken from the network during normal operation. As the network changes ”for example, due to link failure, variations in traffic mix, or increased traffic ”the baseline changes with it. The extent of the deviation is important for planning changes or additions to the network. It may also help to pinpoint problems before they become service-affecting. SLA AlertsIt is very important for enterprises to avoid violating SLA terms because there may be financial penalties ”particularly when the network management processes have been outsourced. SLA alerts can be issued based on ongoing analysis of trends in an effort to pre-empt violations before they actually occur. An example SLA is illustrated in Table 6-3. Table 6-3. An IP SLA
This SLA indicates that IP traffic from 10.81.1.45 port 444 will land in the SP network on a 10Mbps link destined for 10.81.2.89 port 445. The interpacket arrival time is specified to be no more than 1 millisecond with no packets arriving out of order. A tunneling technology such as MPLS or L2TP could be employed to achieve the latter. An SLA alert might be raised in the Performance Server if the link bandwidth increased up to or beyond 9.9Mbps. Topology UpdatePerformance Server data changes (such as detection of a congested link) will be of interest to clients , and it may be necessary for a topology update to occur after changes such as the following:
These are important because, left unattended, they can have a serious impact on the network. Performance Server Database TablesPerformance data can be related to the associated managed object; for example, there can be separate tables for each of the following:
Each of these tables can have separate columns for the relevant performance data, such as:
The rows and columns of these tables are populated by the components of the Performance Server. Alternatively, the other servers can share the above tables. |
EAN: 2147483647
Pages: 150
