Locking Contention and Deadlocks
Locking Contention and DeadlocksIn the grand scheme of things, the most likely culprits of SQL Server application performance problems are typically poorly written queries, poor database and index design, and locking contention. Whereas the first two problems will result in poor application performance regardless of the number of users on the system, locking contention becomes more of a performance problem the greater the number of users. It is further compounded by increasingly complex or long-running transactions. Locking contention occurs when a transaction requests a lock type on a resource that is incompatible with an existing lock type on the resource. By default, the process will wait indefinitely for the lock resource to become available. Locking contention is noticed in the client application by the apparent lack of response from SQL Server. Figure 38.11 demonstrates an example of locking contention. Process 1 has initiated a transaction and acquired an exclusive lock on page 1:325. Before Process 1 can acquire the lock that it needs on page 1:341 to complete its transaction, Process 2 acquires an exclusive lock on page 1:314. Until Process 2 commits or rolls back its transaction and releases the lock on Page 1:341, the lock will continue to be held. Because this is not a deadlock scenario (which will be covered in the "Deadlocks" subsection later in this section), SQL Server takes no action. Process 1 simply waits indefinitely. Figure 38.11. Locking contention between two processes. Identifying Locking ContentionWhen a client application appears to freeze after submitting a query, it often is due to locking contention. To identify locking contention between processes, you can use Enterprise Manager as discussed earlier in this chapter in the "Monitoring Lock Activity in SQL Server" section, or the system-stored procedures sp_who and sp_lock .
To identify whether a process is being blocked, you can examine the blk column in the output from sp_who : exec sp_who go spid ecid status loginame hostname blk dbname cmd ---- ------ ------------ -------- ----------- --- ------ ---------------- 1 0 sleeping sa 0 NULL LOG WRITER 2 0 background sa 0 NULL LOCK MONITOR 3 0 background sa 0 NULL LAZY WRITER 4 0 background sa 0 NULL SIGNAL HANDLER 5 0 background sa 0 NULL TASK MANAGER 6 0 background sa 0 NULL TASK MANAGER 7 0 sleeping sa 0 NULL CHECKPOINT SLEEP 8 0 background sa 0 NULL TASK MANAGER 9 0 background sa 0 NULL TASK MANAGER 10 0 background sa 0 NULL TASK MANAGER 11 0 background sa 0 NULL TASK MANAGER 12 0 background sa 0 NULL TASK MANAGER 13 0 background sa 0 NULL TASK MANAGER 52 0 sleeping sa RRANKINSA20P 0 bigpubs2000 AWAITING COMMAND 55 0 sleeping sa RRANKINSA20P 52 bigpubs2000 SELECT If the value in the blk column is 0, then no blocking is occurring for that session. If the value is anything non-zero , the session is being blocked and the number in the blk column is the spid of the process that is causing the blocking. In the previous example, you can see process 52 blocking process 55. To determine what table, page, or rows are involved, and at what level the blocking is occurring, you can use the sp_lock stored procedure: exec sp_lock go spid dbid ObjId IndId Type Resource Mode Status ------ ------ ----------- ------ ---- ---------------- -------- ------ 51 4 0 0 DB S GRANT 52 8 0 0 DB S GRANT 52 8 1685581043 0 TAB IX GRANT 52 8 1685581043 1 PAG 1:5798 IX GRANT 52 8 1685581043 1 KEY (37005ad7376d) X GRANT 53 1 85575343 0 TAB IS GRANT 53 8 0 0 DB S GRANT 55 8 0 0 DB S GRANT 55 8 1685581043 1 PAG 1:5798 IS GRANT 55 8 1685581043 0 TAB IS GRANT 55 8 1685581043 1 KEY (37005ad7376d) S WAIT From this output, you can see that process 55 is waiting for a Shared (S) lock on the key for the object whose ID is 1685581043 and whose index ID is 1 (indicating that this is a data or index row in a clustered index). Process 52 has an Exclusive (X) lock granted on the same key resource (Resource = (37005ad7376d)). To identify the name of the table, you can use the object_name() function, running it in the database in which the object resides: select db_name(8) go ---------------------------------- bigpubs2000 use bigpubs2000 go select object_name(1685581043) go ---------------------------------- stores When the IndId in the sp_lock output is 1 and the Type is KEY , it is not clear whether the lock is on a nonleaf index row or a data row. You can determine this by examining the page header for the corresponding page using the DBCC PAGE command and passing it the dbid, the file ID, and the page number. (For more information on using DBCC PAGE , see Chapter 33.) dbcc traceon(3604) dbcc page (8, 1, 5798) go DBCC execution completed. If DBCC printed error messages, contact your system administrator. PAGE: (1:5798) -------------- BUFFER: ------- BUF @0x18FA6640 --------------- bpage = 0x20672000 bhash = 0x00000000 bpageno = (1:5798) bdbid = 8 breferences = 85 bstat = 0xb bspin = 0 bnext = 0x00000000 PAGE HEADER: ------------ Page @0x20672000 ---------------- m_pageId = (1:5798) m_headerVersion = 1 m_type = 1 m_typeFlagBits = 0x0 m_level = 0 m_flagBits = 0x0 m_objId = 1685581043 m_indexId = 0 m_prevPage = (0:0) m_nextPage = (1:5797) pminlen = 15 m_slotCnt = 20 m_freeCnt = 6769 m_freeData = 1383 m_reservedCnt = 0 m_lsn = (555:1135:3) m_xactReserved = 0 m_xdesId = (0:0) m_ghostRecCnt = 0 m_tornBits = 0 Allocation Status ----------------- GAM (1:2) = ALLOCATED SGAM (1:3) = NOT ALLOCATED PFS (1:1) = 0x40 ALLOCATED 0_PCT_FULL DIFF (1:6) = CHANGED ML (1:7) = NOT MIN_LOGGED DBCC execution completed. If DBCC printed error messages, contact your system administrator. If you look at the value for m_indexId , you can determine whether the lock is on an index page or a data page. If m_indexId is 0, then it is a data page. If m_indexId is 1, then the lock is on a nonleaf clustered index page. Finally, you might also want to know which commands were last executed by the sessions involved in the locking contention. This can be determined by using the DBCC INPUTBUFFER command and passing it the spid for each process involved: dbcc traceon(3604) dbcc inputbuffer (52) go EventType Parameters EventInfo -------------- ---------- ----------------------------------------------------- Language Event 0 begin tran INSERT INTO stores(stor_id, stor_name, stor_address, city, state, zip) VALUES('7200', 'my store', 'noplace', 'nowhere', 'NW', '00000') dbcc traceon(3604) dbcc inputbuffer (55) go EventType Parameters EventInfo -------------- ---------- ----------------------------------------------- Language Event 0 select * from stores where stor_id = '7200' Setting the Lock Timeout IntervalIf you do not want a process to wait indefinitely for a lock to become available, SQL Server allows you to set a lock timeout interval using the SET LOCK_TIMEOUT command. The timeout interval is specified in milliseconds. For example, if you want your processes to wait only 5 seconds (5,000 milliseconds ) for a lock to become available, execute the following command in the session: SET LOCKTIMEOUT 5000 If your process requests a lock resource that cannot be granted within 5 seconds, the statement will be aborted with the following error message: Server: Msg 1222, Level 16, State 54, Line 1 Lock request time out period exceeded. To examine the current LOCK_TIMEOUT setting, you can query the system function @@LOCK_TIMEOUT : select @@lock_timeout go ----------- 5000 If you want processes to abort immediately if the lock cannot be granted (in other words, no waiting at all), set the timeout interval to . If you want to set the timeout interval back to infinity, execute the SET_LOCK_TIMEOUT command and specify a timeout interval of -1 . Minimizing Locking ContentionAlthough setting the lock timeout prevents a process from waiting indefinitely for a lock request to be granted, it doesn't address the cause of the locking contention. In an effort to maximize concurrency and application performance, you will want to minimize locking contention between processes as much as possible. Some general guidelines to follow to minimize locking contention include the following:
DeadlocksA deadlock is a scenario that occurs when two processes are waiting for a locked resource that the other process currently holds. Neither process can move forward until it receives the requested lock on the resource, and neither process can release the lock it currently is holding until it can receive the requested lock. Essentially, neither process can move forward until the other one completes, and neither one can complete until it can move forward. Two primary types of deadlocks can occur in SQL Server: cycle deadlocks and conversion deadlocks. A cycle deadlock occurs when two processes acquire locks on different resources, and then need to acquire a lock on the resource that the other process has. Figure 38.12 demonstrates an example of a cycle deadlock. Figure 38.12. Example of a cycle deadlock. In Figure 38.12, Process 1 acquires an exclusive lock on page 1:201 in a transaction. At the same time, Process 2 acquires an exclusive lock on page 1:301 in a transaction. Process 1 then attempts to acquire a lock on page 1:301 and begins waiting for the lock to become available. Simultaneously, Process 2 requests an exclusive lock on page 1:201 and a deadlock, or " deadly embrace" occurs. A conversion deadlock occurs when two or more processes each hold a shared lock on the same resource within a transaction and each wants to promote the shared lock to an exclusive lock, but neither can do so until the other releases the shared lock. An example of a conversion deadlock is shown in Figure 38.13. Figure 38.13. Example of a conversion deadlock. SQL Server automatically detects when a deadlock situation occurs. A separate process in SQL Server, called the LOCK_MONITOR, checks the system for deadlocks roughly every 5 seconds. In the first pass, this process detects all the processes that are waiting on a lock resource. The LOCK_MONITOR thread checks for deadlocks by examining the list of waiting lock requests to see if any circular lock requests exist between the processes that are holding locks and the processes that are waiting for locks. When the LOCK_MONITOR detects a deadlock, SQL Server aborts the transaction of one of the involved processes. How does SQL Server determine which process to abort? It attempts to choose as the deadlock victim the process that has accumulated the least amount of CPU time since the start of its session. In some cases, certain operations are marked as unkillable and cannot be chosen as the deadlock victim. One such example is a process that involves rolling back a transaction. This process cannot be chosen as a deadlock victim because the changes being rolled back could be left in an indeterminate state, which could lead to data corruption. You can influence which process will be the deadlock victim by using the SET DEADLOCK_PRIORITY statement. If you have lower priority processes that would prefer to be chosen as the deadlock victims, you can set the process's deadlock priority to LOW . When this process is detected in a deadlock situation, it will automatically be chosen as the deadlock victim if the other process's deadlock priority is NORMAL . Currently, SQL Server does not have an option to set the deadlock priority to HIGH to specify processes that should always come out as the winner in a deadlock scenario. It is often assumed that deadlocks happen at the data page or data row level. In fact, deadlocks often occur at the index page level. Figure 38.14 depicts a scenario in which a deadlock occurs due to contention at the index page level. Figure 38.14. Deadlocks due to locks on index pages. Avoiding DeadlocksAlthough SQL Server automatically detects and handles deadlocks, you will want to try to avoid deadlocks in your applications. When a process is chosen as a deadlock victim, it has to resubmit its work again because it has been rolled back. Frequent deadlocks create performance problems if you have to keep repeating work. You can follow a number of guidelines to minimize, if not completely eliminate, the number of deadlocks that occur in your application(s). Following the guidelines presented earlier to minimize locking contention and speed up your transactions will also help to eliminate deadlocks. The less time for which a transaction is holding locks, the less likely the transition will be around long enough for a conflicting lock request to be requested at the same time. In addition, you might want to follow this list of additional guidelines when designing your application:
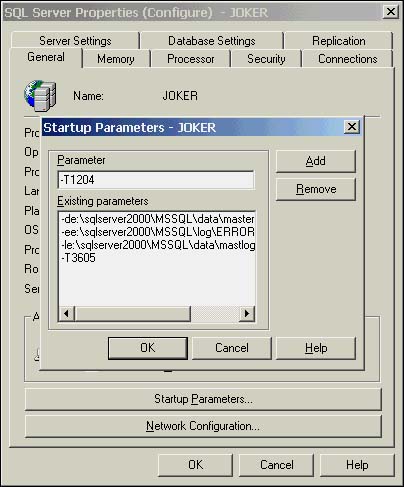
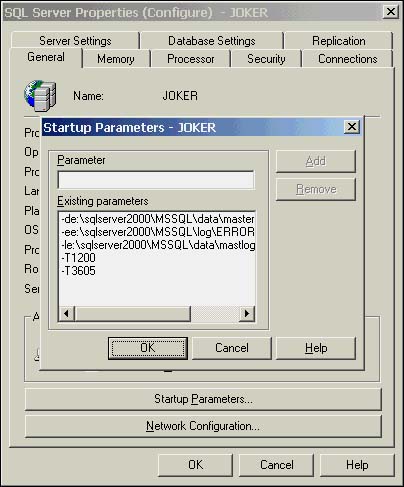
Handling and Examining DeadlocksSQL Server returns an error number 1205 to the client when it aborts a transaction as a result of deadlock. Because a deadlock is not a logical error, but merely a resource contention issue, the client can resubmit the entire transaction. To handle deadlocks in your applications, be sure to trap for message 1205 in your error handler. When a 1205 error occurs, the application can simply resubmit the transaction automatically. It is considered bad form to allow end users of an application to see the deadlock error message returned from SQL Server. Earlier in this chapter, you learned how to use sp_lock and sp_who to monitor locking contention between processes. However, when a deadlock occurs, one transaction is rolled back and one is allowed to continue. If you were to examine the output from sp_lock and sp_who after a deadlock occurs, the information likely would not be useful because the locks on the resources involved have since been released. Fortunately, SQL Server provides a couple of trace flags to monitor deadlocks within SQL Server. Use the DBCC TRACEON command to turn on the trace flags and DBCC_TRACEOFF to turn them off. To have SQL Server write the output from the deadlock trace flags to the error log for further analysis, first execute the DBCC TRACEON(3605) command. The following is an example of setting the 1204 trace flag: dbcc traceon(3605) dbcc traceon(1204) Optionally, you can also set the trace flags on whenever SQL Server is started up by adding the “T option with the appropriate trace flag value to the SQL Server startup parameters. For example, to have SQL Server turn on the 1204 trace flag automatically on startup, bring up the Server Properties dialog box in Enterprise Manager. On the General tab, click the Startup Parameters button. This brings up the dialog box shown in Figure 38.15. Type “T1204 in the Parameter box, click Add, and then click OK to save the changes. Do the same to add the 3605 trace flag option as well, or no output from the 1204 trace flag will be sent to the errorlog. Figure 38.15. Setting the 1204 trace flag to be enabled on SQL Server startup.
The 1204 Trace FlagTrace flag 1204 prints useful information to the SQL Server error log when a deadlock is detected. Listing 38.2 presents a sample of the output from the error log for this trace flag. Listing 38.2 Sample Output for the 1204 Trace Flag When a Deadlock OccursDeadlock encountered .... Printing deadlock information 2001-08-27 05:35:01.40 spid2 2001-08-27 05:35:01.40 spid2 Wait-for graph 2001-08-27 05:35:01.40 spid2 2001-08-27 05:35:01.40 spid2 Node:1 2001-08-27 05:35:01.40 spid2 PAG: 8:1:5798 CleanCnt:2 Mode: S Flags: 0x2 2001-08-27 05:35:01.40 spid2 Grant List:: 2001-08-27 05:35:01.40 spid2 Owner:0x2c3cabe0 Mode: S Flg:0x0 Ref:0 Life:02000000 SPID:55 ECID:0 2001-08-27 05:35:01.40 spid2 SPID: 55 ECID: 0 Statement Type: DELETE Line #: 1 2001-08-27 05:35:01.40 spid2 Input Buf: Language Event: delete from stores where stor_id = '7200' 2001-08-27 05:35:01.40 spid2 Requested By: 2001-08-27 05:35:01.40 spid2 ResType:LockOwner Stype:'OR' Mode: IX SPID: 52 ECID:0 Ec:(0x193a7500) Value:0x2c3cabc0 Cost:(0/0) 2001-08-27 05:35:01.40 spid2 2001-08-27 05:35:01.40 spid2 Node:2 2001-08-27 05:35:01.40 spid2 PAG: 8:1:5798 CleanCnt:2 Mode: S Flags: 0x2 2001-08-27 05:35:01.40 spid2 Grant List:: 2001-08-27 05:35:01.40 spid2 Owner:0x2b1b9c00 Mode: S Flg:0x0 Ref:0 Life:02000000 SPID:52 ECID:0 2001-08-27 05:35:01.40 spid2 SPID: 52 ECID: 0 Statement Type: DELETE Line #: 1 2001-08-27 05:35:01.40 spid2 Input Buf: Language Event: delete from stores where stor_id = '7200' 2001-08-27 05:35:01.40 spid2 Requested By: 2001-08-27 05:35:01.40 spid2 ResType:LockOwner Stype:'OR' Mode: IX SPID: 55 ECID:0 Ec:(0x2ac59500) Value:0x265083e0 Cost:(0/0) 2001-08-27 05:35:01.40 spid2 Victim Resource Owner: 2001-08-27 05:35:01.40 spid2 ResType:LockOwner Stype:'OR' Mode: IX SPID: 55 ECID:0 Ec:(0x2ac59500) Value:0x265083e0 Cost:(0/0) Although the 1204 output is somewhat cryptic, it is not too difficult to read. If you look through the output, you can see where it lists the SPID s of the processes involved in the deadlock, the type of statement involved ( Statement Type ) and the actual text of the query ( Input Buf ) that each process was executing at the time the deadlock occurred. The output also displays the locks granted to each process ( Grant List ), as well as the lock resources requested by the deadlock victim. The output might also display the page information ( PAG ) on the pages involved. In this case, the output is showing that the deadlock occurred in database ID (8), the file ID (1), and the actual page ID (5798). The 1205 Trace FlagThe 1205 trace flag provides further insight into the LOCK_MONITOR process and how it searches for deadlock situations and displays the information when the deadlock is encountered. Notice how the deadlock search is performed every 5 seconds and only blocking locks are detected until the actual deadlock is encountered. At this point, no blocking locks remain . An example of the output generated by the 1205 trace flag is shown in Listing 38.3. Listing 38.3 Sample Output for the 1205 Trace Flag2001-08-27 05:20:46.40 spid2 ---------------------------------- 2001-08-27 05:20:46.40 spid2 Starting deadlock search 2682 2001-08-27 05:20:46.40 spid2 Target Resource Owner: 2001-08-27 05:20:46.40 spid2 ResType:LockOwner Stype:'OR' Mode: IX SPID:52 ECID:0 Ec:(0x193a7500) Value:0x2c3cabe0 2001-08-27 05:20:46.40 spid2 Node:1 ResType:LockOwner Stype:'OR' Mode: IX SPID:52 ECID:0 Ec:(0x193a7500) Value:0x2c3cabe0 2001-08-27 05:20:46.40 spid2 2001-08-27 05:20:46.40 spid2 End deadlock search 2682 ... a deadlock was not found. 2001-08-27 05:20:46.40 spid2 ---------------------------------- 2001-08-27 05:20:51.40 spid2 ---------------------------------- 2001-08-27 05:20:51.40 spid2 Starting deadlock search 2683 2001-08-27 05:20:51.40 spid2 Target Resource Owner: 2001-08-27 05:20:51.40 spid2 ResType:LockOwner Stype:'OR' Mode: IX SPID:52 ECID:0 Ec:(0x193a7500) Value:0x2c3cabe0 2001-08-27 05:20:51.40 spid2 Node:1 ResType:LockOwner Stype:'OR' Mode: IX SPID:52 ECID:0 Ec:(0x193a7500) Value:0x2c3cabe0 2001-08-27 05:20:51.40 spid2 Node:2 ResType:LockOwner Stype:'OR' Mode: IX SPID:55 ECID:0 Ec:(0x2ac59500) Value:0x265083a0 2001-08-27 05:20:51.40 spid2 Cycle: ResType:LockOwner Stype:'OR' Mode: IX SPID:52 ECID:0 Ec:(0x193a7500) Value:0x2c3cabe0 2001-08-27 05:20:51.40 spid2 2001-08-27 05:20:51.40 spid2 2001-08-27 05:20:51.40 spid2 Deadlock cycle was encountered .... verifying cycle 2001-08-27 05:20:51.40 spid2 Node:1 ResType:LockOwner Stype:'OR' Mode: IX SPID:52 ECID:0 Ec:(0x193a7500) Value:0x2c3cabe0 Cost:(0/0) 2001-08-27 05:20:51.40 spid2 Node:2 ResType:LockOwner Stype:'OR' Mode: IX SPID:55 ECID:0 Ec:(0x2ac59500) Value:0x265083a0 Cost:(0/0) 2001-08-27 05:20:51.40 spid2 Cycle: ResType:LockOwner Stype:'OR' Mode: IX SPID:52 ECID:0 Ec:(0x193a7500) Value:0x2c3cabe0 Cost:(0/0) 2001-08-27 05:20:51.40 spid2 2001-08-27 05:20:51.40 spid2 2001-08-27 05:20:51.40 spid2 End deadlock search 2683...a deadlock was found 2001-08-27 05:20:51.40 spid2 ---------------------------------- 2001-08-27 05:20:51.40 spid2 ---------------------------------- 2001-08-27 05:20:51.40 spid2 Starting deadlock search 2684 2001-08-27 05:20:51.40 spid2 Target Resource Owner: 2001-08-27 05:20:51.40 spid2 ResType:LockOwner Stype:'OR' Mode: IX SPID:55 ECID:0 Ec:(0x2ac59500) Value:0x265083a0 2001-08-27 05:20:51.40 spid2 Node:1 ResType:LockOwner Stype:'OR' Mode: IX SPID:55 ECID:0 Ec:(0x2ac59500) Value:0x265083a0 2001-08-27 05:20:51.40 spid2 Node:2 ResType:LockOwner Stype:'OR' Mode: IX SPID:52 ECID:0 Ec:(0x193a7500) Value:0x2c3cabe0 2001-08-27 05:20:51.40 spid2 2001-08-27 05:20:51.40 spid2 Previous victim encountered ... aborting search 2001-08-27 05:20:51.40 spid2 2001-08-27 05:20:51.40 spid2 End deadlock search 2684 ... a deadlock was not found. 2001-08-27 05:20:51.40 spid2 ---------------------------------- This information could be useful to monitor the frequency and duration of blocking locks between processes to help identify the culprits of locking contention. Again, be careful using this trace flag because it can generate copious amounts of output in a system where substantial activity and locking contention is occurring. Trace Flag 1200Trace flag 1200 prints all of the lock request/release information back to the client program as it occurs in SQL Server. This information is displayed regardless of whether a deadlock is involved. This trace flag can be expensive in terms of system performance overhead, but it can be useful for analysis to display the acquisition, escalation, and release of locks within your SQL commands. If you enable trace flag 1200 from a user session, it only applies to the current session unless you specify the optional parameter of -1 to the DBCC TRACEON command to enable the trace setting for all user sessions: DBCC TRACEON(1200, -1) Also, when enabled in this manner, the output comes back only to the client and not to the errorlog. Capturing and analyzing this information for multiple client connections would be difficult.
The following code displays a sample of the output from the 1200 trace flag: DBCC TRACEON (1200) go begin tran --select count (state) from stores holdlock delete from stores where stor_id = '7200' go Process 52 acquiring IX lock on TAB: 8:1685581043 [] (class bit2000000 ref1) result: OK Process 52 acquiring IS lock on TAB: 8:1957582012 [] (class bit0 ref1) result: OK Process 52 acquiring IX lock on PAG: 8:1:5798 (class bit2000000 ref1) result: OK Process 52 acquiring Range-X-X lock on KEY: 8:1685581043:1 (3700f04c0158) (class bit2000000 ref1) result: OK Process 52 releasing lock on TAB: 8:1957582012 []go
|
EAN: 2147483647
Pages: 503