Using SQL Server Profiler for Monitoring Server Activity
| SQL Server Profiler is a graphical tool that allows the user to get a continuous list of events reflecting server activity. (Note the word server instead of SQL Server Database Engine: Starting with SQL Server 2005, SQL Profiler also enables users to look at current activity happening inside Analysis Server.) Detailed examination of SQL Profiler capabilities was performed earlier in Chapter 7. Here you'll skim through the monitoring capabilities of Profiler traces. Let's begin by examining a SQL Server Database Engine trace first. After a server connection is established, the Trace Properties dialog appears (see Figure 9-17). On the General tab, the user can select one of the pre-defined templates to be used for tracing. Figure 9-17. SQL Server Profiler Trace Properties dialog.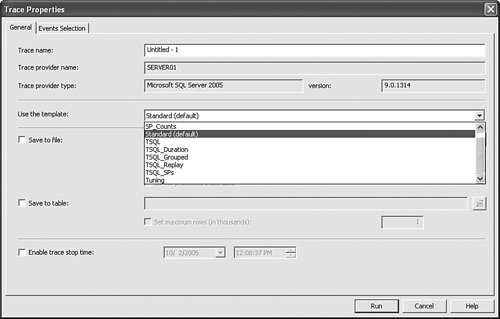 The Standard template is a good starting point if you want to monitor general server activity. By flipping to the Events Selection tab you can see that the Standard template automatically selects connection events, T-SQL batch events, and RPC events. Thus when starting a trace by clicking the Run button, you should be able to immediately see all SQL Server Database Engine Instance users. Those users who are already connected to Database Engine are going to be reflected via the ExistingConnection event, new connections via the Audit Login event, and disconnects via the Audit Logout event. You will also see all T-SQL batches that users are submitting for execution, as well as all RPC calls made via the programming API by database applications. All data appears directly in the trace window that will constantly scroll as new data comes in. Tips and Tricks If you don't like auto-scrolling of the trace window data, you can uncheck the Auto Scroll option under the Windows menu or click the appropriate button on the Profiler toolbar Please note another useful feature of Profiler that enables you to see event details more closely. Hover over the specific event in the trace and it will display corresponding textual data in the bottom pane of the split window. This is how you can investigate T-SQL data in more depth. If you are not satisfied with general monitoring using the Default template, you can select one of the specialized templates meant to assist in troubleshooting a specific issue with SQL Server Database Engine Instance. You can also use any of the templates as a base and select additional events that you would like to see monitored on the Database Engine. In addition to the Standard template, you can pick one of the other pre-defined templates listed in Table 9-3.
Monitoring of Analysis Server is very similar to SQL Server Database Engine, but it comes with its own set of templates. Two templates that ship with SQL Profiler for Analysis Server are "Standard," used for regular monitoring of Analysis Server activity, and "Replay," used to capture trace information sufficient to replay data against Analysis Server. |
EAN: 2147483647
Pages: 149