SQL Server Profiler
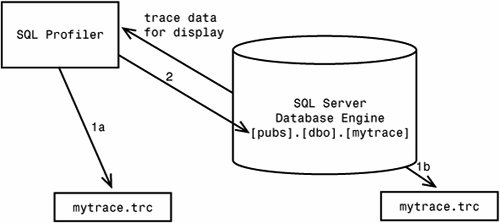
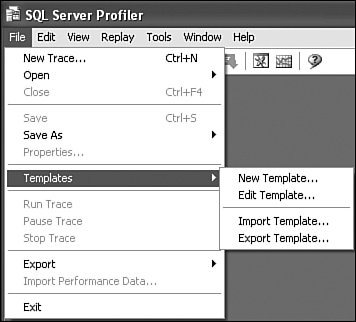
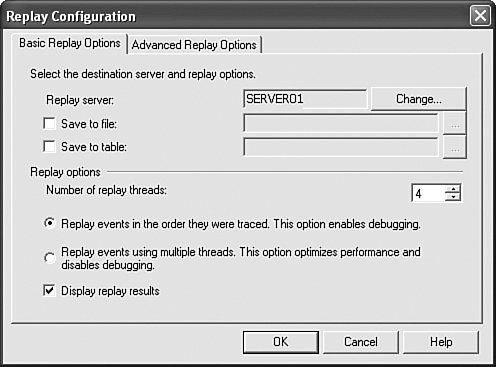
| Virtually all serious SQL Server Database administrators have used the SQL Server Profiler more than once. It is a graphical tool used to monitor the internal state of the server being traced. Sometimes people confuse SQL Server Profiler with the internal server component that actually produces trace data. In the case of SQL Server Database Engine this component is called SQL Trace. Note Keep in mind that running a trace always puts some additional load on the server. The SQL Server development team worked very hard to minimize this impact of tracing, and in the SQL Server 2005 release it is smaller than ever before. However, it can never be eliminated completely. SQL Profiler has a fairly simple user interface: You establish a connection to the server you want to trace, select events and columns, and run the actual trace. The subject of monitoring SQL Server and Analysis Server via SQL Profiler is covered in greater depth in Chapter 9, "Inside Monitoring Tools." If you are unfamiliar with the internals, it might be worthwhile now to take a look at how tracing is actually accomplished behind the scenes. We are going to investigate what SQL Profiler is doing behind the scenes by using Profiler itself. First, connect to a running instance of SQL Server Database Engine. The Trace Properties dialog depicted in Figure 7-3 has several advanced options that are discussed later in this chapter. For now, Looking at events generated by Profiler is typed in the Trace name box to define the trace. Figure 7-3. Trace Properties dialog.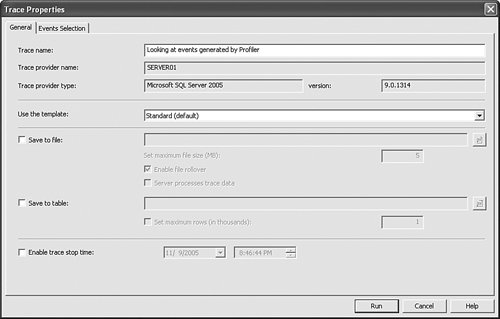 Tips and Tricks Keep in mind that the literal trace name is not being persisted anywhere and exists only for the benefit of the user while looking at the trace window. When trace data is saved to a file or a table, this information is permanently lost. Before starting the trace, let's switch over to the Events Selection tab and click the Application Name column header. The Edit Filter dialog is displayed as shown in Figure 7-4. Figure 7-4. Edit Filter dialog. You may notice that the application name associated with a given SQL Server Profiler session is filtered out via a "Not Like" clause. The purpose of this pre-set filter created by the SQL Profiler infrastructure is not to trace actions generated by SQL Profiler itself. We are going to change it so that the application name filter is set to "Like=SQL Server Profiler%." This causes Profiler-generated events to be displayed, regardless of the session from which they came. Tips and Tricks You can edit a SQL Profiler filter by clicking directly on the text you want to modify. This initiates in-place activation of the text control. Make sure you delete the GUID-like value displayed after the Profiler name in the original filter if you are using cut-and-paste, and replace it with a percent sign. In this case, it serves as a wild card. The actual session to be traced is not this session but the session that will start next and that will have a different, unknown GUID. When the filter setting is finished, click the Run button to start collecting trace data. At this point we are going to start another trace session. Establish a new connection to the same Database Server Instance and start a new trace. Now it's time to switch back to the window where the original trace is being captured and examine the collected data. It's easy to see all the activity generated by Profiler when starting a second trace. To create a trace, SQL Profiler uses the sp_trace_create stored procedure. After the trace object is created on the server and a handle is passed back to the client, SQL Profiler makes a series of sp_trace_setevent calls, listing each event and column ID combination that the user is interested in receiving. Finally, the sp_trace_setfilter stored procedure is called and sets the filter on the Application Name column. Then the sp_set_tracestatus call is made to actually turn tracing on. After that, SQL Profiler executes the sp_trace_getdata stored procedure, which starts feeding it with a never-ending resultset until the trace status is changed to "pause" or "stop" on a separate thread. Trace DefinitionTo make proper sp_trace_setevent calls, SQL Profiler obtained information on each event column intersection straight from the events selection matrix shown in Figure 7-5. Figure 7-5. SQL Server Profiler events selection matrix.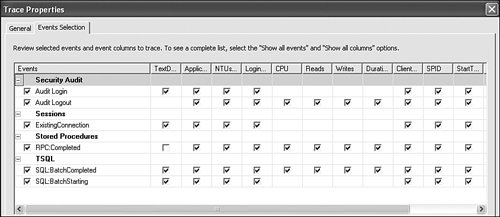 How does SQL Server Profiler know what possible event-column combinations to display for a specific server, and how does it later perform name-to-ID translation when generating DDL statements? All this information is stored in an XML file located inside the %Program Files%\Microsoft SQL Server\90\Tools\Profiler\TraceDefinitions folder. If you open a file named Microsoft SQL Server TraceDefinition 9.0.0, after general information you will see the following pattern: <EVENTLIST> <EVENT> <ID>139</ID> <NAME>Broker:Forwarded Message Sent</NAME> <EVENTCOLUMNLIST> <EVENTCOLUMN> <ID>7</ID> </EVENTCOLUMN> <EVENTCOLUMN> <ID>23</ID> </EVENTCOLUMN> This information is used by SQL Server Profiler to present the user with an event selection matrix and to translate the user selections back into valid event and column ID values. This folder also contains files corresponding to other server types supported by SQL Profiler. In fact, the SQL Profiler user interface code is agnostic to server capabilities; those unique capabilities get described to SQL Profiler by the corresponding trace definition file. Each trace definition file also contains a version number. What happens when SQL Profiler connects to a server with a version number different than the one already on the disk? In such cases, SQL Profiler attempts to interrogate the server of the trace metadata it exposes via a series of stored procedure calls and persists the trace definition on disk for future reference. To figure out the version information in the protocol, you can use tracing as you saw before. It's important to understand that although the communication protocol with Analysis Server is different from SQL Server Database Engine, the underlying infrastructure is essentially the same, that is, there is a trace definition that describes complete information about the trace provider and the trace metadata it exposes. The user is presented with an event selection matrix based on the information found in the corresponding trace definition file. User selections are turned into appropriate DDL calls to set up a trace and start consuming data. Tips and Tricks SQL Profiler enables you to extract the required sequence of DDL calls when starting a trace without having to capture T-SQL statements as you saw in the exercise. With a currently active trace window you would like to script out, go to the menu File, Export, Script Trace Definition and select one of the available options. Notice that scripting for SQL Server 2000 is presented as a separate option from scripting for SQL Server 2005. Even though underlying stored procedures have not changed considerably, many new events were added for SQL Server 2005 that did not exist in SQL Server 2000. Thus, if your trace contains these new events, they are skipped when you script a trace definition for a down-level (earlier than SQL Server 2005) server. Advanced Tracing OptionsIf you refer back to Figure 7-3 you can see several advanced tracing options. SQL Profiler enables you to specify possible ways to save trace information while tracing the server. You can save it to either a file or a table. When saving to a file you can have SQL Server perform the actual I/O. However, even under this option you will be getting data back to the grid. Does SQL Profiler read the data as it has been written to the server file system? In reality it cannot, because Database Engine can be running on a different machine under different security credentials than the graphical tool. How is this accomplished? SQL Profiler creates two different traces. One trace tells SQL Server Database Engine to write to a file on disk and another trace feeds data back to the client. When you run SQL Profiler, you may notice that the number of concurrent server connections indicated in the right corner of the status bar is one more than you would expect. This is not a very efficient use of SQL Server resources, so it is a good practice to write to a file from SQL Server only when you are not using SQL Profiler at all but are instead starting/stopping traces from the console or in a batch mode. Note When SQL Server writes trace data to the file system, it has a guaranteed assurance of never losing the data. However, when data is sent to Profiler over the network and the server load is too heavy, some events may actually get dropped. When this happens, you will see a special event displayed in the SQL Profiler grid indicating that some of the original trace events have been dropped because of resource constraints. In general, you can have trace data written to either a file or database table as shown in the diagram in Figure 7-6, Either SQL Profiler or Database Engine can write to a file (1a, 1b) but only SQL Profiler can write to a trace table (2), including the one located on a different physical server than you are tracing. When writing trace data to a file, you have to specify a maximum file size in megabytes. After the maximum specified size is reached, the file is closed and all new data is redirected into a new one with the same base name but with a numeric suffix. This feature is called "file rollover." File rollover enables you to move the old file to a new location and free up disk space. When replaying trace data, (the replay feature is described later in this chapter) SQL Profiler treats multiple rollover files as one and loads them sequentially into one execution scheduler. If you uncheck the Enable file rollover check box that was shown in Figure 7-3, trace recording stops as soon as maximum file size is reached. Even though the check box shown in the figure is grayed out, it gets enabled when the File, Save option is selected. Figure 7-6. Saving trace data to the file system or into a database table. Tips and Tricks If you did not select an option of saving trace data to a file or table before the trace starts, you can always do it later directly from the File menu. One issue with this is that if the trace is still running while you are saving data, only data currently displayed in the grid will be recorded and new data coming in after that point will not beas opposed to recording everything from start to finish. Another advanced tracing option is the capability to stop a trace at some point in time. This is done to prevent unnecessary consumption of server resources beyond a reasonable time interval of interest. Some of the advanced tracing options are hidden from immediate view and get enabled only when certain user selections are made. For example, you can capture execution plans described at the beginning of the chapter to a separate file. This option gets enabled only when one of the Showplan XML events is selected in the Events Selection matrix (see Figure 7-7). Figure 7-7. Selecting Showplan XML events in SQL Profiler.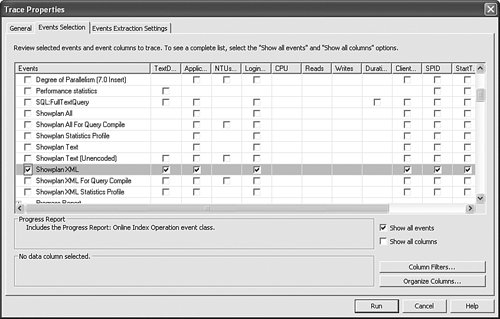 Switching over to the Events Extraction Settings tab in Figure 7-8, you will see different options for persisting execution plans to file system. One option is to collect all execution plans into a single XML file. Figure 7-8. Showplan and Deadlock XML Extraction while tracing.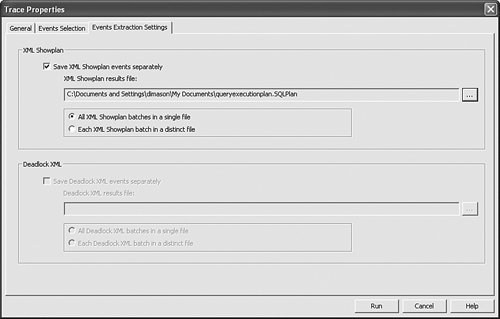 Later you can open up the execution plans in SQL Server Management Studio as shown in Figure 7-9. If you collected each execution plan in its individual file you would have only one picture per plan, but it is not necessarily more convenient because you would not know which one of multiple files you needed to open before trying each individual one. Figure 7-9. Opening Showplan XML file in SQL Server Management Studio.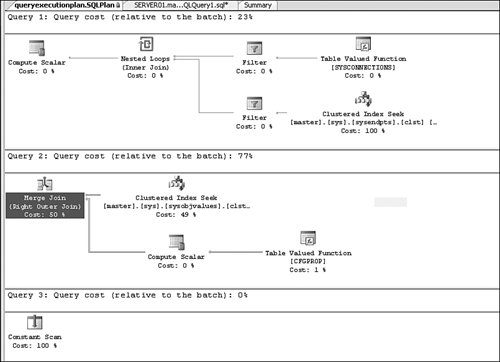 The option for extracting deadlock information is enabled by selecting the Deadlock Graph event in the Locks category. Tips and Tricks You can also extract Showplan and Deadlock events from the trace after it's been collected by using the following menu selections: File, Export, Extract SQL Server Events. This may be a better option if you want to avoid putting additional burden on the tool while a trace is being collected for creating multiple files. Editing Profiler TemplatesAt the beginning of the chapter when we first started a trace, no modifications were made to the template selection; that is, we used the events and columns selected by default in the Standard (default) template. Many pre-defined templates are supplied with SQL Server Profiler. You can refer to Chapter 9 "Inside Monitoring Tools," to get an overview of each one. Here we discuss an option of creating a custom template that satisfies your needs. This is easy to do in SQL Profiler. From the File menu, select the New Template in the Templates submenu, as shown in Figure 7-10. Figure 7-10. Templates submenu. This will launch the template editor (see Figure 7-11). Figure 7-11. Template Editor.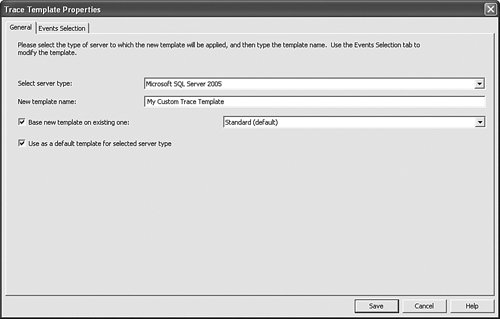 Here you can create a new template based on an existing template and customize the event/columns selection, or you can select events and columns from scratch. You can also make this new template your default template for starting SQL Profiler traces. Tips and Tricks You may need to experiment with the trace before you determine the optimal event and column information to collect. If you already have a trace, it is much easier to create a template by directly exporting it from the trace itself. With the trace window open, select File, Save As Trace Template and give it a name. This is by far the quickest and most effective way to create a template. Later you can edit the template in the template editor and make it the default. Saving a Trace in XML FormatTrace data is being saved following a well-defined XML schema and can be accessed programmatically by other tools. The biggest advantage of saving trace data in XML format is to allow easy editing of the data before using Replay (described later in this chapter). There is an option to save as Trace XML File for Replay, which strips all the non-relevant columns from the original trace except for those used by the Replay execution engine. Performance Counter CorrelationThe correlation of trace data and the performance monitor log is a cool new feature of SQL Profiler. This correlation enables the person troubleshooting SQL Server performance problems to see how trace data correlates with Windows performance counter data. To use this correlation, you need to use Performance Monitor logging while tracing the server to collect performance counter data separately. Performance Monitor data needs to be stored in a comma-delimited log file, as shown in Figure 7-12, and trace data can be stored in a regular trace file. Figure 7-12. Saving performance counter data into comma-delimited log file.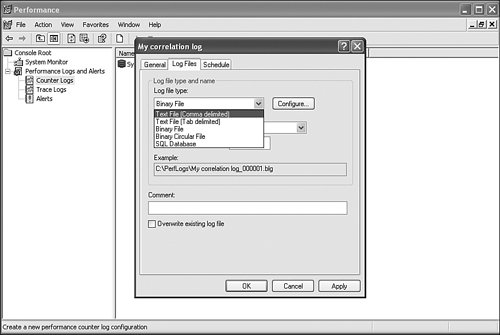 Tips and Tricks SQL Profiler can read binary log files as well; however, because the binary format has changed between different versions of the Windows operating system, it is possible that a file captured on one computer (server) might not be successfully read on the computer where Profiler is installed (client). Thus, saving to a comma-delimited file is safer, although performance may be impacted. After the data collection stage, you can start correlation by first loading the trace file and then choosing the File, Import Performance Data menu option. This launches the counter selection dialog shown in Figure 7-13. Figure 7-13. Performance counter selection dialog.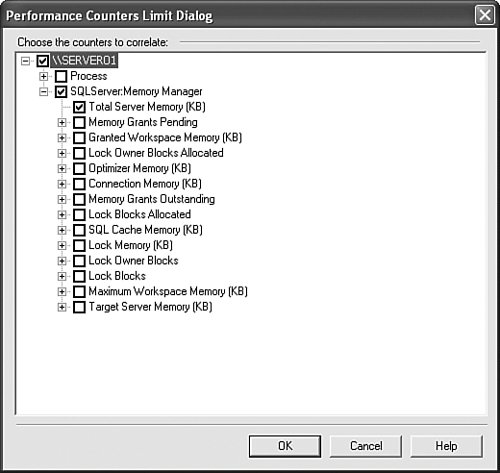 This dialog is used to keep SQL Profiler from reading all the counters captured in the log file. Reading too many counters can be quite costly and should be avoided unnecessarily. After all counters have been selected, the user is presented with the correlation graph shown in Figure 7-14. Figure 7-14. Trace-Performance counter correlation graph.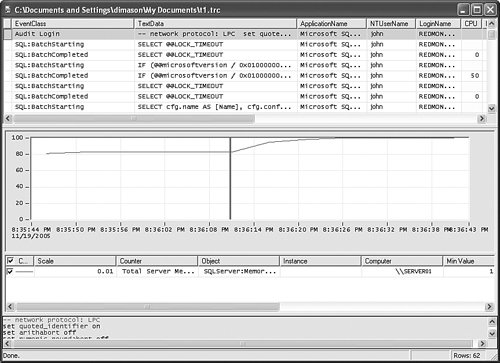 The graph itself reflects value changes for each counter. The vertical red bar can be positioned anywhere on the graph. The trace window scrolls in correlation with the selected timestamp. You can also scroll through the trace data and change positioning of the vertical bar at the same time. Tips and Tricks Only the timestamp is used in correlating of two different sources of data. Therefore it is imperative that the trace file contains StartTime and EndTime columns collected for each trace event. Trace Objects APIOne of the hard-to-discover features of SQL Profiler is exposed through a completely different mechanism. There is an application programming interface (API) layer around SQL Profiler called Trace Objects. With this API, the SQL Profiler development team wanted to enable users to automate creation of the trace and perform trace data reading and manipulations programmatically. It is a managed API; that is, it can be accessed by any .NET language. Trace ObjectsTrace objects enable the user to start a new trace, read and write trace log files, and trace tables. There are three main classes:
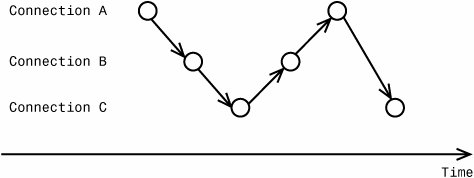
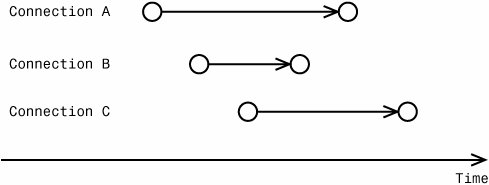
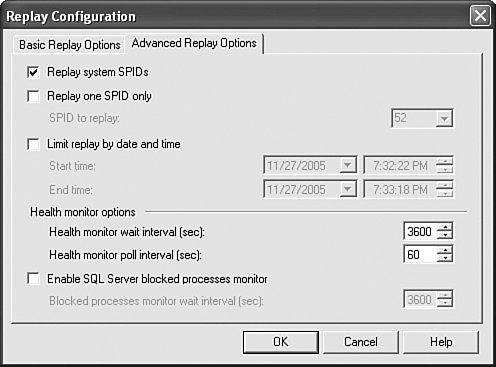
All these classes are part of the Microsoft.SqlServer.Management.Trace namespace contained in managed assembly %Program Files%\Microsoft SQL Server\90\SDK\Assemblies\Microsoft.SqlServer.ConnectionInfo.dll. TraceServer is a read-only abstraction, whereas TraceFile and TraceTable can be used for both reading and writing of trace data. Scenario 1 Starting a New TraceTo start a new trace, you first need to create the TraceServer object: TraceServer reader = new TraceServer(); Next you need to create an object responsible for storing connection information and indicate that you want to use Windows Integrated Security for connecting the server: ConnectionInfoBase ci = new SqlConnectionInfo("localhost"); ((SqlConnectionInfo)ci).UseIntegratedSecurity = true; Now you can pass connection information to the TraceServer object as part of its initialization routine. The second argument is the name of the trace template file (creation and editing of SQL Profiler templates were described earlier in this chapter).: reader.InitializeAsReader(ci, @"Standard.tdf"); At this point you can start consuming trace data by repeatedly calling the Read() method in a loop. Contents of each data record can be examined in a way standard to any data provider via the IDataRecord interface members (for more information, see the .NET Framework documentation): while (reader.Read()) { // do something with data when it comes back Console.Write( reader.GetValue(0).ToString() ); } Tips and Tricks The reader.Read() call is synchronous, meaning that it will not return until the event is read or the trace is stopped. To stop a trace, you need to call TRaceServer.Stop() from a separate thread. After getting out of the reader loop, close the reader: reader.Close(); The same code is applicable to starting a trace against Analysis Services, except a different connection object (OlapConnectionInfo) and tracing template need to be used in this case. Scenario 2 Saving Trace File Data to a TableOften users perform tracing through stored procedures and have SQL Server write directly to the file system. As soon as tracing is complete, however, they need to analyze data with the SQL Server query mechanism, so data needs to be loaded into the table. One way to solve this is by using an insert statement and reading the trace data via the fn_trace_gettable built-in function that projects trace results directly from the file. However, this function does not work if the trace data file is in legacy formatfor example, Microsoft SQL Server 7.0 or SQL Server 2000 files. Another advantage of using trace objects is the capability to process data as it has been read and optionally modify the data being written (very valuable for Replay) or discard unnecessary events. Just as in the code example described above, the following assembly needs to be referenced for the project to compile: %Program Files%\Microsoft SQL Server\90\SDK\Assemblies\Microsoft.SqlServer.ConnectionInfo.dll. Here is a code segment that demonstrates how to perform this operation: public void FileToTable() { SqlConnectionInfo connInfo = new SqlConnectionInfo("localhost"); connInfo.DatabaseName = "pubs"; TraceFile reader = new TraceFile(); reader.InitializeAsReader("TraceInputFile.trc"); TraceTable writer = new TraceTable(); writer.InitializeAsWriter(reader, connInfo, "OutputTraceTable"); writer.WriteNotify += new WriteNotifyEventHandler(OnWriteNotify); while( writer.Write() ){}; writer.Close(); } One interesting detail of this code sample is a callback mechanism that uses WriteNotifyDelegate. This mechanism is used to examine each individual record being written. You can optionally suppress this event from being written out by setting the SkipRecord boolean flag to true. You can also modify the contents of each individual column. The following demonstrates a sample implementation of this method: protected void OnWriteNotify(object sender, TraceEventArgs args) { IDataRecordChanger recordChanger = args.CurrentRecord if( recordChanger["ApplicationName"].ToString() != "myprogram" ) { args.SkipRecord = true; } else { recordChanger.SetValue(1, "Changed by user"); recordChanger.SetValue(2, 10); } } Scenario 3Saving Trace File Data to a TableWith moderate modifications, you can change the preceding utility to save the contents of a trace table to a file, that is, go in the opposite direction. First, you need to initialize this routine by creating the SqlConnectionInfo object: SqlConnectionInfo connInfo = new SqlConnectionInfo("localhost"); connInfo.DatabaseName = "pubs"; Then you need to create and initialize the TRaceReader class: TraceFile reader = new TraceFile(); reader.InitializeAsReader("InputTraceFile.trc"); Create and initialize the table writer object: TraceTable writer = new TraceTable(); writer.InitializeAsWriter(reader, connInfo, "OutputTraceTable"); Set up the OnWriteNotify event handler as before if you want to perform optional writing: writer.WriteNotify += new WriteNotifyEventHandler(OnWriteNotify); Sit in the loop and write: while( writer.Write() ){}; As writing is done, close the writer (which closes the reader as well): writer.Close(); SQL Profiler ReplaySQL Profiler Replay is an integral part of SQL Profiler. The purpose of replay is to reproduce the original load on the server based on original trace data. For example, the original trace captured three different clients executing three distinct queries in a specific order. When the trace is replayed, identical queries will be executed on different connections following the same order. Moreover, all client connection options affecting execution, such as ANSI_PADDING, QUOTED_IDENTIFIERS, and so on, will be properly set for each connection as well. Some of the events captured by the trace require special interpretation during replay. For example, a client tool or database provider itself is using the API server cursor by calling sp_cursorprepare, then sp_cursorfetch multiple times, and finally sp_cursorclose. SQL Profiler Replay needs to understand that sp_cursorprepare creates a server-side cursor, and then accepts and stores cursor handle returned from the server. Subsequently, this new handle must be used in place of an old one when executing sp_cursorprepare and sp_cursorclose statements. In cases where multiple statements get fetched at the same time on the same connection, Replay must remember all original handles and make proper substitutions based on that information. Understanding that the Replay feature of SQL Profiler requires special information to properly reproduce complex customer scenarios will help you justify the existence and enforcement of the TSQL_Replay trace template. Only when the trace is captured with this template does SQL Profiler have a chance to replay it properly. In fact, this information is so critical that SQL Profiler now enforces minimum required information in a trace file when trying to start Replay against a SQL Server 2005 Database Engine instance. Tips and Tricks In reality, trace replay may encounter errors even when using the right template. There are multiple reasons for these errors. For one, client actions may have started prior to the trace capture, making cursor creation information unavailable in the trace. Or client connection options reported via an "ExistingConnection" event might not have been set when the statement was replayed. Or perhaps the database is not in the same state as it was when trace was captured, or the database user is no longer valid. Let's use the correct template to capture trace data, storing it in the file at the same time. After the trace is stopped, open the file and wait until it's fully loaded. There are three ways to start replay from the shell. First, select the Replay, Start menu option. Second, you can click on the toolbar. Third, press the F5 function key. In each case you must first connect to the replay server. Then you are presented with the basic Replay Configuration options dialog shown on Figure 7-15. Figure 7-15. Basic replay configuration options. Replay Execution ModesThere are two main mutually exclusive replay execution modes, indicated by radio buttons: Replay events in the order they were traced and Replay events using multiple threads. These names/descriptions can be quite confusing. Wouldn't you expect replay to preserve the order of the events? At the same time wouldn't it make sense to always use multiple threads while replaying? The fact of the matter is both of these statements are true. Let's try to introduce a better naming scheme. Call the first mode "Full Synchronization" and second mode "Connection-Level Synchronization." When replay occurs in Full Synchronization mode, all events collected in the original trace are replayed sequentially. Events that were originated from different connections are still replayed on different threads, but overall order of execution is preserved unconditionally. When replay occurs in Connection Level Synchronization mode, the order of events within each connection remains the same, but different connections are not assumed to be dependent on each other. Figure 7-16 shows the relative sequence of execution of events replayed in Full Synchronization mode. Figure 7-16. Full Synchronization replay mode. As you can see from the picture, two events each are collected on connections A, B, and C. The order of replay follows exactly the relative order along the timeline. Tips and Tricks Even during Full Synchronization Replay mode, the replay engine uses multiple threads. This makes it possible to properly replay simple blocking scenarios where the order of submission for each event is different than the actual order of execution. In reality, only a few replay threads are active at the same time because of frequent synchronizations, so setting the thread pool number too high will not help replay, and in fact it will run slower because of the unnecessary overhead of context switching. Figure 7-17 shows the relative sequence of execution of events replayed in Connection Synchronization mode. Figure 7-17. Connection-level synchronization replay mode. As you can see from the picture, only relative order of events within each individual connection is preserved. Connections are assumed to be independent of each other. This mode of operation provides the highest replay throughput and server stressing. However, the exact results of replay are going to be non-deterministic if there is any correlation between clients, because absolute order of events is not guaranteed and can vary between different replay sessions. It should be obvious from the diagram why Connection Level Synchronization replay does not allow setting replay breakpoints for debugging. Because global serialization is not used, it's impossible to halt all replay threads at any point in time deterministically because they run independently of each other. Additional Basic Replay OptionsDuring replay, the original trace window is going to be split into two. The bottom half represents the replay output. It is possible to save replay output data to either a file or a table for further analysis. Another useful basic replay option is the capability to hide replay results. When verifying correctness of replay, it's not necessary to look at individual resultsets for each individual query. Any actual replay error is going to be reflected in the "Replay Statistics" event generated at the end of the replay session. Advanced Replay OptionsSwitching to the Advanced Replay Options tab before beginning a replay will launch the dialog shown in Figure 7-18. Figure 7-18. Advanced Replay Options. This option enables you to replay SPIDs (unique client connections) that are considered internal system processes or filter them out. The option also enables you to replay a single SPID within a certain time range. The most useful advanced replay options are related to health monitoring. The replay engine has an internal health monitor thread that periodically checks for the status of each outstanding request. If the request has been outstanding longer than the predefined maximum allowed interval, the statement is cancelled and the thread moves on to the next event. The health monitor also allows the replay engine to periodically check and terminate requests that are blocked by other requests. Replay Objects APISimilar to the Trace Objects API, you can completely control Replay programmatically via managed code. Replay objects contain two classes: the TraceReplay class, which implements all replay functionality, and the TraceReplayOptions helper class, which helps configure the TraceReplay object. TraceReplay class exposes the following methods, properties, and events.
traceReplayOptions provides the following configuration options:
Let's look at sample usage of the Replay Objects API. Scenario Replay Trace FileThe first thing to do is instantiate a new TRaceReplay object and initialize a replay source file: TraceReplay replay = new TraceReplay(); TraceFile source = new TraceFile(); source.InitializeAsReader("InputTraceFile.trc"); replay.Source = source; Next, create a replay connection: SqlConnectionInfo connection = new SqlConnectionInfo(); connection.ServerName = "localhost"; connection.UseIntegratedSecurity = true; replay.Connection = connection; Then sign up for event notification when an event is about to be submitted for replay: replay.OnReplayEvent += new TraceReplay.OnReplayEventHandler(OnReplayEvent); As part of the callback mechanism, you can examine and change the details of any event before it gets replayed or skip the event all together.
Finally, it's time to start the replay. replay.Start(); Tips and Tricks The Start method does not return until Replay is finished. To stop the replay you need to call the Stop method on a separate thread. |
EAN: 2147483647
Pages: 149
- Measuring and Managing E-Business Initiatives Through the Balanced Scorecard
- Measuring ROI in E-Commerce Applications: Analysis to Action
- Technical Issues Related to IT Governance Tactics: Product Metrics, Measurements and Process Control
- Governing Information Technology Through COBIT
- The Evolution of IT Governance at NB Power