2.4 About Debugging
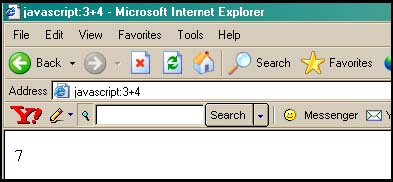
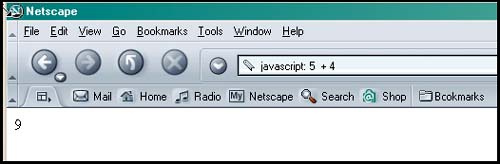
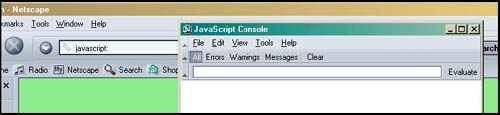
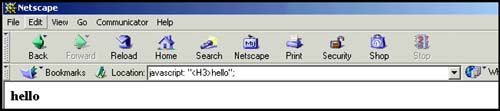
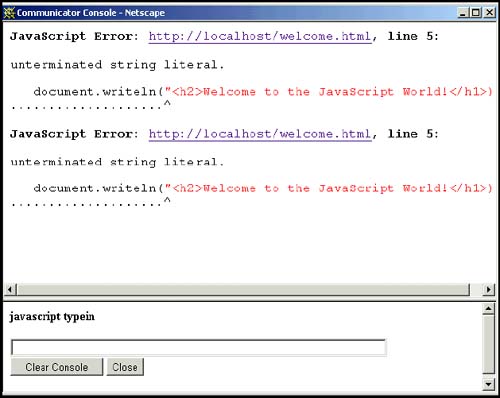
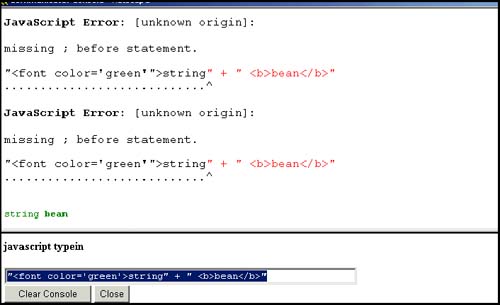
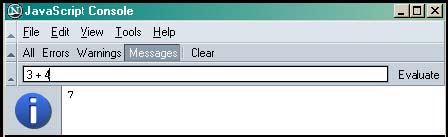
| Have you ever tried to draw a picture or do your resume for the first time without a mistake either in the layout, order, type, style, whatever? In any programming language, it's the same story. And JavaScript is no exception. It's especially tricky with JavaScript because you have to consider the HTML as well as the JavaScript code when your page doesn't turn out right. You might get errors on the console or get a totally blank page. Finding errors in a script can get quite frustrating without proper debugging tools. Before we go any further, this is a good time to get acquainted with some of the types of errors you might encounter. 2.4.1 Types of ErrorsLoad or Compile TimeLoad-time errors are the most common errors and are caught by JavaScript as the script is being loaded. These errors will prevent the script from running at all. Load-time errors are generally caused by mistakes in syntax, such as missing parentheses in a function or misspelling a keyword. You may have typed a string of text and forgotten to enclose the string in quotes, or you may have mismatched the quotes, starting with single quotes but ending with double quotes. RuntimeRuntime errors, as the name suggests, are those errors that occur when the JavaScript program actually starts running. An example of a runtime error would be if you asked the user for a number between 1 and 5 and he gave you a 7, or you put some code between the <head></head> tags and it should have been placed within the <body></body> tags, or you referenced a page that doesn't exist. LogicalLogical errors are harder to find because they imply that you didn't anticipate an event or that you inadvertently misused an operator, but your syntax was okay. For example, if you are checking to see if two expressions are equal, you should use the == equality operator, not the = assignment operator. 2.4.2 Debugging ToolsThe javascript: URL ProtocolFor simple debugging or testing code, you can use the URL pseudoprotocol, javascript: followed by any valid JavaScript expression or expressions separated by semicolons. The result of the expression is returned as a string to your browser window, as shown in Example 2.3 and Figures 2.2 and 2.3. Figure 2.2. Internet Explorer and the javascript: protocol. Figure 2.3. Netscape and the javascript: protocol. FORMAT javascript: expression Example 2.3javascript: 5 + 4 Netscape's JavaScript ConsoleNetscape 6 and 7 provide the JavaScript Console. You invoke it via the Tasks or Tools/Web Development menu, or by typing javascript: in the location bar of the browser. The JavaScript Console displays the lines containing the errors. Leave the console open and watch your errors build up. You can also type expressions to be evaluated. Example 2.4<html> <head> <title>First JavaScript Sample</title> 1 <script language = "JavaScript"> 2 document.writeln("<h2>Welcome to the JavaScript World!</h1>); 3 // Bug in line2: Missing double quote!! </script> </head> <body bgcolor="yellow" text="blue"> <font size="+2">This is just plain old HTML stuff.</font> </body> </html> EXPLANATION
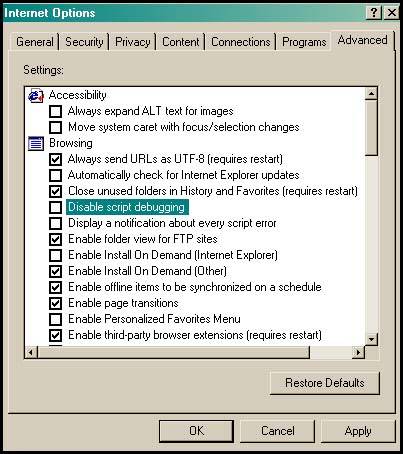
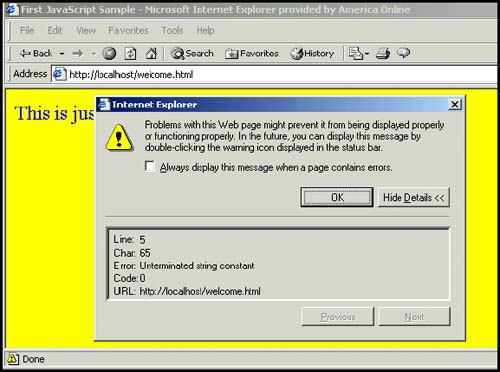
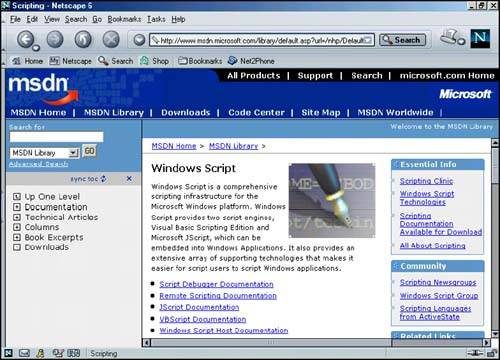
Figure 2.5. Netscape ”The JavaScript Console indicates where errors are found. Figure 2.6. Netscape ”The JavaScript Console. Figure 2.7. Netscape 7 console window. For JavaScript debuggers available for download for Netscape, go to http://developer.netscape.com/software/tools/index.html or http://www.mozilla.org/projects/venkman/index.html for the Netscape JavaScript debugger known as Venkman. Debugging in ExplorerMicrosoft's Internet Explorer provides a debugging window as an advanced Internet option (see Figure 2.9). When an error occurs in your JavaScript program, a little triangle appears in the left-hand corner of the browser window. If you double-click the triangle, a debugging window opens explaining the error and the line number where it occurred (see Figure 2.10). Figure 2.9. To enable debugging in IE, go to Tools > Internet Options > Advanced. Figure 2.10. In Internet Explorer, look in left-hand bottom corner for a triangle. Also see http://msdn.microsoft.com/scripting/ to find the Microsoft Script Debugger (MSSD), a free debugging tool that works with IE 3.01 and above (see Figure 2.11). You can write and debug your scripts (called JScript by Microsoft) using this debugger. Figure 2.11. Web site for the Microsoft scripting tools. |
EAN: 2147483647
Pages: 150