Project Web Access and Project Professional with Individual Office Applications
| Integration with individual Office applications and the EPM solution is a big topic. Outlook and Excel each have numerous points of integration, and Visio has some integration features that can be useful for communicating project information graphically within the EPM solution. The discussion in this section highlights some of the most useful integration features between the EPM solution and the Office application suite. Project Web Access Integration with OutlookOutlook integration with the EPM solution encompasses far more than emailing project plans to team members and getting email notifications from Microsoft Office Project Server about updated tasks. Outlook integration is centered on team members, allowing them an alternative to working with Microsoft Office Project Web Access (PWA). About the Project Web Access Add-in for Outlook Integration WizardTeam members can use PWA to view and work with their task assignments that have been published to Project Server 2003; however, they may prefer to work with their project tasks in Outlook instead. Because people already keep track of their appointments and tasks in Outlook, they might feel it's an added burden to work with the PWA interface. Working in Outlook may also assist team members to focus on getting their work done. The EPM solution provides the Project Web Access Add-in for Outlook Integration Wizard to easily import project tasks to Microsoft Outlook 2000 or later and assist team members in keeping project managers updated. The Project Web Access Add-in for Outlook Integration Wizard is a Component Object Model (COM) add-in downloadable from the Tasks page in PWA 2003. In addition to downloading and executing the Project Web Access Add-in for Outlook Integration Wizard, you must have two other requirements to access and work with Project Server data in Outlook: A valid PWA account and Microsoft Outlook 2000 or later installed on your local computer. After utilizing the wizard to install the Project Web Access add-in for Outlook, you can import your assigned tasks from the Project Web Access timesheet to the Outlook calendar. In the Outlook calendar, tasks can be viewed alongside existing appointments, and you can report progress on those tasks to Project Server directly from Outlook. Project Web Access Add-in for Outlook SetupTo connect PWA and Outlook you must be a local administrator on the workstation, or your Windows policies must allow you to perform the installation. To activate the COM add-in on the workstation with Outlook, follow these steps: TIP It is a good idea to close Outlook and even perform a restart of the workstation before you proceed with the wizard because Outlook may have a background process running that may prevent the installation from completing unless you do a restart after the wizard.
If the installation completes successfully, you see the Microsoft Office Project Help dialog box when you open Outlook (see Figure 23.1). Microsoft Office Project Help is a handy reference for the Project Web Access add-in for Outlook and contains topics such as setting a date range for imported assignments and updating PWA assignments automatically and manually. Figure 23.1. When opening Outlook for the first time after the Project Web Access add-in for Outlook is installed, Microsoft Office Project Help displays.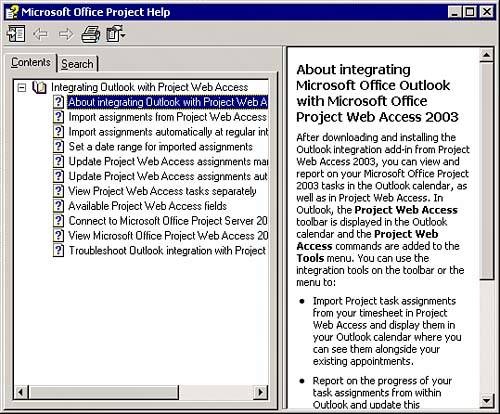 TIP Integration help for Outlook and PWA can be opened at any time from within Outlook by selecting Tools, Project Web Access, Help from the menu. The title of the help window, Microsoft Office Project Help, can be somewhat misleading. Connecting Outlook to Project ServerTo share data with Project Server, Outlook must have a valid connection to your Project Server installation. To create a connection between Outlook and Project Server, open Outlook and follow these steps:
The Project Web Access add-in for Outlook setup is now complete. Project Task Import and Review in OutlookAfter project task assignments are imported, they can be viewed and updated from within Outlook. The Project Web Access Add-in for Outlook Integration Wizard adds several new menu items under the Project Web Access submenu of the Tools menu. This section discusses two of them:
Appointment reminders appear if any of the new assignments are due in the current calendar period. As with any Outlook reminder, you can review and dismiss them individually or select Dismiss All to eliminate all reminders. To review only your project tasks in the Outlook calendar, follow these steps:
Reviewing and Submitting Actual Work with the Project Web Access Add-in for OutlookYour assignments can be updated within Outlook using the Project Server menu controls. Simply select the Calendar view and set the time frame to review the assignments within the date range you want to see. To see the assignment details, double-click it to view the assignment in the Project Web Access Appointment dialog, which has three tabs. Click the Project Web Access tab and maximize the frame to see your task timesheet as shown in Figure 23.2. Figure 23.2. Project Web Access tab of the Project Web Access appointment dialog. Input your Actual Work and, if necessary, update the Remaining Work for the task and click the Update Project Manager button to submit the work effort directly from this dialog box. Alternatively, you can use the Save Changes button and process all your task updates to Project Server at once. To update all your tasks simultaneously, select Update Project Web Access on the toolbar, or from the menu select Tools, Project Web Access. Importing a Task List from OutlookMany people use Outlook to track lists of tasks. The EPM solution makes it easy to import these tasks directly from Outlook to begin a project schedule. Start your task list in Outlook. Double-click any task to access the Properties dialog box and additional information you can input about the taskfor example, you can add notes (on the Task tab) and Total Work (on the Details tab). Here's the procedure to import an Outlook task list into a project:
More Ways to Work with OutlookIn addition to the Project Web Access add-in for Outlook, there are a couple of other integration points between Outlook and EPM. On the bottom of the Work with Outlook screen, which you get to by clicking the View and Report on Your Tasks from Your Outlook Calendar link on the PWA home page, there are two links under the heading More Ways to Work with Outlook. Those links are Display Project Web Access in Outlook and Display a Digital Dashboard in Outlook. Display Project Web Access in OutlookClicking on the Display Project Web Access in Outlook link, you may be prompted to accept ActiveX controls (depending on your security settings); click Yes to allow the ActiveX component to proceed. Next, the Display Project Web Access Page in OutlookWeb Page dialog box appears offering you the three options for displaying PWA in Outlook (see Figure 23.3). Figure 23.3. The Display Project Web Access page in the OutlookWeb Page dialog gives you the options to automatically create easy methods to access PWA in Outlook.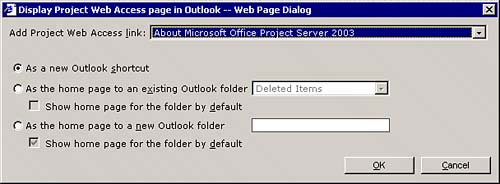 The first option, As a New Outlook Shortcut, creates a new shortcutan icon and associated namein the Shortcuts pane in the Navigation pane on the left side of the main Outlook window that offers quick access to folders. NOTE Note that new shortcuts are added to the first shortcut group. If you want the shortcut to appear in another group, click the shortcut and then drag it to the shortcut group you want. The second option, As the Home Page to an Existing Outlook Folder, has an associated drop-down list that displays your existing Outlook folders and lets you choose with which folder PWA should associate itself. Clicking the Show Home Page for the Folder By Default check box causes PWA to display when you click the folder from the Navigation pane. Using the last option, As the Home Page to a New Outlook Folder, you can tell Outlook to create a new folder in the Navigation pane, and, by clicking the Show Home Page for the Folder By Default check box, you can choose to have PWA opened in Outlook when you click the folder. TIP If you select either of the last two options from the Display Project Web Access Page in OutlookWeb Page dialog and find that instead of setting up a link to the PWA home page, it sets up a link to a page displaying the Product ID for Project Server and the Number of Project Server Users, you can manually edit the link. Right-click the folder from the Navigation pane in Outlook. In the Properties dialog box, click the Home Page tab and correct the URL in the Address box. Display a Digital Dashboard in OutlookThe second link on the bottom of the View and Report on Your Tasks from Your Outlook Calendar page allows you the same three options as discussed in the preceding section, but instead of displaying the PWA home page, you can input the URL to your previously created digital dashboard and have it displayed when you click the folder or shortcut in Outlook (see Figure 23.4). Figure 23.4. The Display Digital Dashboard in OutlookWeb Page dialog showing the three options for how to access your previously created digital dashboard.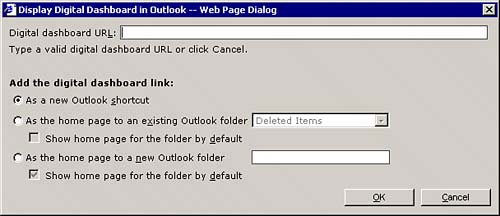 Project Server Integration with MAPI EmailIn addition to the Outlook integration items reviewed earlier in this chapter, there are many integration points between Project Server and any MAPI-compliant email system, such as Outlook. Although worth mentioning, these integration points are not specific to Outlook and Project, and, therefore, are beyond the scope of this chapter. Project Help is an excellent resource to further explore the MAPI email and Project Server integration features listed here:
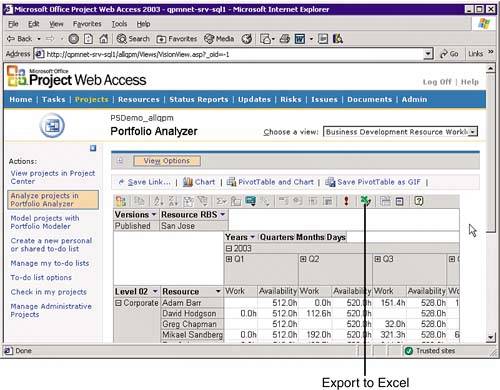
PWA Integration with ExcelBeyond Outlook, Excel has perhaps the greatest number of integration options with the EPM solution. This section details the features specific to Project Web Access. Project Professional integration with Excel is a large topic and has been covered well in other reference booksfor example, Special Edition Using Microsoft Office Project 2003, copyright 2004, Que Books. Export PWA Grid to ExcelAppearing at the bottom-right side of every PWA ActiveX data grid is the Export Grid to Excel link, as shown in Figure 23.5. When you click this link, you may be prompted to accept ActiveX controls (depending on your security settings); click Yes to allow the ActiveX component to proceed. Figure 23.5. The Export Grid to Excel link appears at the bottom-right corner of every PWA grid and gives you quick access to this Excel/PWA integration feature. Excel opens on your local desktop, and the grid data displayed in the PWA interface is displayed in Excel (see Figure 23.6). Figure 23.6. The result of clicking the Export Grid to Excel link. The formatting of the spreadsheet is automatically set when you click the link. NOTE The Excel export function adds a username and time stamp to the exported data. This can be a handy feature if, for example, you're taking a snapshot of data from a project for historical purposes. Exporting to Excel is a simple, one-step procedure; however, keep in mind a couple of details to make the export more efficient. First, make sure to set up the data in the PWA grid that you really want to see in Excel. PWA grids won't allow you to add or take away columns from the display, so you'll have to do that in Excel (or use the Print Grid functionality explained in the next section), but you can sort your data, group your data, and filter it. After the data is exported to Excel, you can work with it like you would any other data that appears in an Excel worksheet because this is static data and there is no dynamic data connection.
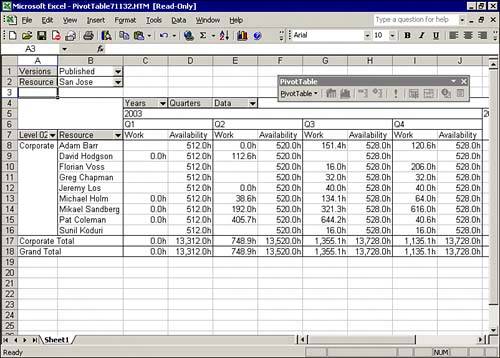
NOTE Before Service Pack 1 for Project Server 2003 there was an issue with the Export Grid to Excel feature. When the link was clicked, an error message would display in PWA, and Excel would continue to run in the background. In other words, when you tried to export a project plan that contained more than eight outline levels using the Export Grid to Excel feature in PWA, a hidden instance of Excel remained running, and you received the following error message: "An error occurred while exporting the grid data to Excel. Because of this error, you can only copy XML data to the Clipboard. Do you want to continue?" This feature depends on an ActiveX control (pjprint.dll) that may not be available because of your IE security settings. This DLL is marked as "Safe for Initialization" but as "Unsafe for Scripting." Confirm that the IE security settings for the zone in which your Project Server website is listed are set as follows: The value for Initialize and Script ActiveX Controls Not Marked as Safe must be set to either Enable or Prompt. (To check your settings in Internet Explorer, select Tools, Internet Options, and then select the Security tab. Select the Zone in which Project Server is listed; then click the Custom Level button.) Using the Print Grid Function to Export to ExcelJust glancing at the Print Grid link that appears at the bottom of every PWA grid control, you might expect that it's a simple print function. It is indeed simple, but it comes with a lot more functionality than is implied in its name. For example, using this web-based interface, you can arrange and format columns before you export the data to Excel. Clicking the Print Grid link causes a new browser instance to open in front of your PWA browser screen. The lower portion of this new browser window holds a simple HTML, printer-friendly table with the same grid data you were looking at when you clicked the link. The upper portion of the screen gives you options to Arrange Columns and Format Columns. The toolbar below these options holds a Print Grid link, an Export to Excel link, and a Reformat Grid link. Using Arrange Columns, you can change the order of your columns in the display and exclude columns. If you click the Format Columns button, you get options to prevent column wrapping, use the default column width, or set a specific column width in em units, pixels, points, or a percentage. You also can choose the column alignment: Default, Left, Center, or Right. After you set your options for each column and decide which ones you really want to export, click the Reformat Grid link to see your changes in the web interface. Finally, click the Export to Excel link and click Yes on the ActiveX warning, and your data will appear in Excel, or click the Print Grid link to send the report directly to your printer. Exporting a Portfolio Analyzer Table to ExcelExcel PivotTables summarize data in cross-tabular calculations and offer impressive flexibility for quickly changing the layout of the data. Several good references on dealing with PivotTables in Excel are availablefor example, Special Edition Using Microsoft Office Project 2003, copyright 2004, Que Books, which contains an excellent discussion of PivotTable functionality. Additionally, Excel 2003 contains Help articles on how to use PivotTables effectively. Look for the article "Ways to Customize PivotTable Reports" in Excel Help topics. This section discusses how to create a simple PivotTable while avoiding repetition of the information that's already available. Creating a PivotTable in Excel from a PWA Portfolio Analyzer view involves exporting the data and then altering the PivotTable in Excel to present the data exactly as you want it to appear. The export process creates a simple PivotTable that you can edit to fine-tune the display of data. The basic, no frills, export to Excel is a simple process. Of course, there are options, which this chapter reviews, that make it flexible so that it can fulfill the needs of most any user in your organization. To export the current Portfolio Analyzer table to Excel, follow these steps:
TIP To access the Export to Excel button, the toolbar must be displayed on the PivotTable you're viewing. If you don't see it, right-click a blank area of the table and select Toolbar from the context menu. Importing External Data into ExcelTwo other options within Excel integrate with EPM. They both exist on the Data menu in Excel:
You can use these functions to create a connection to an external data source and import data into Excel. To integrate these functions with the Project Server database, you need to have intimate knowledge of the Project Server database architecture to produce a meaningful data set. Because of the complexity of this task, a discussion of these functions is beyond the scope of this book. Displaying Timescaled Data in ExcelUsing the Analyze Timescaled Data Wizard in Project Professional, you can export and display timephased or timescaled information in an Excel 2003 graph or chart. Timescaled data is task, resource, or assignment information distributed over time. NOTE The Analyze Timescaled Data Wizard does not export resource assignment information. To begin using the Analyze Timescaled Data Wizard, follow these steps:
TIP The Analyze Timescaled Data in Excel button appears on the Analysis toolbar. If you don't see it, from the menu, select View, Toolbars, and then click Analysis. Project Professional Integration with VisioUsing Microsoft Project's export to Visio functions, you can create graphics that can be imported into a Visio diagram for enhancement, annotation, and inclusion in another document. Another use for these graphics could be communicating project information in a visual format to team members by displaying the graphics in the project's workspace. NOTE Technically, the features reviewed in this section do not require Project Server and can be done with any Microsoft Office Project offering (2000 or later). These features are worth mentioning here because they assist with communication and collaboration, which are two of the main motives for implementing EPM. Also, these functions are not examined in other resources. Visio WBS Chart WizardIn previous versions of Project Server, the WBS tool was a third-party add-on. With Microsoft Project 2003, you can display project information in a Visio chart with a few simple clicks. TIP The Visio WBS Chart Wizard button appears on the Analysis toolbar. If you don't see it, from the menu, select View, Toolbars, and then click Analysis. To begin the Visio WBS Chart Wizard, follow these steps:
TIP If you want to include only selected tasks in the Visio WBS chart, first change the value in the Include in WBS Chart field to Yes for those tasks. Importing Project Schedule Data to a Visio TimelinePresentations for customers and upper-management should be designed to be clear, yet thorough. You want to offer a schedule that is readable and presents only the milestones and necessary high-level information. Your Microsoft Project schedule can be presented in a simple format by exporting the timeline data to Visio. Using the Import Project Data Wizard, you can quickly and easily import your project information into Visio 2003 (see Figure 23.9). Subsequently, you can cut and paste your timeline from Visio into PowerPoint or display it as a graphic on your project workspace. Follow these steps to import your project schedule to a Visio timeline:
Figure 23.9. Microsoft Project information presented as a Visio timeline. NOTE If you have shapes on the current drawing page, Visio places the timeline on a new page in your current drawing. Exporting a Visio Timeline to a Project ScheduleYou can also export your timeline data created in Visio to Microsoft Project. This is handy if you want to create your timeline in a graphical interface and let Project Professional pull it into a schedule for you. Creating a timeline in Visio and then exporting it to Microsoft Project is a two-part process. First, follow these steps to create your timeline in Visio:
NOTE Visio allows you to export only one timeline at a time. If your drawing contains more than one timeline on the page, select the one to export. This rule does not apply to expanded timelines. If the timeline you are exporting includes an expanded (child) timeline that contains more data (such as milestones) than appears on the parent timeline, a dialog box asks whether you want to export all markers on the timeline's expanded child timeline. To export your completed Visio timeline to Microsoft Project follow these steps:
CAUTION When exporting a timeline to Project, the tasks will be created with a Start No Earlier Than constraint. If this is not what you prefer, simply select all the imported tasks when you are viewing the project in Project Professional and reset the constraint type in the Task Information dialog box to As Soon As Possible. Importing a Gantt Chart from a Project ScheduleA new feature of Microsoft Office Project 2003 is the Copy Picture to Office Wizard, which resides on the Analysis toolbar. This function is self-explanatoryit assists you in copying a picture of the active view of your project to a new document in most of your favorite Office programs. Your choices for the target application are PowerPoint, Word, or Visio (version 2000 or later). The wizard steps you through the entire exporting procedure. Your project schedule can also be presented in a formatted Gantt chart by using Visio. You might prefer using a Visio-generated graphic rather than one generated from Project to send to stakeholders who might not have Project Professional on their computers. With a Gantt chart import, you'll get more detail than you would with an exported timeline, which might be useful for team meetings. Here's how to create your schedule in Visio and then export it to Project:
TIP Gantt charts you import to a currently open drawing may have different colors than your original drawing. To change the color scheme for your new drawing, right-click a blank area on the drawing page and then click Color Schemes. Exporting a Visio Gantt Chart to Project a ScheduleYou can also export a Visio-created Gantt chart to Microsoft Project. This is handy if you want to create your Gantt chart in a graphical interface and let Project Professional pull it into a schedule for you. Follow these steps to create a Gantt chart in Visio and export it to Microsoft Project. First, create your Gantt Chart in Visio:
TIP Task dependencies can also be set in four other ways:
To export your completed Gantt chart from Visio to Project, follow these steps:
NOTE To export data to Microsoft Office Project, you must have Microsoft Office Project 2000 or later installed on your computer. |

EAN: 2147483647
Pages: 227