Understanding the Standard Reports
| < Day Day Up > |
Understanding the Standard ReportsThere will probably be circumstances when printing views from Microsoft Office Project doesn't give you the information you need or the format you'd prefer. The Gantt Chart view might not provide enough detail, or perhaps you'd like to see your project data in a text format instead of graphically. The reports in Project can provide the solution. Accessing the Standard ReportsThe Reports command on the View menu provides access to the Reports dialog box, which lists six groups of report formats: Overview, Current Activities, Costs, Assignments, Workload, and Custom (see Figure 22.1). Together, the first five groups contain 22 predefined Project Summary, Calendar, Task, Resource, and Crosstab reports that are set up and ready to print. The last report category, Custom, allows you to access reports that are not available in the other five groups and create your own reports. Methods for creating and customizing reports are discussed later in this chapter. Figure 22.1. You can use the predefined reports to keep management and your project team informed of the status of all aspects of a project.
To select one of the report categories, either double-click the category button or click the button once and then click Select. After you select one of the category buttons in the Reports dialog box, another dialog box appears, showing the reports that belong to that category. For example, when the Overview Reports category is selected, the reports available in that category are shown (see Figure 22.2). To display one of these reports, you can either double-click the desired report icon or click it once and then click the Select button. Figure 22.2. The Overview Reports category provides five different kinds of reports. Most of the predefined reports available in Microsoft Office Project are variations of the four basic report types:
The Task, Resource, and Crosstab reports are the primary types used for reports in the Overview, Current Activities, Costs, Assignments, and Workload categories displayed in the Reports dialog box. The fourth report type, the Monthly Calendar report, can be used to create new reports, but there are no predefined examples of this type. There are also two unique predefined reports, the Project Summary report and the Base Calendar report, which are not based on any of the four report types previously mentioned. When you select a report to display, you see the report, based on your active project, in Print Preview mode. To read the text of the report, you need to zoom in on the preview page by clicking the magnifying glass button on the toolbar to zoom in or positioning your mouse anywhere on the report. The mouse changes to a magnifying glass, and you can click to zoom in to that part of the report. Common Report ElementsMost of the reports in Project have headers at the top. The information displayed in the header is based on the properties entered for the project. You choose File, Properties to add or modify this information. Headers most commonly contain the Title and Manager fields from the Properties information, as well as the current date, as set in the Project Information dialog box. The default setting for footers in most reports is the page number. Sometimes other fields are included in the header or footer as well. TIP To change the header for a report, simply change the information stored in the Properties dialog box. For example, if you want the name of the project manager to appear in the header, choose File, Properties and then type the manager's name in the Manager field of the Properties dialog box. In addition to standard headers and footers, there are common structural elements in most report definitions:
As you explore and preview the predefined reports, look for the settings of these common elements. Later in this chapter, we'll discuss how to change these settings and customize the reports. NOTE If you have modified the field list or column settings in the supplied Project tables, your changes are included in your reports. The examples given in this chapter are based on the default tables provided with Project. The Overview Reports CategoryThere are five supplied overview reports : Project Summary, Top-Level Tasks, Critical Tasks, Milestones, and Working Days (refer to Figure 22.2). These five reports are described in Table 22.1. Together, these reports display summary data over the life of the project. They are useful as documentation for presentations to management after the initial design period has been completed, as well as status reports while the project is underway. Table 22.1. Reports in the Overview Category
Three of the reports in the Overview category are based on the standard Task report type. Each provides a list of tasks, columnar information about those tasks as defined by the report's underlying table, and supporting details for the tasks, such as predecessor and successor information and resource assignments. If notes have been included in the project, they are printed along with the task list. An example of a task report in this category is the Critical Tasks report shown in Figure 22.3. Figure 22.3. The Critical Tasks report is a typical Task report in the Overview category. Two reports in this category warrant special discussion. The Project Summary report is not based on one of the four standard report types. It provides a printout of the highest-level project information ”baseline, schedule, and actual values. The Working Days report prints the settings for the calendar you choose. In this type of report, standard working days and all exceptions ”that is, nonworking days and days with altered work hours ”are given in a summarized, noncalendar format. The Project Summary ReportThe Project Summary report displays on one page the most significant project information. This report is useful for status meetings with a project team or senior management. Because the Variance and Remaining fields are calculated, this report is a good summary to have at the completion of the preliminary planning for a project, before work on the project actually begins.
The Project Summary report has six sections : Dates, Duration, Work, Costs, Status (for both Tasks and Resources), and Notes (see Figure 22.4). The headings at the top of the report display the Title, Company, and Manager information if they were entered into the Properties dialog box for the project. The date displayed comes from the Current Date option in the Project Information dialog box. You can choose Project, Project Information to display the Project Information dialog box and adjust this date. Figure 22.4. The top half of the Project Summary report displays the report headings, a comparison of dates, and durations. With the Project Summary report, you can make comparisons between what is currently scheduled, what the baseline indicates, and what actually happened . The Task Status section displays the number of tasks not yet started, the number of tasks in progress, and the number of tasks completed in the project (see Figure 22.5). The number of overallocated resources is also shown. If Comments were entered on the Summary tab under the Properties dialog box, they appear in the Notes section. Figure 22.5. The bottom half of the Project Summary report compares work, costs, and the status of the tasks and resources. The Working Days ReportThe Working Days report provides a list of the working and nonworking times for each base calendar used in a project. Using this report is an excellent way to verify that the appropriate working hours have been established and that holidays and other nonworking times are incorporated into a project. The information for each base calendar is printed on a separate page. Figure 22.6 shows information for a modified standard base calendar being used in this project. Figure 22.6. The Working Days report helps you verify the base calendars created for a project. The Current Activities Reports CategoryThe Current Activities category of reports focuses on tasks and provides a comprehensive status of the tasks as the project is under way. There are six reports in this category: Unstarted Tasks, Tasks Starting Soon, Tasks In Progress, Completed Tasks, Should Have Started Tasks, and Slipping Tasks (see Figure 22.7). Each of these reports is described in Table 22.2. Figure 22.7. The Current Activity reports are useful primarily after a project has started; each focuses on specific groups of tasks. Table 22.2. Reports in the Current Activity Category
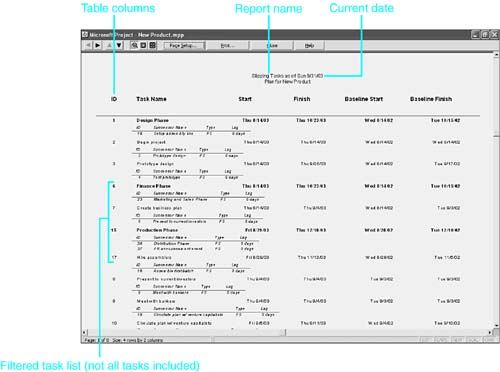
The Current Activity category of reports provides quick snapshots of project progress. You can use this type of report to get information on which tasks have yet to start (Unstarted Tasks), which tasks have finished (Completed Tasks), and which tasks have recorded some progress but are not yet finished (Tasks In Progress). The Tasks Starting Soon, Should Have Started Tasks, and Slipping Tasks reports provide tasks' status against their anticipated start and finish dates. They are good indicators of whether the project is generally on or off track. The Slipping Tasks report shown in Figure 22.8 is representative of this category. Figure 22.8. The Slipping Tasks report in the Current Activities category lists tasks that are not finishing as planned. CAUTION Several of the supplied reports rely on project Baseline fields for comparisons. If you have added tasks after saving the baseline, make sure to update the baseline again for the tasks you added and any tasks that might be affected by adding the new tasks, to make sure that all relevant tasks are displayed in reports. The Cost Reports CategoryKeeping accurate track of the project budget is a significant concern for most project managers. The five reports in the Cost Reports category ”Cash Flow, Budget, Overbudget Tasks, Overbudget Resources, and Earned Value ”provide a broad range of cost data that is essential when you're trying to stay within a budget for a project (see Figure 22.9). The reports are described in Table 22.3. Figure 22.9. The reports in the Cost Reports category provide quick access to budget information. Table 22.3. Reports in the Costs Category
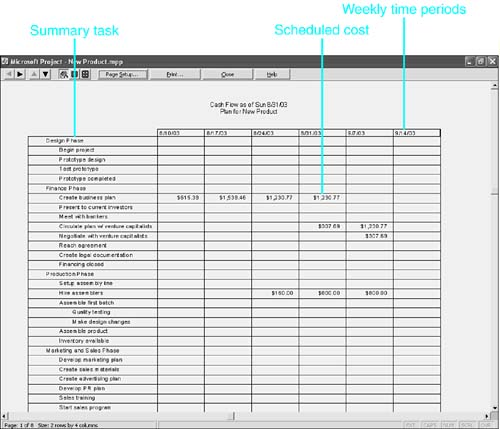
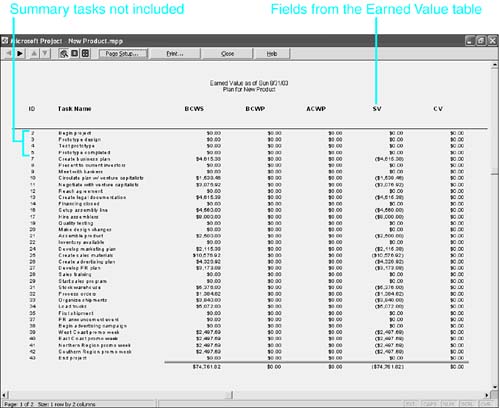
You can report on the anticipated expense over time by using the Cash Flow report, or you can see the current total budgeted amounts by task in the Budget report. The Overbudget Task report lists tasks that are currently running over their budgeted amounts, and the Overbudget Resources report shows resources that are currently reporting greater per-task expenses than originally planned. The Earned Value report derives its information from the fields in the Earned Value task table. The Earned Value report and the crosstab formatting of the Cash Flow report are discussed in this section. Most of the reports in this category are based on the Cost table in Project. You can modify the table to hide the Fixed Cost Accrual field because it is not as crucial as the other fields in the table, especially when you're presenting status reports to senior management or a project team. To hide a field in a table, simply resize the field so that it doesn't show in the Gantt Chart view. When you are finished printing the report, you can resize the column so that it once again fits the text. CAUTION Selecting a column and choosing Edit, Hide Column is the same as deleting the column in the table. You then have to edit the table definition or choose Insert, Column to add the column back. Variance calculations usually compare baseline values to scheduled values. Therefore, most of the Cost reports require that a project baseline be set before you create the report. Also, unless you are costing a project purely on a fixed-cost-per-task basis, appropriate resource costing rates need to be entered. The Cash Flow ReportThe Cash Flow report shown in Figure 22.10 is an example of a Crosstab report type. The focus of this report is on task details taken from the Task Cost table. The report shows tasks in the first column and weekly periods of time in the remaining columns. The subsequent grid or spreadsheet that is created contains cost information. The cost information in this report is derived from resource usage costs and fixed costs associated with tasks. Tasks are displayed underneath their summary tasks. Each column (week) and row (task) is totaled at the bottom and right edges of the report. Figure 22.10. The weekly costs depicted in the Cash Flow report are presented in the Crosstab report format. The Earned Value ReportThe Earned Value report is a cost-comparison tool that utilizes data from the Earned Value table. It allows you to compare the cost of what is actually happening on each task in the project to what you expected to happen. The Current Date field is used to calculate what costs have been incurred and what costs you expected to incur when you originally planned the project. The Actual Resource Costs and Fixed Costs fields are used to calculate the percentage complete of each task, as compared to what is entered in the % Complete database field. You can compare whether the estimated percentage completed matches the percentage completed of actual work done. For example, if a task is marked as 25% complete and the actual cost so far is $300, you can calculate whether $300 is equal to 25% of the originally planned cost ”the cost expected to be incurred by today for this task. NOTE Earned value analysis (EVA) was first developed by the U.S. Department of Defense in 1967 in response to contractors who often exaggerated their progress on cost reimbursable contract projects. EVA allows the consideration of various project elements ”including scope, cost, and schedule measurements ”in order to determine what value has been earned to date within the project life cycle. All normal tasks are displayed in an Earned Value report, sorted by their IDs. Summary tasks are not displayed in this report. Because the preview of this report is zoomed in, not all the columns of information are displayed in Figure 22.11. Figure 22.11. The Earned Value report allows you to precisely track progress of resource costs compared to percentage of work completed. The Assignment Reports CategoryThe Assignment category of reports displays information about the assignment of resources to tasks. There are four reports in this category: Who Does What, Who Does What When, To-do List, and Overallocated Resources. Figure 22.12 shows the reports in this group , and Table 22.4 describes them. Figure 22.12. The Assignment reports category includes reports that focus on resources and what they are scheduled to do. Table 22.4. Reports in the Assignment Category
The reports in the Assignment category focus on resources and their assignments. They offer different presentations of what work resources are assigned to perform and in what time periods. All work type resources are included in the Who Does What and Who Does What When reports. The To-do List report runs an interactive filter in which you choose which resource to focus on. A filter is automatically applied to the Overallocated Resources report; fully allocated and underallocated resources are not displayed in this report. TIP Using the by-day setting in the Who Does What When report can result in a long printed document. You should preview the report before printing it and consider restricting the printout to a time period that is shorter than the total project. After you decide on appropriate dates, enter them in the Timescale, From, and To boxes on Print dialog box. The Workload Reports CategoryThe Workload category of reports contains two Crosstab reports that display information about how resources are being used (see Figure 22.13). The reports focus on when and where resources are assigned, broken down by task or by resource, as summarized in Table 22.5. Figure 22.13. The Workload reports show how many hours each week a task will be worked on. Table 22.5. Reports in the Workload Category
When a project manager is juggling resources to accommodate overallocations or to speed up the project, Workload reports can be very useful in identifying resources that are not assigned to their full capacity. The Workload reports include numeric totals. Each week's hours are totaled at the bottom of the report; task and resource hours are totaled in the last column, at the far right of the report. The Workload reports include both work and material resources in the display. Four additional resource reports are available in the Custom report category that allow you to focus on either work resources or material resources:
These reports are available by selecting the Custom icon in the dialog box that appears when you select View, Reports. The Custom category of reports is discussed extensively later in this chapter, in the section "Customizing Specific Report Types." |
 For detailed information on the standard Project tables,
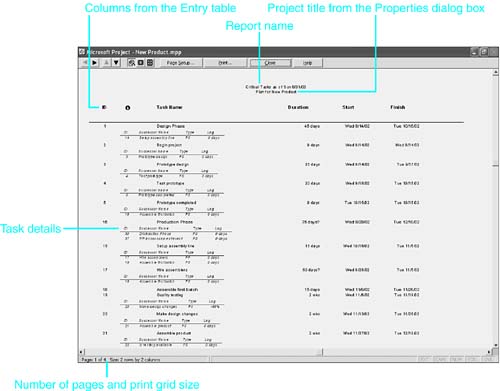
| < Day Day Up > |
EAN: 2147483647
Pages: 283