Formatting the Resource Graph View
| < Day Day Up > |
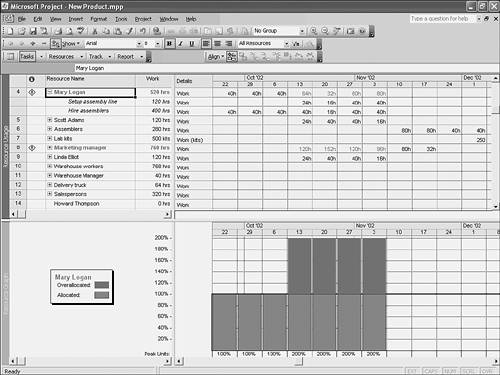
| The Resource Graph view shows values derived from the task assignments of one or more resources; these values are graphed along a timescale . To display the Resource Graph view, choose View, Resource Graph or click the Resource Graph icon on the View bar. Figure 20.33 shows a histogram, or bar chart (in the lower pane), for the allocated and overallocated task assignments for Mary Logan during the weeks of September 22 through November 10. The value displayed in this example is the peak units, or percentage of effort assigned during each time period (in this case, each week). Figure 20.33. The Resource Graph view, showing peak units, can be displayed below the Resource Usage view. You can use the graph to show the following measurements for a resource in a time period on each task:
The graph can show these measurements for one resource, for a group of resources, or for the resource and the group together. The values can be shown for selected tasks or for all tasks during each time period. If the Resource Graph view is displayed in the bottom pane below a task view, the displayed values are for one resource only. You can show values for this resource's assignment to the selected task or to all tasks during each period measured on the timescale. Figure 20.34 shows the assignment bars for Mary Logan, for all tasks during each month. This figure provides a quick glimpse of Mary's overassignment. Figure 20.34. A Resource Graph view below a task view shows bars for all task work in that period for a single resource. When the Resource Graph view is in the top pane or in the bottom pane but below a resource view, the values displayed are for all tasks and might be for one resource, for a group of resources, or for that one resource compared to the group of resources. If group data is displayed, the group is defined by the filter that is currently in use. For example, if the All Resources filter (the default filter) is in use, the data summarizes all resources for all tasks. Figure 20.35 shows the total costs associated with Mary Logan's task assignments, relative to the total costs of all resource assignments in the period. Figure 20.35. The Resource Graph view displays costs associated with a single resource compared to the costs of all other resources. Table 20.4 summarizes the values displayed for different placement locations for the Resource Graph view. Table 20.4. Values Shown in the Resource Graph View
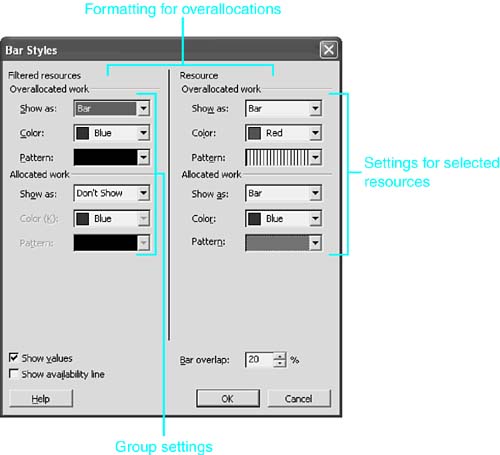
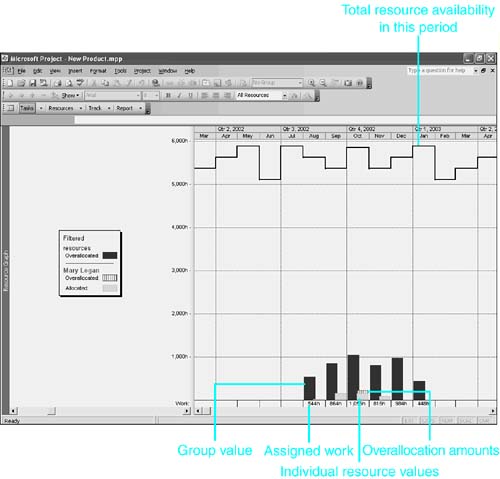
Reviewing the Format Options for the Resource Graph ViewAs with other views, the Zoom command on the View menu is available for the Resource Graph view and works as discussed previously in this chapter, to modify the timeframes that are displayed. Likewise, the Zoom In and Zoom Out tools on the Standard toolbar can be used in this view. The Format menu for the Resource Graph view contains dialog box options described previously in this chapter for formatting the timescale (if the graph is not in a bottom pane), gridlines, and text styles. The Bar Styles dialog box offers features that are unique to the Resource Graph. These features are discussed in the following section. The Format menu also provides a Details option. The choices on this list of calculated values control what information is displayed in the timescale portion of the Resource Graph view. Because the Bar Styles dialog box options are based on these values, the Details options are described first in the following section. Selecting the Values to DisplaySelecting Format, Details displays a list of choices of what values are calculated and graphed in the Resource Graph view. The following sections describe these choices. NOTE When Work is chosen in the Details dialog box, the unit (hours, minutes, or days) is determined by the Work Is Entered In option on the Schedule tab of the Options dialog box. The display of costs is determined by the Currency Symbol, Currency Placement, and Currency Decimal Digits choices on the View tab in the same dialog box. Displaying Peak UnitsThe Peak Units option on the Format, Details menu measures the largest percentage of effort of a resource assigned at any moment during each time period on the graph. If the effort units exceed the available number as set in Maximum Units on the Resource Sheet view, the excess is shown as an overallocation. An availability line shows the number of units available. Note that peak units are measured in effort assigned , not in work assigned. Therefore, peak units might mislead you when it shows an overallocation. Suppose a person is assigned full-time to two tasks during the same day. The peak units is 2, and because only 1 unit of a person is usually available per time period, the peak of 2 is displayed as an overallocation. If each of the two tasks is a one- hour task, however, the person should have no problem completing both tasks during the day. The Peak Units measurement is very useful with multiple-unit resources in which the number of maximum units available is more than one. In these cases, the overallocation warning is more likely to be accurate. Displaying WorkThe Work choice on the Format, Details menu is measured in hours and is the number of units of each resource assigned to each task, multiplied by the duration in hours of the tasks per time period displayed. For example, say two programmers are assigned to work on a task that is estimated to take one 8-hour day. Project calculates this task to have 16 hours of work. The amount of work to be done by the resource is determined by the number of units of the resource, the resource calendar, and the resource availability contour during the time unit. If the total work for the time period exceeds the available amount of resource hours, the excess is shown as an overallocation. Displaying Cumulative WorkAnother choice on the Format, Details menu is Cumulative Work. This is a measurement of the total work for the resource since the beginning of the project. This running total includes the work during the time period shown. Displaying OverallocationThe Overallocation value on the Format, Details menu shows the overallocation of work for the resource for the time period. The Overallocation option shows just the amount of the overallocation ”not any work hours that occurred during the normal work day. See the section "Displaying Work," previously in this chapter, for an explanation of how work is measured. Displaying Percent AllocationThe Percent Allocation value on the Format, Details menu is a measurement of the allocated work versus the available work. The Percent Allocation shows the amount of work as a percentage of the amount available. See the previous section, "Displaying Work," for the way in which Work is measured. Displaying AvailabilityThe Remaining Availability value on the Format, Details menu is a measurement of the unallocated work for the resource during the time period. The Availability option shows the unused or unallocated work time that is still available. This is a useful option when you want to see who has some available time to work on tasks or to see if you are available when new tasks are assigned to you. Displaying CostThe Cost value on the Format, Details menu is the scheduled cost of the resource work during the time period. If the resource cost is to be prorated (as defined in the Cost Accrual field on the Costs tab of the Resource Form view), the costs appear in the time period when the work is done. If there is a per use cost associated with a prorated resource, that cost is shown at the start of the task. If the resource cost is to accrue at the start or end of the task, the entire cost appears in the graph at the start or end of the task. Displaying Cumulative CostThe Cumulative Cost on the Format, Details menu display adds each period's cost to the preceding period's cumulative cost, to show a running total of costs. You can use this measurement to show total cost over the life of the project if you use only the group graph and include all resources in the group (see the section "Using the Bar Styles Dialog Box," later in this chapter). Displaying Work AvailabilityThe Work Availability option on the Format, Details menu graphically presents the total number of hours a resource is available in a timeframe. This display is based on resource maximum units and the resource calendar. It does not reflect any work assignments that might exist in the period. Displaying Unit AvailabilityThe Unit Availability option on the Format, Details menu reflects the same information as the Work Availability detail option, but the resource availability is expressed as percentages. Using the Bar Styles Dialog BoxThe Bar Styles dialog box enables you to specify what type of graph you would like to display (that is, Bar, Area, Step, Line, and Step Line graphs), if any, as well as how it should look. You can also use this dialog box to specify whether you want to see groups or just selected resource information. When the Resource Graph view is displayed, choose Format, Bar Styles to open the Bar Styles dialog box. A different Bar Styles dialog box appears for each of the value measurements just described. However, all these dialog boxes have the same layout and are used the same way. Figure 20.36 shows the Bar Styles dialog box for the Work value. As with all the Resource Graph view Bar Styles dialog boxes, this box has four main sections plus three options at the bottom of the box. Figure 20.36. You can use the Bar Styles dialog box to set the options for displaying work values on the Resource Graph view. NOTE The different areas of the Bar Styles dialog box that are available depend on the Details option that is set by choosing Format, Details. The two top sections of the Bar Styles dialog box specify the display of overallocated amounts (if applicable ), and the two bottom sections set the display of the allocated value up to the maximum available. The sections on the left side of the dialog box are for specifying the display of group data, and the sections on the right side are for specifying the display of one selected resource. Be aware that some of the values on the Details menu can display only two of the sections. After the dialog box is closed, you might see sets of double bars, and each bar might have an upper and a lower segment. The upper segment is the overallocation measurement. The lower segment is the allocation up to the overallocation level. Where you see pairs of bars, the left bar is the group measurement, and the right bar is the selected resource measurement (note the similarity of the positioning of the bars to the positioning of options in the dialog box). Recall that the resource group is defined by the filter that is applied when the Resource Graph view is in the top pane or is displayed as a single pane. In this case, the group represents all resources because no filter has been applied. In Figure 20.37, the bar on the right is the bar for the resource (Mary Logan), and the left bar is the bar for the group (all resources, in this case). The striped upper portion of the resource's bars are her overallocations. At the bottom of the graph, the work values are displayed in the time periods where the resource is allocated. Figure 20.37. The Resource Graph view demonstrates overallocation of a single resource compared to the entire resource pool. All these features are defined by the dialog box. (The graph in Figure 20.37 is defined by the settings in the dialog box in Figure 20.36.) The Show values box is selected so Project will display numeric data along with the bars. The bars overlap by 20% to show that they are paired. The graph shading patterns are determined by the selections in the four sections of the dialog box. For each section, you choose three features that determine how the value is represented. Use the Show As drop-down list to choose the general format. Bar is the usual choice, but you can also use lines and areas. The Don't Show choice suppresses all representation of the value. You can select the Color of the image as well as fill the bar or area with a Pattern. You manage what is graphed by choosing what to display or not to display in each of the four sections of the Bar Styles dialog box. If you want to display only the values for the selected resource, with no representation of the group values, you choose Don't Show from the Show As drop-down list for both sections on the left. If you want to show only the totals for all resources, you choose Don't Show for both sections on the right. When you choose Overallocation on the Format, Details menu, the Bar Styles dialog box has both of the bottom sections dimmed, to show that the sections are not needed. When you finish making changes, click OK to implement them or click Cancel to ignore them. |
 For more information about resources that are overallocated,
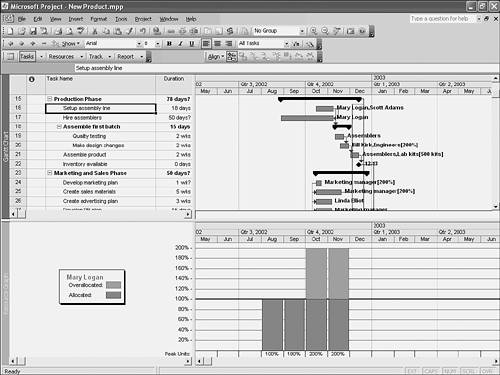
| < Day Day Up > |
EAN: 2147483647
Pages: 283