Using the Common Format Options in the Standard Views
| < Day Day Up > |
| Views are basically broken down into three category types: sheets, forms, and graphical views. Views of the same type share similar customizing options. Sheet and graphical views all contain gridlines; therefore, you can use the Format, Gridlines command to change the appearance of the gridlines in all those views. Many graphical views also contain timescales, and you can also use the Format, Timescale command in those views. Use the Format, Text Styles command to change the font, size , and color of text in views. Options on the Format menu change the look of the current view. Suppose you change the timescale on the Gantt Chart view to show months instead of days. Until you change the timescale again, you see this format for the timescale each time you display the Gantt Chart view. However, if you switch to another view that also has a timescale (for example, the Resource Usage view), you find that the timescale in that view does not show the changes that were made in the Gantt Chart view but instead reflects the way the Resource Usage view was last displayed. Sorting the Tasks or Resources in a ViewSorting is especially relevant for views that display tasks or resources in a table or list layout. But you also can sort the order in which tasks or resources appear in the form views as you scroll with the Next and Previous buttons . You cannot sort the displayed items in the Relationship Diagram view, however. Sorting enables you to arrange lists by a number of predefined fields, as well as a combination of up to three columns or fields that you specify. The predefined fields for sorting vary from one view to another. For example, in a resource view, predefined sort fields include By Cost, By Name , and By ID. The predefined fields in a task view include By Start Date, By Finish Date, By Priority, By Cost, and By ID. To sort the entries in a view, choose Project, Sort. A cascading menu appears, and it contains the predefined sort fields (see Figure 20.1). If you choose from one of these, the tasks or resources are sorted immediately, based on that one field and in ascending order. If you select the Sort By option, the Sort dialog box appears, offering more choices (see Figure 20.2). Figure 20.1. The cascading sort list offers easy access for sorting tasks or resources. Figure 20.2. The Sort dialog box offers extensive options for sorting. Selecting the Sort KeysIn the Sort dialog box, you use the drop-down list in the Sort By area to select the major sort field, and then you can select the Ascending or Descending button to specify the sort order. If you want to further sort the list within the groups that are placed together by the first sort field, you can specify the two Then By fields, and indicate the sort order for each of these fields. In addition to sorting on the predefined fields supplied with Project, you can also sort tasks or resources by custom fields, including outline and Work Breakdown Structure (WBS) codes you create. If a custom field has been renamed , both the generic field name and its alias appear in the sort key lists. Selecting the Sort OperationAlthough you can undo a sort, it is a good idea to save a project file before sorting, just in case. After you define the fields to sort by, you need to indicate whether you want the sorted tasks or resources to be permanently renumbered; they will be given new ID numbers . For task views, you can also choose to keep all tasks under their summary tasks but sort subordinate tasks within their summary task, by marking the Keep Outline Structure check box. To sort all tasks without regard for their position within an outline, clear this box. For resource views, there is also a check box for sorting the resources by the projects to which they are assigned. This option is useful when you are using a pool of resources for more than one project. To sort the list immediately, click the Sort button. To return the sort keys to the standard sort ”by ID numbers only ”click the Reset button. Note that clicking Reset does not display the original order of the list if Permanently Renumber Tasks was selected. CAUTION Be careful with the Permanently Renumber option. If Project objects such as filters or macros address list items by their ID numbers, permanently renumbering them can have unexpected results. Formatting Text Displays for Categories of Tasks and ResourcesMost of the views in Microsoft Project enable you to choose special formatting options for displaying text. You can differentiate categories of tasks or resources by the font, type size, style, or color of text used to display the data. For example, you can format names of critical tasks to be displayed in red or milestone task names to appear in italics. Text formatting also defines the appearance that highlight filters apply to items displayed selected by the filter. To change the display of text for categories of tasks or resources in a view, choose Format, Text Styles. The Text Styles dialog box appears (see Figure 20.3). Figure 20.3. You can use the Text Styles dialog box to change text attributes for categories of tasks or resources. NOTE If the Text Styles command doesn't appear in the Format menu, you can't change the text display in the current view. To change the text display for selected tasks or resources that don't fall into any particular category, see the section "Formatting Selected Text," later in this chapter. CAUTION You cannot reverse text formatting changes by using Undo, and there is no Reset button. Regardless of how the changes were made ”whether a style was changed, or formatting was manually applied ”you must restore the original formatting manually. Selecting an Item to ChangeFrom the Item to Change drop-down list, choose the category you want to format. When a task or resource falls into two or more categories, some items in the list take precedence over others. The following are the task items, listed in descending order of precedence:
If a Milestone task is also a Critical task, for example, the display is governed by the text format for milestones. If the same task is selected by a highlight filter, the task shows the Highlight task format rather than either the Milestone task or Critical task formatting. A highlighted task is a task that is selected when a filter is applied as a highlighting filter. Choose the Highlight option under Project, Filtered For to display all tasks or resources but apply special formatting to the ones that match the filter criteria. TIP You can choose to highlight tasks selected by a filter rather than hide tasks that weren't selected. To do so, press the Shift key while choosing a filter under Project, Filtered For. Alternatively, you can select Project, Filtered For, More Filters and use the Highlight button to apply a filter. Marked tasks have the logical value Yes in the Marked field of the Project database. You can use the Marked field to manually select tasks of interest without defining a filter or defining a custom field (or when there is no logical test that can be expressed for the filter).
The All item in the Item to Change drop-down list on the Text Styles dialog box enables you to easily make a change in all text categories at one time. For example, you might use the All item initially to set an overall font type or size. You can then override the font and size on individual categories. If you later choose the All category again, however, and make a change in the font or point size, any of your earlier manual changes are lost. The items listed after All are specific to tasks or resources, depending on which type of view is currently displayed. After all, those type-specific text categories are items that are specific features of the active view. When the Gantt Chart view is the active view, for example, the first text items listed deal with tasks. After that, the item list includes general formatting options for the view. The following text style items are available for the Gantt Chart view:
The following text style items are available for the Resource Usage view:
Changing the Font, Style, and Color of Text DisplaysThe Text Styles dialog box is similar in use and appearance to text formatting dialog boxes in other applications, such as Microsoft Word. You can use the Text Styles dialog box to change the assigned font, font formatting (that is, regular, bold, italic, and bold italic), point size, and color. A single style of underlining is also available in this dialog box. Click Reset to clear any previous formatting choices and return to the default settings for the style. You use the Color drop-down list in the Text Styles dialog box to choose the color for the selected item's text. If you don't use a color printer, all the colors print as black with grayscale shading. The clear color option causes an item's text to be transparent in the display, although the row for the item still appears onscreen and on paper. Onscreen color provides useful visual clues even if you don't print in color. Formatting Selected TextYou can make formatting changes to selected text items instead of to categories of styles. To do so, you use the Format, Font command and the Formatting toolbar to apply manual formatting. The choices that are available via the Format, Font command are the same as the choices in the Text Styles dialog box, except that you don't have a choice about what item to change. Changes that you make in this dialog box are made to any tasks that are selected , not to categories of tasks or resources. The Formatting toolbar offers drop-down lists of common formatting options: font and point size; bold, italic, and underlined text; and left, center, and right alignments.
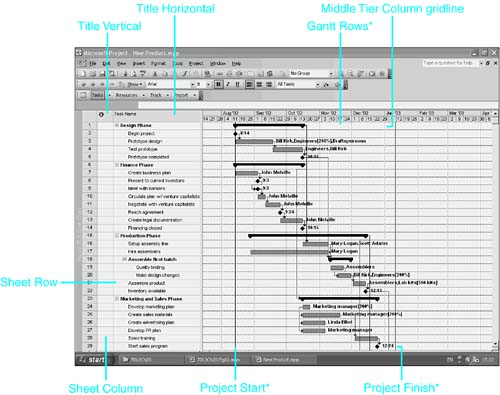
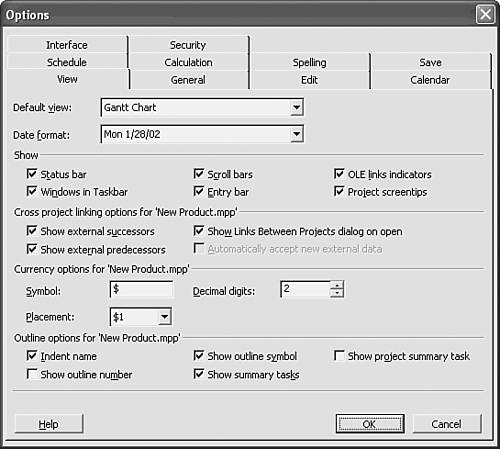
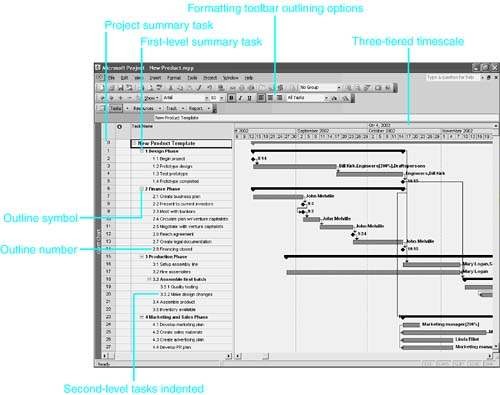
NOTE The difference between using Format, Text Styles and applying manual formatting is significant. With manual formatting, you are making changes to selected text only ”not to categories of tasks or resources. When additional tasks or resources belonging to a certain category are added, formatting applied by using the Format, Font command, the Formatting toolbar, or the Format Painter are not taken into account. Formatting GridlinesGridlines add visual guides on tables and timescales. Many gridlines are drawn by default. Gridlines are drawn between the rows and columns of a table, between column titles, and between units on the timescale. You can add gridlines to views; for example, you can add gridlines between the bars in the Gantt Chart view. A very useful single gridline is the current date that appears by default on several views, including Gantt Chart views. To format gridlines for the current view, choose Format, Gridlines, and the Gridlines dialog box appears (see Figure 20.4). (You can also access the Gridlines dialog box by pointing to any blank area of the Gantt Chart view and right-clicking. The Gridlines option appears on the shortcut menu.) The options in this dialog box vary, depending on the applied view; Figure 20.4 shows the Gridlines dialog box for the Gantt Chart view. Common gridlines are shown in Figure 20.5; in the figure, gridlines that are not displayed by default on the Gantt Chart view are marked with an asterisk (*). Figure 20.4. You can change the way gridlines look by using the Gridlines dialog box. Figure 20.5. Gridlines can add clarity to a view. From the Line to Change list in the Gridlines dialog box, choose the kind of gridline you want to change. The settings in the Normal section are applied to every line of the type that you choose, unless a selection in the At Interval section is also active (in which case, a different line and color appear at regular intervals). Only a few line categories can be given a distinguishing interval line type and color. Sheet Row and Sheet Column gridlines in table views, for example, can have intervals, and in the Gantt Chart and the Resource Usage views, rows and columns can have interval colors and line types. You can use the Type drop-down list in the Normal section of the Gridlines dialog box to choose one of the five options (no line, solid, dotted , small dashes, and large dashes). Use the Color drop-down list section to choose a color. You can select the At Interval line type and color if you want a distinguishing line (if available). You can activate the At Interval Type and Color fields by choosing an interval: Choose 2 for every other row or column, or 3 or 4 for every third or fourth row or column. Or, you can choose Other and type the desired interval number. Using the Outline OptionsViews that list tasks (such as the Gantt Chart and Task Sheet views) can display tasks in ways that show information about their places in the outline structure. You can hide or display summary tasks, indent subordinate tasks to show their level in the outline, display outline numbers next to each task, and display summary tasks either with or without a special symbol to show that they have subordinate tasks. To change the display of outlined tasks, choose Tools, Options. The Options dialog box appears. Click the View tab. The outline display default options are shown in Figure 20.6. Figure 20.7 shows the effects of each of these choices when they are marked. Figure 20.6. Options for displaying outline formatting appear on the View tab of the Options dialog box. Figure 20.7. An overall project summary task is calculated automatically by Project. NOTE Make sure you're in a view that can display outlines (for example, the Gantt Chart view or the Task Sheet view) before you access the Options dialog box. Otherwise, the Outline Options section won't be available. In the View options dialog box, the Show Summary Tasks option is selected by default, so you see the summary tasks included in the list of tasks. If the Show Summary Tasks check box is not marked, the summary tasks do not appear in the list. If subtasks are hidden when you turn off the summary task display, those subtasks stay hidden. The outlining commands on the Formatting toolbar are not available when summary tasks are not shown. Hiding summary tasks is useful when you're applying filters or sorting a task list. If the Indent Name box is turned off, the indentations are removed and all tasks are aligned at the left margin. A project summary task is a special task that summarizes and rolls up the entire project. You can choose the Project Summary Task option to display a project summary task at the beginning of the task list (with task ID number 0). This feature is particularly useful when you're consolidating projects. If the Show Outline Number check box is selected, each task name is preceded by an outline number that identifies each task's place in the outline. The outline numbering is in the so-called legal style, with each task number including the related summary task numbers. This is the same number you see for WBS codes in the Task Information dialog box on the Advanced tab, unless a custom WBS has been created. If the Show Outline Number check box is not selected, outline numbers are not displayed as part of the task list. If the Show Outline Symbol check box is selected, each summary task is preceded by a plus (+) or a minus ( “) sign. A plus sign indicates that the summary task has subtasks that are not currently being displayed, and the minus sign indicates that all tasks under the summary task are showing. TIP When you are printing reports that include outlined tasks, you can save space by turning off the Indent Name option. If you do this, you should turn on the Show Outline Number option so that you can see your outline structure.
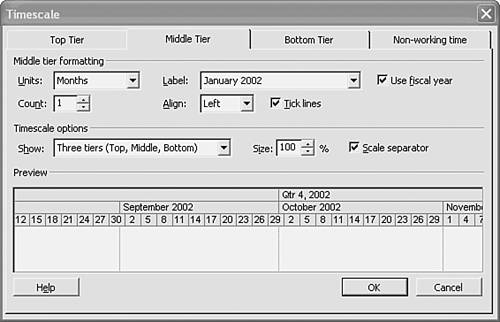
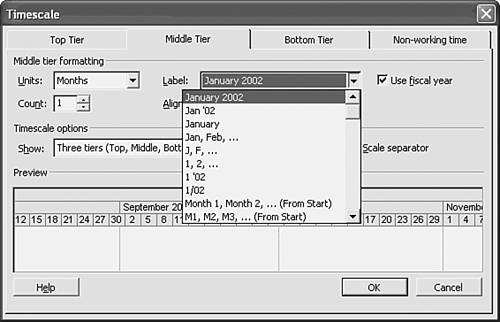
Formatting TimescalesViews that display timescales offer you the option of choosing the time units and the date formats for each level of the timescale display. Project 2003 provides three levels, or tiers, to the timescale. To change the timescale, choose Format, Timescale. The Timescale dialog box appears (see Figure 20.8), with options for defining all three timescale tiers. A sample display area instantly previews what the timescale looks like as you select different options. Figure 20.8. You can be very specific about how the timescale is displayed by using the numerous options in the Timescale dialog box. TIP You can also access the Timescale dialog box by double-clicking anywhere timescale units are displayed or by right-clicking the timescale headings and choosing Timescale from the shortcut menu. TIP You can also use the View, Zoom command to zoom in on a variety of predefined time periods, including the entire project. Changing Timescale TiersThere are three tiers that can be displayed on the timescale ”the top, middle, and bottom tiers. In the Timescale dialog box, there is an option to show one or more of these three tiers. If you choose to display a single line on the timescale, it will be defined by the bottom tier settings. Choosing to display two tiers will add the middle tier to the bottom tier display. You can also turn on all three tiers. You can define the three tiers of the timescale separately, but they are defined within the same dialog box. The only requirements are as follows :
You can use the Units drop-down list in the Timescale dialog box to choose one of the time period options provided: Years, Half Years , Quarters, Months, Thirds of Months, Weeks, Days, Hours, or Minutes. To include more than one time period within each major unit, choose the Count text box and enter a number other than 1. To have a scale show fortnights (that is, two-week time periods), for example, you would select Weeks as the Units and 2 as the Count. To get the same effect, you could also select Days as the Unit and 14 as the Count. Keep in mind that the Label options are different for weeks and days, and this might influence which format you use. NOTE If the tick lines that separate the units of the scales don't change in the sample area immediately after you change the count, you might need to select the Tick Lines check box twice to refresh the tick line display. To choose the label to display in each major scale time unit, you use the Label drop-down list in the Timescale dialog box. The list of options is extensive and depends on the units selected for the display. You can use three basic types of labels for any of the time units:
You can center, left-align, or right-align the time unit labels by choosing from the Align drop-down list. Also, you must select the Tick Lines check box in order to display vertical separator tick lines between the larger time unit labels. Additional settings are available for displaying and labeling periods in a fiscal year format. Each tier can reflect either calendar years (the default) or fiscal years. You must change the Fiscal Year Starts In option on the Calendar tab of the Options dialog box in order to change the month that begins the fiscal year (so that Quarter 1 covers the months used by your organization in its reports). Using the drop-down list, you can change from the default, January, to the month you want to use. If you choose a month other than January, you can select the Use Fiscal Year check box to indicate that you want to use the starting month for fiscal year numbering. Similarly, if you want the week ”and the timescale labels ”to begin on a day other than Sunday (the default), you must change the Week Starts On item. Completing the Timescale DefinitionThe two options for Size and Scale Separator in the Timescale dialog adjust the overall look of the timescale. To change the width of the timescale units displayed, you choose the Size box and enter an adjustment percentage. For example, if the values in the Resource Usage view are too large to fit within the cells of the lowest displayed timescale units, type 120 or 150 to enlarge the unit space. Likewise, if you are happy with your timescale settings but you want to shrink the whole view so that more fits on the screen or on paper, you can choose a number smaller than 100%. You can remove the horizontal line that separates the labels on the tiers. To do so, simply clear the Scale Separator check box. After you enter all the changes, click OK to put the new timescale format in place. As with other formatting options, the timescale changes affect only the display of the view that was active when you changed the timescale. Each timescale view has its own timescale format. CAUTION
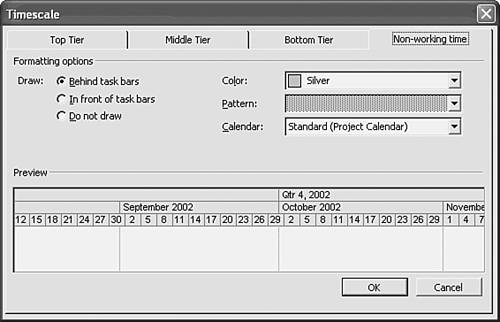
Changing the Display of Nonworking TimeBase calendars in Project consist of working days, with default or nondefault work times, and nonworking days. You can use settings on the Nonworking Time tab in the Timescale dialog box to change the way nonworking calendar time is displayed on the Gantt chart. The choices on this tab are shown in Figure 20.10. Figure 20.10. You can change or turn off the display of nonworking time on the Gantt Chart view in the Timescale dialog box. CAUTION Don't confuse the shortcut menu available in the body of the Gantt Chart view with the shortcut menu for the timescale. The shortcut menu for the timescale provides a Change Working Time option that accesses the calendar and enables you to redefine what should be considered nonworking time. The shortcut menu for the body of the Gantt Chart view, on the other hand, provides a Nonworking Time option that simply changes the way nonworking time is displayed. You can choose the calendar for which you want the nonworking time displayed. The Standard calendar is used by default because it is the project's underlying calendar unless a different one has been designated via the Project, Project Information command. You can use the Calendar drop-down list if you want to select and display an individual's resource calendar or an alternative base calendar. The options in the Draw section of the Timescale dialog box determine the way the bars that span nonworking time (evenings and weekends, for example) are drawn. Nonworking time is shaded with a color and pattern of your choice. Whether this time is displayed depends on the timescale format. For example, you can't see nonworking days unless a tier in the timescale displays days or smaller units. But you will see, in zoomed-out settings, any complete weeks marked as nonworking time. The options for where the shading is drawn include Behind Taskbars (the default), In Front of Taskbars (leaving a gap in the bars), and Do Not Draw. The Do Not Draw option effectively eliminates the shaded display of nonworking time altogether. Nonworking time is still displayed, but the display is no different from that for working time. Taskbars that span nonworking time simply look longer than you might expect from their duration values. NOTE Choosing the Do Not Draw nonworking time option does not change the Gantt Chart view to a five-day working week. Weekends are still shown ”just not in a pattern or color. Choosing the display of nonworking time in front of the taskbars helps indicate that the tasks are not being worked on (over weekends, for example). The bars are longer not because the tasks' durations are longer but because they span nonworking time.
Using Page BreaksA page break forces the start of a new page when you print the view but has no effect on the screen display, other than displaying an optional dashed line to indicate where the page break falls within the list. You can format the appearance of the page break line by using the Format, Gridlines command. To force a page break in the views that permit it, select any cell in the row below the intended page break. This row will become the first row on the new page. Then choose Insert, Page Break. To remove a page break, select the row below the page break and choose Insert, Remove Page Break. To remove all page breaks from the view, select all tasks by clicking the Task or Resource Name column heading or by clicking the Select All square above the ID column, before choosing Insert, Remove All Page Breaks. The page breaks that you enter manually are honored by the Print command only if the Manual Page Breaks check box in the Print dialog box is marked. To print the report without using the manually inserted page breaks, clear the check box. |
 For more information on creating and using custom fields,
| < Day Day Up > |
EAN: 2147483647
Pages: 283