Identifying Resource Overallocations
| < Day Day Up > |
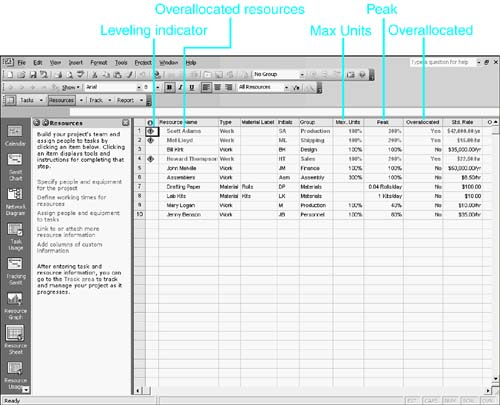
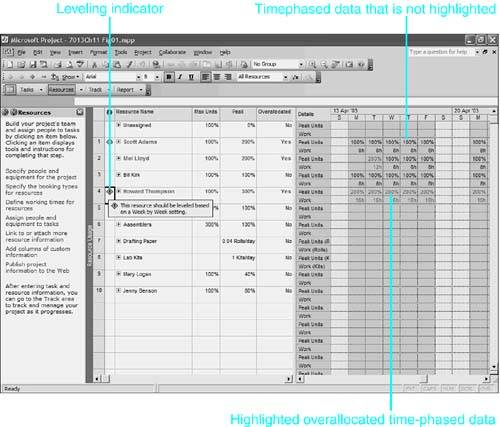
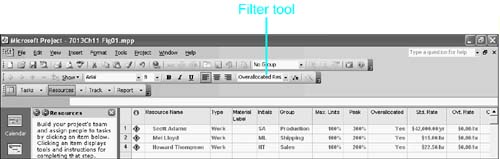
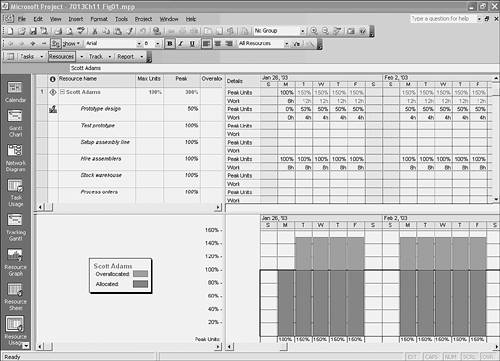
| Project alerts you when resources are overallocated by highlighting them in any view that displays a resource table. For example, the Resource Sheet, Resource Usage, and Resource Allocation views all highlight overallocated resource names by using red text. In the Resource Sheet view in Figure 11.1, three resource rows are highlighted: those for Scott Adams, Mel Lloyd, and Howard Thompson. Figure 11.1. Views that display resource tables highlight the names of overallocated resources in red (shown here in bold). NOTE By default Project uses red text to highlight overallocated resources. Because that color doesn't show up well in this book's black-and-white figures, we've used a bold black font as the highlight in the figures. Where we mention highlighted overallocations, look for red text on your screen and for bold text in these figures. NOTE You can modify the format for overallocated resources in any resource table by choosing Format, Text Styles to display the Text Styles dialog box. In the Item to Change box, select Overallocated Resources from the drop-down list. Use the other controls in the dialog box to create the style you want. When you're finished, click OK to implement the change. Recall from Table 11.2 that in this example, the overallocation is due to more work being scheduled in a given time period than the resource is allowed to work (based on the availability defined by the maximum available units for the given time period and the working hours on the resource calendar). The cause of the overallocation is that the sum of the assigned units exceeds the max units for that period. Project maintains a calculated field named Peak, which shows for any designated time period the largest number of simultaneously assigned units during that time period. Project also maintains a calculated resource field named Overallocated that contains Yes if Peak is greater than Max Units for any time period and No if otherwise . If the Overallocated field contains Yes, the resource is highlighted in red onscreen. Figure 11.1 shows the Resource Sheet view with both the Peak and Overallocated fields displayed to the right of the Max Units field. The Max Units field displays the maximum units for the current date and is taken from the Units column of the Resource Availability table in the Resource Information dialog box. TIP The current date is normally determined by the computer's internal clock, but you can set the current date to any date. To do so, open the Project Information dialog box (by choosing Project, Project Information) and change the Current Date field. The column for Peak in Figure 11.1 shows the peak units for the life of the project; the value displayed is the largest amount of simultaneously assigned units (the peak resource requirement) at any time in the project. Thus, the peak of 300% for Scott Adams means that at some point during the project, Scott's simultaneous assignments total 300% units. Mary Logan, on the other hand, is never required to provide more than 40% units at any time during the project. Three of the first four resources in Figure 11.1 are flagged as being overallocated because the Peak value exceeds the Max Units value. If the Overallocated field were not displayed, you would still know that these resources were overallocated because of the highlight used for the overallocated resources. NOTE Sometimes you might find that a resource appears in red even though its max units value is greater than its peak. The peak value (and the overallocation) occurs at a different time period from the current date, at a time when the maximum units value is lower than the peak units. In most cases, you need to reconcile overallocations because the schedule indicates that the resource can't possibly do what he or she is scheduled to do. You reconcile overallocations by leveling the workload for the resource by reassigning tasks to other resources, delaying tasks until the resource is available, or making other adjustments to the schedule (as discussed later in this chapter, in the section "Strategies for Eliminating Resource Overallocations"). Sometimes you can regard overallocation as a mere technicality that's simply a product of the way Project calculates schedules. For example, suppose a regular full-time employee is scheduled to work 100% on two tasks on a given day, and each task will only take an hour to complete. That's only 2 hours of work for the day and is hardly an overallocation for an 8- hour day. But if both tasks have been scheduled by Project to begin first thing in the morning, at 8:00 a.m., Project flags the resource as overallocated because the schedule calls for peak units of 200% at that time. In reality, the resource could easily finish both tasks in the day by delaying one task until the other is finished. You might prefer not to be bothered by dealing with overallocations like this when the conflict is small enough that the resource can adjust the schedule and finish its assigned work for the day. To help you focus only on overallocation cases that you think really warrant your rescheduling efforts, Project lets you choose a leveling sensitivity that it uses to flag the overallocations that are considered too severe to ignore. In the example just given, you would need to do something about the schedule if it is important that the project be on schedule on an hour-by-hour basis. But you might be content to let resources manage the conflicts as long as they can be on schedule on a day-by-day basis. You can choose the sensitivity setting for Project to use when evaluating overallocations in the Resource Leveling dialog box. Choose Tools, Level Resources, and select the setting in the box labeled Look for Overallocations on a Basis. The choices are Minute by Minute, Hour by Hour, Day by Day, Week by Week, and Month by Month. If you choose the Hour by Hour sensitivity setting (which means assigned work must be completed within the assigned hour), Project displays the Leveling indicator that you see in Figure 11.1. But if you choose the Day by Day setting, there is no indicator because the work will be completed within the assigned day. Table 11.2 shows an example where Scott Adams is overallocated for the day on a Thursday, but his workload for the week is fine. If you are content to let Scott manage the conflict by pushing back his Task C work until Friday, after he has finished Task B, the sensitivity setting can be defined as Week by Week, and there would be no Leveling indicator. All resources with any overallocation appear highlighted in resource tables, but if you don't see the Leveling indicator, the overallocation is acceptable within the boundaries of the leveling sensitivity setting. TIP You can rest the mouse pointer over the Leveling indicator to see the time period covered by the current sensitivity setting. This is quicker than opening the Resource Leveling dialog box, where the leveling sensitivity is defined. NOTE If a worker reschedules a critical task (that is, a task whose delay will delay the completion of the project), there are consequences to the finish date of the project. For this reason, you do not want to select an overly long sensitivity setting. In Figure 11.1 the resource names Scott Adams, Mel Lloyd, and Howard Thompson are highlighted, to indicate that there is at least one time period in which these resources' workloads exceed their availability. Both Scott and Howard have the Leveling indicator, so you need to look at the overallocations for those resources. Figure 11.2 shows the same resources in the Resource Usage view. In Figure 11.2 you can see the ScreenTip for the Leveling indicator next to Howard Thompson. The ScreenTip says "This resource should be leveled based on a Week by Week setting." Figure 11.2. The Leveling indicator appears in the Indicators column in resource views that have tables, such as the Resource Usage view shown here. Instead of emphasizing the resource definition fields, the Resource Usage view emphasizes a timescale that has the scheduled activity for each resource broken down into discrete time periodswhat Project calls timephased assignment data. In Figure 11.2, the Work and Peak Units fields are displayed for each day in the timescale. Mel Lloyd is overallocated because his max units value for the period shown is 100% and he is assigned for 200% units on Tuesday. He does not have a Leveling indicator because the leveling sensitivity setting is Week by Week, and Mel has fewer than 40 hours of assigned work for the week. Although Mel is overallocated on Tuesday, his assignment does not need leveling because he can do the weekly work he has been assigned. Howard Thompson, on the other hand, has far more than 40 hours of work assigned during the week; therefore, on a Week by Week basis, his assignments need to be leveled. Viewing Resource OverallocationsTo identify all the overallocated resources by name, you need to use one of the three resource views that display a table: the Resource Sheet view, the Resource Usage view, or the Resource Allocation view. Figure 11.1 shows the Resource Sheet view, and Figure 11.2 shows the Resource Usage view. The Resource Allocation view includes the Resource Usage view and is discussed more in later sections of this chapter. If a resource is overallocated during any period in the life of the project, the resource name is highlighted in any of these views. Filtering Overallocated ResourcesIf a resource list is extensive , you can filter it, to display only the resources that are overallocated. You can display all overallocated resources, not just those with the Leveling indicator. In Figure 11.3, the Resource Sheet view is filtered for overallocated resources; in this case, only three resource names appear. Figure 11.3. Applying the Overallocated Resources filter reduces the display to just the resources that are overallocated. NOTE There is no way to filter for just resources that have the Leveling indicator displayed. Project calculates this indicator on the fly, and there is no field that shows the result of the calculation other than the Indicators fieldand you can't apply a filter to the Indicators field.
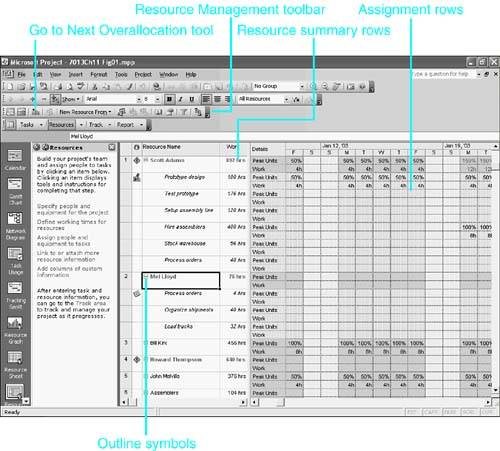
NOTE In a combination view, the bottom pane always displays a subset of the selected tasks or resources that are highlighted in the upper view. TIP If you correct the overallocation problem for a resource that is displayed by a filter, the resource remains in the display until the filter is applied again. This is because the display of filters is not automatically refreshed. You can press Ctrl+F3 to refresh the filtered list. To remove a filter, choose Project, Filtered For, All Resources, or press the F3 function key. Working with the Resource Usage ViewYou must use a resource view with a timescale if you want to see assignment data for each time period or to see exactly when a resource overallocation occurs. The Resource Usage view is a standard view that can display a wealth of assignment information, including timephased details for each time period displayed in the timescale. In addition to listing all the resources and highlighting those that are overallocated, you can display rows indented under each resource for all the resource's assignments (see Figure 11.4). Furthermore, you can display multiple timephased assignment field values for each of the assignments, and you can edit some of the fields directly in the cells of the timescale grid. In Figure 11.4, both the Peak Units and the Work values are displayed for each assignment and summarized for each resource. The cells in the timescale grid break down the assignment values into discrete time periods. Because you can choose the time unit displayed in the timescale, you can zoom in to view the assignment details minute by minute or zoom out to see summaries for months, quarters , or years . Figure 11.4. The Resource Usage view allows you to view all the assignments under each resource.
The Resource Usage view in Figure 11.4 shows the individual assignments for Mel Lloyd and Scott Adams. You can click the outline symbol that appears to the left of a resource name to hide or display the assignments for that resource. If some assignments are not displayed, the outline symbol is a plus sign (for example, Howard Thompson and Bill Kirk in Figure 11.4). If the assignments are displayed, the outline symbol is a minus sign (for example, Mel Lloyd and Scott Adams in Figure 11.4). If a resource has no assignments, an outline symbol does not appear next to the resource's name.
TIP If you apply a filter (for example, the Overallocated Resources filter) in the Resource Usage view, you can see the assignments for other resources by clicking on the plus symbol that appears to the left of the resource name, in the Resource Name column. If the symbol is a minus symbol, try clicking on it anyway. If it changes to a plus symbol with the first click, you need to click the symbol again to display the assignments for that resource. For each assignment row in the Resource Usage view, the default display in the cells in the timescale grid is the timephased work for the time period spanned by that cell . You can add additional rows to display other timephased values, such as overtime work, cost, available units, peak units, baseline work, and actual work. In Figure 11.4, for example, there are six assignments listed under Scott Adams on the left side of the table. Each assignment has two timephased rows in the timescaleone for peak units and one for work. Timephased Peak Units and Work rows for Scott Adams also serve to display the totals of the Peak Units and Work cells for his assignments. If any assignment value in a cell in the grid is itself greater than the resource availability for the time period, the assignment value is highlighted (typically in red). For example, if you assigned 200% units of a resource with only 100% max units for that time period, the values in the assignment timephased cells for that assignment would all appear highlighted. The cells in the rows for the resource name contain the sums of the values in the assignment rows beneath them. If a resource is overallocated during any time period, the resource name is highlighted, as are the summary values in the timephased cells for the periods in which the overallocations occur. This allows you to locate the exact time periods when overallocations occur. TIP
Using the Go to Next Overallocation Tool
If you use the Go to Next Overallocation tool in a view that has a task list, such as the Gantt Chart view or the Task Sheet view, the task list scrolls to the first task associated with an overallocation and selects that task. Successive use of the Go to Next Overallocation tool selects other tasks assigned to overallocated resources during the same time period. When all tasks associated with overallocations for that time period have been identified, the Go to Next Overallocation tool identifies the next time period that has an overallocated resource and selects the first associated task for that time period. If you want to be able to view the overload graphically, you can split the screen and display a combination view with the Resource Graph view in the bottom pane. You do this by going to the Window menu and selecting Split. By default, this displays the Resource Form view in the lower view. To change this, select the lower view to make it the active view and then go to the View menu and select Resource Graph (or select it from the View bar). This allows you to see (by default) peak units for the selected resource highlighted in the upper view (see Figure 11.5). To view other values such as work, right-click over the Resource Graph view and choose an option from the pop-up menu that appears. Figure 11.5. The Resource Usage view with the Resource Graph view in the bottom pane allows a quick view of overallocations. Note that the upper and lower views are exactly synchronized to the same timescale. Changing the Timephased DetailsThe Resource Usage view displays rows for all resources, with their assignments indented beneath them. You can choose different timephased field values to display in the timescale grid. Each timephased field you choose to display has its own rows in the displayone for each resource and one for each resource assignment. For example, if you choose to display four timephased field values, each resource has four summary rows and each assignment has four detail rows. The default timephased value displayed is the Work field, which shows the total hours of assigned work per unit of time. The display of the timephased details is governed by the Detail Styles and the Details commands on the Format menu. The Details command is a short selection menu of timephased fields to display or remove from the display. All fields that are currently displayed are listed on the Details menu, with a check mark next to each field name. You can click the field to remove it from the display. The Details menu also contains a standard list of fields that you can add to the display by clicking. The list of fields to be included in this standard list is governed by the Detail Styles dialog box. To remove a timephased field from the display, or to display one of the fields on the standard selection menu, choose Format, Details and click the field you want to add to or remove from the display. Or, you can just right-click over the timescale grid to display the Details shortcut menu, which includes the selection list as well as the command to open the Detail Styles dialog box (see Figure 11.6). Figure 11.6. The Details shortcut menu displays a check mark for each field that is currently displayed and lets you change the display by clicking a field name. Microsoft Project 2003 includes SmartTags to explain project scheduling engine calculations and advise you of alternative actions that might provide more effective or efficient schedules. This feature is similar to the scheduling messages included in previous versions of Microsoft Project; the difference is that SmartTags are less intrusive to the workspace than the old messages. A red or green triangle in the edited cell indicates that the edit just performed has made a change to the task or assignment that has some scheduling implications. The indicator appears only in the Gantt Chart view, Sheet view, and Usage type views. Hovering over the indicator displays a SmartTag that notifies you of a scheduling change (see Figure 11.7). Clicking on the indicator displays an alternative choice. The indicator in most cases displays as long as the edit is undoable; then, after another edit is made, the indicator disappears. SmartTags display for the following edits:
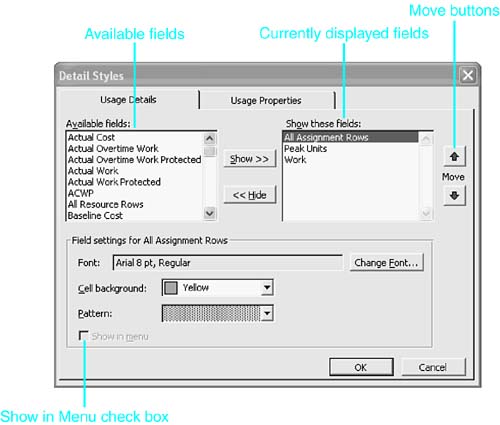
Figure 11.7. This SmartTag shows the possible implications of editing a task or an assignment on the schedule and prompts the user to make an appropriate selection. You can turn off SmartTags by selecting Tools, Options and then selecting the Edit tab from the Options dialog box. When you are editing fields in the Resource Usage grid, the scheduling behavior is largely dictated by whether the task type is Fixed Units, Fixed Work, or Fixed Duration and also whether the task is effort-driven and whether there are multiple resources or a single resource assigned to a task. To display the Detail Styles dialog box, you choose Format, Detail Styles (see Figure 11.8). You can also right-click over the timephased grid and choose Detail Styles from the shortcut menu. Figure 11.8. The Usage Details tab of the Detail Styles dialog box governs which timephased details are displayed in the Resource Usage view and how they are formatted, as well as which ones appear on the Details menu. The Usage Details tab of the Detail Styles dialog box contains a full list of all the timephased assignment fields that can be displayed in the view. If the fields are already displayed in the view, they are listed in the Show These Fields list on the right; otherwise, they appear in the Available Fields list on the left. You can select a field from either list to define its formatting or to assign it a place on the Details menu. The list of timephased fields includes a wide range of actual, baseline, and scheduled values for work and for cost, as well as availability and assigned values for units and work. Here is a list of the different fields:
The list of fields also includes the entries All Resource Rows and All Assignment Rows. These are not fields, but they are included so that you can define separate formatting for the resource rows and assignment rows in the grid. To add a timephased field to the standard selection list displayed by the Format Details command, select the field (whether it's in the Available Fields list or in the Show These Fields list) and click the Show in Menu check box. Note that this does not display the field; it just adds the field to the standard list in the Details menu. To display a field that is not currently in the Show These Fields list, select the field in the Available Fields list and click the Show button. The field is added to the Details selection menu until you choose not to display it in the timescale grid (unless its Show in Menu check box has been filled, in which case it remains on the Details menu). To move a field that is currently in the Show These Fields list back to the Available Fields list, select the field and click the Hide button. The order of the fields listed in the Show These Fields list is the order in which their rows appear in the grid. You can change the order by using the Move arrows: You select a field name and move it up or down in the list with the arrows. You can define distinguishing formats for individual timephased fields in the resource summary rows, but the format you choose is not applied to a field's rows for assignments. To change the display characteristics of a resource field row, click the field (in whichever list it appears) and click the Change Font button to select a different font. Select the Cell Background drop-down list to change the color of the row of cells or the Pattern drop-down box to change the fill pattern for the cells in that row. The selected format remains defined for the field, no matter which list it appears in. TIP If you design special formats for the Resource Usage view and want to use those format settings for all projects, you can use the Organizer to copy the view into other projects and into the Global template for all new projects. You can assign distinct formats to all resource rows or to all assignment rows. Assignment rows can have a different background to distinguish them from the resource rows in the grid. To define a general font or background for the assignment rows or for the resource rows, select the All Assignment Rows entry or the All Resource Rows entry (in whichever list it appears) and use the Change Font button, the Cell Background drop-down list, or the Pattern drop-down list to define the format. To apply the format, you move the All Assignment Rows or the All Resource Rows entry to the Show These Fields list. If you apply a special format to All Resource Rows, it overrides any special formats you may have defined for individual timephased fields. If you want individual fields to retain their own formatting, you need to remove the All Assignment Rows entry from the right-hand list in the dialog box. Using the same mechanism, you can have all resource rows adopt the same formatting by adding the All Resource Rows option to the list on the right-hand side of the dialog box. The Usage Properties tab of the Detail Styles dialog box controls the display of row titles in the grid and the alignment of data within the cells (see Figure 11.9). In this tab you can do the following:
Figure 11.9. The Usage Properties tab of the Detail Styles dialog box governs how the details are displayed. |
 If you need to manage the timescale units,
| < Day Day Up > |
EAN: 2147483647
Pages: 283
- Integration Strategies and Tactics for Information Technology Governance
- Assessing Business-IT Alignment Maturity
- A View on Knowledge Management: Utilizing a Balanced Scorecard Methodology for Analyzing Knowledge Metrics
- Technical Issues Related to IT Governance Tactics: Product Metrics, Measurements and Process Control
- Governance Structures for IT in the Health Care Industry