Using Capacity-Analysis Tools
| A growing number of tools originating and evolving from the Windows NT4, Windows 2000, and Unix operating system platforms can be used in data collection and analysis on Windows Server 2003. Some of these tools are even capable of forecasting system capacity, depending on the amount of information they are given. In the past year Microsoft has released several sizing tools. Probably the most well known is the Microsoft Operations Manager (MOM) sizing tool; however, similar tools are available for any number of Microsoft applications. They are presented in the form of an interactive Microsoft Excel spreadsheet. The user inputs data relative to their environment, and the tool returns the recommended hardware configuration to support the request. They are based on Microsoft best practices and have been fairly accurate in practical use. Microsoft also offers some handy utilities that are either inherent to Windows Server 2003 or are sold as separate products. Some of these utilities are included with the operating system, such as Task Manager, Network Monitor, and Performance Console (also known as Performance or System Monitor). Data that is collected from these applications can be exported to other applications, such as Microsoft Excel or Access, for inventory and analysis. Other Microsoft utilities that are sold separately are Systems Management Server (SMS) and MOM. Built-in ToolsetWindows Server 2003's arsenal of utilities for capacity-analysis purposes includes command-line and GUI-based tools. This section discusses the Task Manager, Network Monitor, and Performance Console, which are bundled with the Windows Server 2003 operating system. Task ManagerThe Windows Server 2003 Task Manager is similar to its Windows 2000 predecessor in that it offers multifaceted functionality. You can view and monitor processor-, memory-, application-, network-, and process-related information in real-time for a given system. This utility is great for getting a quick view of key system health indicators with the lowest performance overhead. To begin using Task Manager, use any of the following methods:
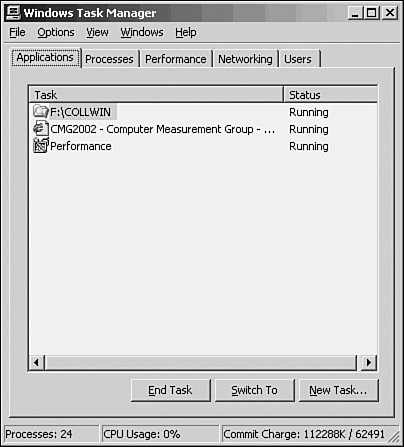
When you start the Task Manager, you'll see a screen similar to that in Figure 35.1. Figure 35.1. The Task Manager window after initialization. The Task Manager window contains the following five tabs:
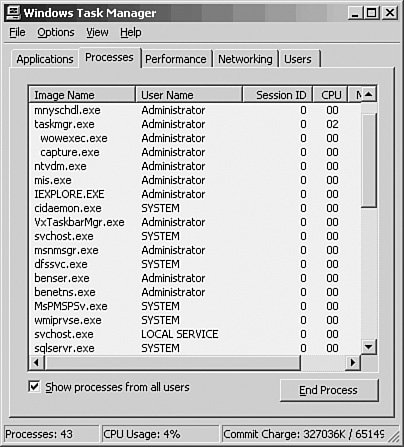
In addition to the Task Manager tabs, the Task Manager is, by default, configured with a status bar at the bottom of the window. This status bar, shown in Figure 35.2, displays the number of running processes, CPU utilization percentage, and the amount of memory currently being used. Figure 35.2. All processes currently running on the system. As you can see, the Task Manager presents a variety of valuable real-time performance information. This tool is particularly useful for determining what processes or applications are problematic and gives you an overall picture of system health. There are limitations, however, which prevent it from becoming a useful tool for long-term or historical analysis. For example, the Task Manager can't store collected performance information; it is capable of monitoring only certain aspects of the system's health, and the information that is displayed pertains only to the local machine. For these reasons alone, the Task Manager doesn't make a prime candidate for capacity-planning purposes (you must be logged on locally or connected via Terminal Services to gauge performance with the Task Manager). Network MonitorThere are two versions of Network Monitor that you can use to check network performance. The first is bundled within Windows Server 2003, and the other is a part of Systems Management Server. Although both have the same interface, like the one shown in Figure 35.3, the one bundled with the operating system is slightly scaled down in terms of functionality when compared to the SMS version. Figure 35.3. The unified interface of the Network Monitor.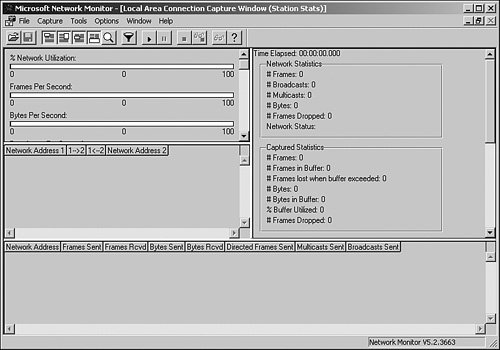 The Network Monitor that is built into Windows Server 2003 is designed to monitor only the local machine's network activity. This utility design stems from security concerns regarding the ability to capture and monitor traffic on remote machines. If the operating system version had this capability, anyone who installed the Network Monitor would possibly be able to use it to gain unauthorized access to the system. Therefore, this version captures only frame types traveling into or away from the local machine. To install the Network Monitor, perform the following steps:
As mentioned earlier, the SMS version of the Network Monitor is a full version of the one integrated into Windows Server 2003. The most significant difference between the two versions is that the SMS version can run indiscriminately throughout the network (that is, it can monitor and capture network traffic to and from remote machines). It is also equipped to locate routers on the network, provide name-to-IP address resolution, and generally monitor all the traffic traveling throughout the network. Because the SMS version of Network Monitor is capable of capturing and monitoring all network traffic, it poses possible security risks. Any unencrypted network traffic can be compromised; therefore, it's imperative that you limit the number of IT personnel who have the necessary access to use this utility. On the other hand, the SMS version of Network Monitor is more suitable for capacity-analysis purposes because it is flexible enough to monitor network traffic from a centralized location. It also allows you to monitor in real-time and capture for historical analysis. For all practical purposes, however, it wouldn't make much sense to install SMS just for the Network Monitor capabilities, especially considering that you can purchase more robust third-party utilities. The Performance ConsoleMany IT professionals rely on the Performance Console because it is bundled with the operating system, and it allows you to capture and monitor every measurable system object within Windows Server 2003. This tool is a Microsoft Management Console (MMC) snap-in, so using the tool involves little effort to become familiar with it. You can find and start the Performance Console from within the Administrative Tools group on the Start menu. The Performance Console, shown in Figure 35.4, is by far the best utility provided in the operating system for capacity-analysis purposes. With this utility, you can analyze data from virtually all aspects of the system both in real-time and historically. This data analysis can be viewed through charts, reports, and logs. The log format can be stored for use later so that you can scrutinize data from succinct periods of time. Figure 35.4. The Performance Console startup screen.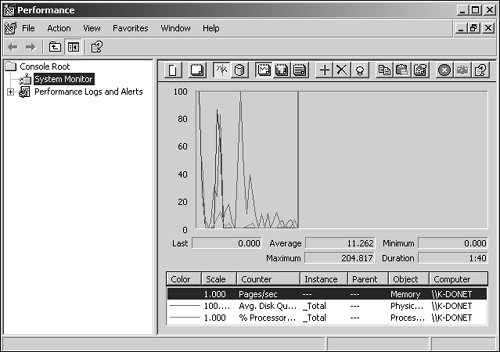 Because the Performance Console is available to everyone running the operating system and it has a lot of built-in functionality, we'll assume that you'll be using this utility. Third-Party ToolsetWithout a doubt, many third-party utilities are excellent for capacity-analysis purposes. Most of them provide additional functionality not found in Windows Server 2003's Performance Console, but they cost more, too. You may want to evaluate some third-party utilities to get a more thorough understanding of how they may offer more features than the Performance Console. Generally speaking, these utilities enhance the functionality that's inherent to Performance Console, such as scheduling, an enhanced level of reporting functionality, superior storage capabilities, the ability to monitor non-Windows systems, or algorithms for future trend analysis. Some of these third-party tools are listed in Table 35.2.
Although it may be true that most third-party products do add more functionality to your capacity-analysis procedures, there are still pros and cons to using them over the free Performance Console. The most obvious is the expense of purchasing the software licenses for monitoring the enterprise, but some less obvious factors include the following:
The key is to decide what you need to adequately and efficiently perform capacity-analysis procedures in your environment. You may find that the Performance Console is more than adequate, or you may find that your network environment, because of complexities, requires a third-party product that can encompass all the intricacies. |
EAN: 2147483647
Pages: 499