System Monitoring
| System monitoring is a crucial aspect of the overall availability and health of the network. For maximum uptime, a process needs to be put in place to monitor and analyze system performance. This invariably provides a means of quickly comparing system performances at varying instances in time, and detecting and potentially preventing a catastrophic incident before it causes system downtime. The System Monitor takes a snapshot of system performance characteristics at periodic intervals and displays the information in graphical format similar to that shown in Figure 34.7. The information can then be used to monitor the behavior of the system, predict future resource requirements, measure the load on system components, and also trigger an alert to inform you of potential failures of system components. Figure 34.7. System monitoring with the Performance console.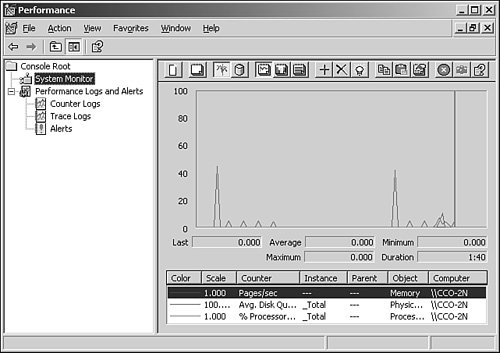 Windows Server 2003 monitors or analyzes memory, storage, networks, and other system resources and operations. It is not good enough to just monitor memory usage itself without knowing the components or functionality of software that is using the memory. For example, if 128MB of memory is used over a specified period of time, rather than knowing that 128MB of memory was used, it is more valuable knowing what used the memory and why that much was used. Performance Monitoring ToolsWindows Server 2003 comes with two tools for performance monitoring: System Monitor and Performance Logs and Alerts. These two tools together provide performance analysis and information that can be used for bottleneck and troubleshooting analysis. Terms Used in the Performance Monitoring ToolsDefining some terms used in performance monitoring will help clarify the function of the System Monitor and how it ties in to software and system functionality. The three components noted in the System Monitor are as follows:
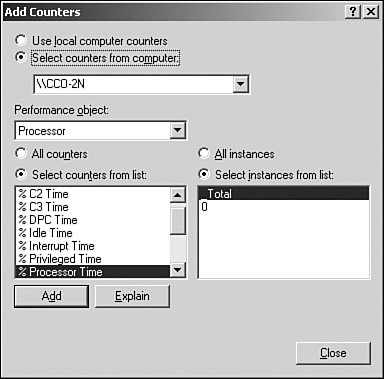
The Performance ConsoleYou can open the Performance console from the Administrative Tools by selecting Start, Programs, Administrative Tools, Performance. You can also open it from a command line by typing Perfmon.msc. When a new Performance console is started, it loads a blank system monitor graph into the console. The Performance console contains two utilities: System Monitor and Performance Logs and Alerts. The System MonitorThe System Monitor provides an interface to allow the analysis of system data, research performance, and bottlenecks. The System Monitor displays performance counter output in graph, histogram (bar chart), and report format. The histogram and graph view can be used to view multiple counters at the same time, as shown in Figure 34.8. However, each data point displays only a single value that is independent of its object. The report view is better for displaying multiple values. Data sources can be obtained by clicking the View Current Activity button on the button bar. On the other hand, clicking View Log Data displays data from completed or running logs. Figure 34.8. The graph view of the Performance console.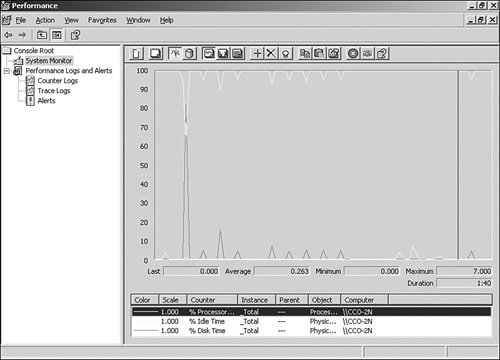 The System Monitor is ideal for diagnostics and short-term views of performance output. Before counters can be displayed, they have to be added. The counters can be added simply by using the button bar. The Counter button on the button bar includes Add, Delete, and Highlight. You can use the Add Counter button to add new counters to be displayed. The Delete Counter button removes unwanted counters from the display. The Highlight button is helpful for highlighting a particular counter of interest; a counter is highlighted with a white or black color around the counter. The Highlight button cannot be used with Report view. Tip You can display the function of a button in the button bar by placing the mouse cursor on the button. When the Add Counter button is selected, a dialog box similar to the one shown in Figure 34.9 appears. The top section of this property page allows you to either choose the server being worked on or connect to a different server on the network. The System Monitor allows you to connect to a remote computer and be able to monitor system performance of the server. This process is referred to as remote monitoring. Figure 34.9. Adding a counter to the Performance console. Tip If a server stops responding, run the System Monitor from another computer to monitor the troubled server. Performance objects and their associated counters can be added to the system monitoring tool to expand the level of detail being collected for the performance of a system. Select a counter and click the Add button to add it to the display. In the instance list box, the first value, Total, allows you to add all the instance values and report them in the display. When you need to understand what a counter does or learn more about it, select the counter and click the Explain button. You can have more than one monitoring setup in more than one Performance console. The more counters and monitors you set up, the more your system's resources are used to support the system monitoring tool operations. If you need to monitor a large number of system monitors and counters, it is better to redirect the output data to a log file and then read that log file in the display. Back on the System Monitor display, you can update displays by clicking the Clear Display button. Clicking the Freeze Display button or pressing Ctrl+F freezes displays, which suspends data collection. Data collection can be resumed by pressing Ctrl+F or clicking the Freeze Display button again. Click the Update Data button to display an updated data analysis. It is also possible to export and import a display by using the Cut and Paste buttons. For example, a display can be saved to the Clipboard and then imported into another instance of the System Monitor. This is commonly done to take system information and view or analyze that information on a different system rather than performing analysis on a production server. The Properties page has five tabs: General, Source, Data, Graph, and Appearance. Generally, the Properties page gives access to settings that control the graph grid, color, style of display data, and so on. Data can be saved from the monitor in different ways. The easiest way to retain the display features when saved is to save the control as an HTML file. You can match lines in the display with their respective counters by selecting the color that matches the line in the display. The System Monitor enables you to save log files in comma-separated (csv) or tab-separated (tsv) format, which you can then analyze by using third-party tools such as Seagate Crystal Reports. Alternatively, a comma-separated or tab-separated file can be imported into a spreadsheet or database application such as Microsoft Excel or Access. Windows Server 2003 also allows you to collect data in SQL database format, which is useful for performance analysis at an enterprise level rather than a per-server basis. Reports displayed in Excel can help you better understand the data as well as provide reports to management. After the log file is saved in .csv format, the file can be opened using Microsoft Excel. Performance Logs and AlertsThe Performance Logs and Alerts utility has two types of performance-related logs: Counter logs and Trace logs. These logs are useful for advanced performance analysis and data logging over a period of time. The utility also comes with an alerting mechanism used to trigger alerts. Some improvements have been added in Windows Server 2003 performance analyses that were not available in previous versions of Windows. One is the ability to run log collections under different accounts. For example, if you need to log data from a remote server that requires administrator privileges, the system will allow you to specify an account with the necessary permissions using the Run As feature. Another improvement to Windows Server 2003 is the ability to support log files greater than 1GB in size. Performance data can also be appended to an existing log file because of the new log file format. Note Data collection occurs regardless of whether a user is logged on to the server being monitored because logging runs as a service. The three components to Performance Logs and Alerts are as follows:
Configuring Trace LogsConfiguring and enabling Trace logs to monitor the activities of an application or environment variable is simply a matter of creating a Trace log filename and enabling logging. To create a trace log, do the following:
For a list of installed providers and their status (enabled or not), click Provider Status in the General tab. By default, the Nonsystem Providers option is selected to keep trace logging overhead to a minimum. Click Events Logged by System Provider and check the boxes as appropriate to define events for logging. On the Log File tab, you can configure the log to be circular, so that when the log file reaches a predetermined size, it will be overwritten. Common Log File SystemNew to Windows 2003 R2 is Common Log File System (CLFS). This architecture allows both OEM and custom applications to use common logging structures. A first for Windows, CLFS can create log files with multiple streams of data from multiple sources. It is the first native multiplexing log system. This brings native root cause analysis closer to the operating system instead of relying on expensive third-party tools. CLFS also allows generic policy-based management for uniformity across the enterprise. CLFS will be integrated with emerging products, including Microsoft Exchange 12 and Windows Clustering. In a clustered environment it allows all member servers to maintain a single, shared log. Possibly its most important feature, CLFS is designed for high performance and will allow for MOM 2005 to manage servers "agentless" without the performance overhead penalty currently incurred. |
EAN: 2147483647
Pages: 499