Developing Statechart Diagrams (Design)
| The Statechart diagram shows the sequence of object states a single class can exhibit during its lifetime, together with the events that cause the changes of state. This is in contrast to the Interaction diagrams, which show the interaction between multiple classes. The classes of objects that a Statechart examines can be derived from UML diagrams, such as Use Case, Class, or Interaction diagrams. The intent is not to develop Statechart diagrams for every class in a system ”only those that show variable or complex behavior ( reactions ) to events dispatched from outside their context should be considered . For example, in the Model, View, Control (MVC) design pattern, it is the responsibility of the Control to react to events. For this reason, the behavior of the Control is a good candidate for a Statechart diagram. Note Statechart models are ideal for describing the behavior of a single class. Their biggest limitation is that they are not good at describing behavior that involves several classes. For such cases you can use an Interaction or an Activity diagram. The Features of a Statechart diagramA Statechart is typically comprised of the following elements:
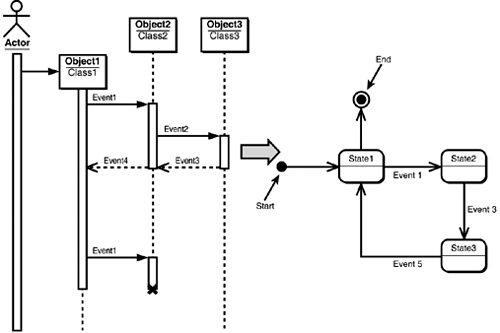
Figure 3.31 illustrates an example Statechart diagram that has been derived from a Sequence diagram. Figure 3.31. A Statechart diagram that has been derived from a Sequence diagram. |
EAN: 2147483647
Pages: 360
