Identifying and Analyzing Core Analysis and Monitoring Elements
| The capacity analysis and performance optimization process can be intimidating because there can be an enormous amount of data to work with. In fact it can easily become unwieldy if not done properly. The process is not just about monitoring and reading counters; it is also an art. As you monitor and catalog performance information, keep in mind that more information does not necessarily yield better optimizations. Tailor the number and types of counters that are being monitored based on the server's role and functionality within the network environment. It's also important to monitor the four common contributors to bottlenecks: memory, processor, disk, and network subsystems. When monitoring application servers like Microsoft Exchange systems, it is equally important to understand the various roles each server plays (front-end server, back-end server, bridgehead gateway server, and so on) to keep the number of counters being monitored to a minimum. Memory Subsystem OptimizationsAs with earlier versions of Windows, Windows Server 2003 tends to use the amount of memory that you throw at it. However, its efficient memory management outperforms its predecessors. Nevertheless, fine-tuning system memory can go a long way toward making sure that each Windows 2003 server has adequate amounts of memory. Memory management is performed by Windows Server 2003 and is directly related to how well applications on the server perform. Windows Server 2003 also has greatly enhanced memory management and the way it uses virtual memory. This reduces memory fragmentation and enables more users to be supported on a single server or cluster of servers.
Using the Performance Monitor Console, there are a number of important memory-related counters that can help you establish an accurate representation of the system's memory requirements. The primary memory counters that provide information about hard pages (pages that are causing the information to be swapped between the memory and the hard disk) are
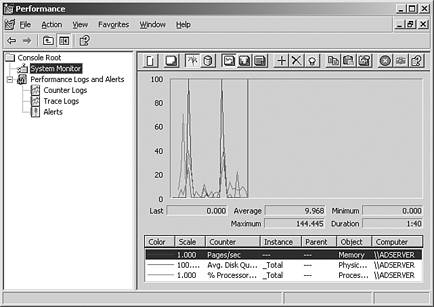
Figure 23.5 shows some of the various memory and process counters. Figure 23.5. Memory-related counters in Windows Server 2003. Improving Virtual Memory UsageCalculating the correct amount of virtual memory is one of the more challenging aspects of planning a server's memory requirements. While trying to anticipate growing usage demands, it is critical that the server has an adequate amount of virtual memory for all applications and the operating system. Virtual memory refers to the amount of disk space that is used by Windows Server 2003 and applications as physical memory gets low or when applications need to swap data out of physical memory. Windows Server 2003 uses 1.5 times the amount of RAM as the default minimum paging file size, which is adequate for many systems. However, it is important to monitor memory counters to determine if this amount is truly sufficient for that particular server's resource requirements. Another important consideration is the maximum size setting for the paging file. As a best practice, this setting should be at least 50 percent more than the minimum value to allow for paging file growth should the system require it. If the minimum and maximum settings are configured with the same value, there is a greater risk that the system could experience severe performance problems or even crash. The most indicative sign of low virtual memory is the presence of warning events, such as the Event 9582 logged by the Microsoft Exchange Information Store service, that can severely impact and degrade the Exchange Server's message-processing abilities . These warning events are indicative of virtual memory going below 32MB. If unnoticed or left unattended, these warning messages might cause services to stop or the entire system to fail.
To get an accurate portrayal of how a server is using virtual memory, monitor the following counters in the Performance MMC tool:
Other important counters to watch closely are as follows :
Monitoring Processor UsageAnalyzing the processor usage can reveal invaluable information about system performance and provide reliable results that can be used for baselining purposes. There are two major processor counters that are used for capacity analysis of a Windows Server 2003 system.
Optimizing the Disk Subsystem ConfigurationThere are many factors such as the type of file system to use, physical disk configuration, database size, and log file placement that need to be considered when you are trying to optimize the disk subsystem configuration. When optimizing the disk subsystem, there are many choices that need to be made that are specific to the configuration of the existing network environment. Choosing the File SystemAmong the file systems supported by Windows Server 2003 (FAT and NTFS), it is recommended you use only NTFS on all servers, especially those in production environments. Simply put, NTFS provides the best security, scalability, and performance features. For instance, NTFS supports file and directory-level security, large file sizes (files of up to 16TB), large disk sizes (disk volumes of up to 16TB), fault tolerance, disk compression, error detection, and encryption. Choosing the Physical Disk ConfigurationWindows Server 2003, like its predecessors, supports RAID (Redundant Array of Inexpensive Disks). The levels of RAID supported by the operating system are
Two Recommended Basic RAID Levels to Use There are various levels of RAID but for the context of enterprise servers, there are two recommended basic levels to use: RAID 1 and RAID 5. Other forms of RAID, such as RAID 0+1 or 1+0 are also optimal solutions for enterprise servers. These more advanced levels of RAID are only supported when using a hardware RAID controller. Therefore, only RAID 1 and 5 will be discussed in this chapter. There are various other levels of RAID that can be supported through the use of hardware-based RAID controllers. The deployment of the correct RAID level is of utmost importance because each RAID level has a direct effect on the performance of the server. From the viewpoint of pure performance, RAID level 0 by far gives the best performance. However, fault tolerance and the reliability of system access are other factors that contribute to overall performance. The skillful administrator is one who strikes a balance between performance and fault tolerance without sacrificing one for the other. Disk Mirroring (RAID 1)In this type of configuration, data is mirrored from one disk to the other participating disk in the mirror set. Data is simultaneously written to the two required disks, which means read operations are significantly faster than systems with no RAID configuration or with a greater degree of fault tolerance. Because a RAID 1 configuration only has one hard drive controller to handle the writing of information to two or more disks, write performance is slower because data is being written to multiple drives from a single drive controller source. Besides adequate performance it also provides a good degree of fault tolerance. If one drive fails the RAID controller can automatically detect the failure and run solely on the remaining disk with minimal interruption. The biggest drawback to RAID 1 is the amount of storage capacity that is lost. RAID 1 uses 50% of the total drive capacity for the two drives. Well Suited RAID 1 is particularly well suited for the boot drive as well as for volumes containing log files for application and database servers. Disk Striping with Parity (RAID 5)In a RAID 5 configuration, data and parity information are striped across all participating disks in the array. RAID 5 requires a minimum of three disks. Even if one of the drives fails within the array, the server can still remain operational. After the drive fails, Windows Server 2003 continues to operate because of the data contained on the other drives. The parity information gives details of the data that is missing due to the failure. Either Windows Server 2003 or the hardware RAID controller also begins the rebuilding process from the parity information to a spare or new drive. RAID 5 is most commonly used for the data drive because it is a great compromise among performance, storage capacity, and redundancy. The overall space used to store the striped parity information is equal to the capacity of one drive. For example, a RAID 5 volume with three 200GB disks can store up to 400GB of data. Hardware Versus Software RAIDHardware RAID (configured at the disk controller level) is recommended over software RAID (configurable from within the Windows Server 2003) because of its faster performance, greater support of different RAID levels, and capabilities to more easily recover from hardware failures. Monitoring the Disk SubsystemWindows Server 2003 application servers typically rely heavily on the disk subsystem and it is therefore a critical component to properly design and monitor. Although the disk object monitoring counters are by default enabled in Windows Server 2003, it is recommended that you disable these counters until such time that you are ready to monitor them. This is because the resource requirements can influence overall system performance. The syntax to disable and re-enable these counters is as follows:
Nevertheless, it is important to gather disk subsystem performance statistics over time. The primary performance-related counters for the disk subsystem are located within the Physical and Logical Disk objects. Critical counters to monitor include, but are not limited to, the following:
Monitoring the Network SubsystemThe network subsystem is by far one of the most difficult subsystems to monitor because of the many different variables . The number of protocols used in the network, the network interface cards (NICs), network-based applications, topologies, subnetting, and more, play vital roles in the network, but they also add to its complexity when you're trying to determine bottlenecks. Each network environment has different variables; therefore, the counters that you'll want to monitor will vary. The information that you'll want to gain from monitoring the network pertains to network activity and throughput. You can find this information with the Performance Console alone, but it will be difficult at best. Instead, it's important to use other tools, such as the Network Monitor, in conjunction with Performance Console to get the best representation of network performance possible. You might also consider using third-party network analysis tools such as sniffers to ease monitoring and analysis efforts. Using these tools simultaneously can broaden the scope of monitoring and more accurately depict what is happening on the wire. Because the TCP/IP suite is the underlying set of protocols for a Windows Server 2003 network subsystem, this discussion of capacity analysis focuses on this protocol. The TCP/IP counters are added after the protocol is installed (by default). There are several different network performance objects relating to the TCP/IP protocol, including ICMP, IP, Network Interface, NetBT, TCP, UDP, and more. Other counters such as FTP Server and WINS Server are added after these services are installed. Because entire books are dedicated to optimizing TCP/IP, this section focuses on a few important counters that you should monitor for capacity-analysis purposes. First, examining error counters, such as Network Interface: Packets Received Errors or Packets Outbound Errors, is extremely useful in determining whether traffic is easily traversing the network. A greater number of errors indicates that packets must be present, causing more network traffic. If a high number of errors is persistent on the network, throughput will suffer. This might be caused by a bad NIC or unreliable links. If network throughput appears to be slowing because of excessive traffic, you should keep a close watch on the traffic being generated from network-based services such as the ones described in Table 23.2. Table 23.2. Network-based Service Counters to Monitor Network Traffic
|
EAN: 2147483647
Pages: 325