Coding with the Code Editor
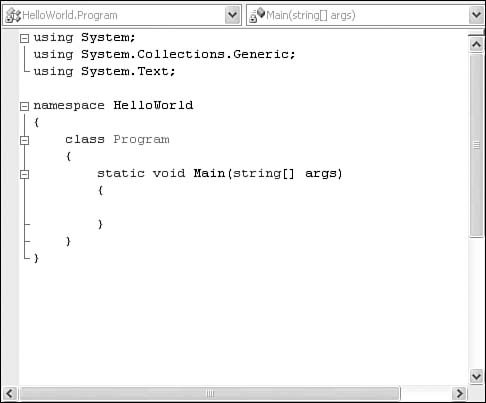
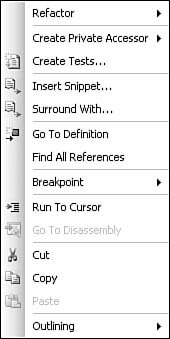
| Writing code and creating other syntax-based files are really all about typing text. The text editor window is the Visual Studio tool directly mapped to the task of creating source code text files. It is the keystone of development inside the IDE. It supports text entry and basic text operations such as selecting text regions, dragging and dropping text fragments, and setting tab stops. With basic text features alone, the editor would be sufficient to code with. However, the features layered on top for debugging, code formatting, code guidance, and customization really make this tool shine. As we mentioned previously, the text editor actually has a few different personalities within the IDE. The code editor is designed to support creating and editing source code files, the XML editor is targeted at XML files, and the CSS editor is targeted at CSS files. Although there may be subtle differences with the way that code or markup is displayed in these windows, they all share the user interface and the same set of editing functionality. Tip Each editor type is fully customizable. Just fire up the Options dialog box (by choosing Tools, Options) and locate the Text Editor node. Under this node are separate pages that allow customization of each editor type. Opening an EditorThere are two ways to launch a text editor (or any other editor in the IDE for that matter). The first way involves using the Solution Explorer: Select an existing code file, text file, or other type file and double-click on the file. If it is a code file, you can also right-click on it and select View Code. The file content will be loaded into a new editor window. The second way to launch an editor window is to choose File, New, File. This will launch the New File dialog box. Selecting a code template from this dialog box will launch a code editor prefilled with the initial code stubs relevant to the template selected. Tip The text editor windows live as tabbed windows front-and-center within the IDE. If multiple code editors are open, they will each be accessible by their tab. If a lot of editors are open at one time, finding the exact window you are looking for by cycling through the tabs may be cumbersome. There are two fast ways for quickly locating and selecting a code editor window. First, you can use Solution Explorer. Double-clicking on the code file again within the Solution Explorer will select and display the associated code editor window. Second, you can use the Window menu. Each open code editor window will be shown by name in the windows list under the Window menu. Writing Code in the Code EditorBecause the code editor's primary purpose is "word processing" for source code, let's first look at writing the simplest of routinesa "Hello, World" functionfrom the ground up using the code editor. Figure 6.4 shows a code editor with an initial stubbed-out console file. This was produced by creating a new Visual C# Console project using the Solution Explorer. Double-clicking on the Program.cs file within that new project displays the source code for this console application. Figure 6.4. Initial template console code. As you can see, Visual Studio, as a result of the template used for creating the project, has already filled in some code: using System; using System.Collections.Generic; using System.Text; namespace HelloWorld { class Program { static void Main(string[] args) { } } }To demonstrate the code editor in action, we'll examine a "Hello, World!" application. In this case, you will create a console application that outputs the "Hello, World!" string to the console window. Within the Main routine, add the following: Console.WriteLine("Hello, World!");To begin writing the code, you simply place your cursor in the window by clicking within the Main routine's braces, press Enter to get some space for the new line of code, and type the Console.WriteLine syntax. These and other productivity enhancers are discussed at great length in the next chapter. Here, we will focus on the basics of editing and writing code in the editor window. Now that you have seen the code editor in action (albeit for a very simple example), you're ready to dig more into the constituent components of the editor window. Anatomy of the Code Editor WindowEditor windows, as you have seen, live as tabbed windows within the IDE and are typically front-and-center visually in terms of windows layout. As you can see with the code editor window in Figure 6.5, each text editor window consists of three primary regions: a code pane, a selection margin, and an indicator margin. There are also both horizontal and vertical scrollbars for navigating around the displayed file. Figure 6.5. The components of the code editor window.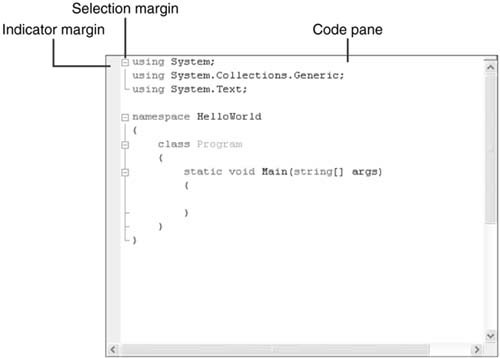 These regions, and their functionality, remain the same for all editor types within the IDE. The code editor adds an additional set of UI elements that are not present with the other editors: Two drop-down boxes at the top of the code editor window enable you to quickly navigate through source code by selecting a type in the left drop-down and then selecting a specific type member (property, field, function, and so on) in the right drop-down (these drop-downs are called class and method name, respectively, in Visual Basic). This will jog the current cursor location directly to the indicated type. Note The type drop-down displays only those types that are declared in the file currently displayed in the editor; it won't display a list that is global to the entire solution, project, or even namespace. Likewise, the type member drop-down displays only members for the selected type. The Code PaneThe code pane is the place where the document (source code, XML, and so on) is displayed and edited. This region provides basic text-editing functionality, in addition to the more advanced productivity features of the editor, such as IntelliSense. Right-clicking within the code pane provides a shortcut menu (see Figure 6.6) that includes standard cut, copy, and paste verbs, along with an assortment of other handy editing actions. Figure 6.6. Code editor shortcut menu. The Indicator MarginThe indicator margin is the slim, gray-colored margin to the far left of the editor. This margin area is used to mark a line of code that contains a breakpoint or bookmark. Figure 6.7 shows the "Hello, World" example with a bookmark placed on the Main routine and a breakpoint placed on the Console.WriteLine command. Figure 6.7. Bookmarks and breakpoints.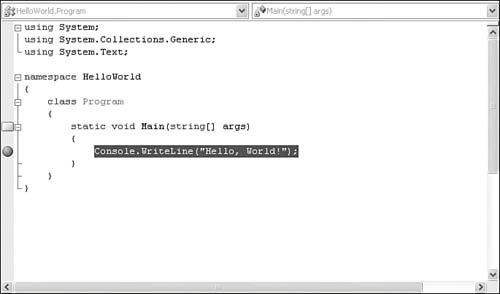 Clicking within the indicator margin will toggle a breakpoint on or off for the line of code you have selected (we cover more on the topic of breakpoints later in this chapter and in Chapter 9, "Debugging with Visual Studio 2005"). The Selection MarginThe selection margin is a narrow region between the indicator margin and the editing area of the code pane. It provides
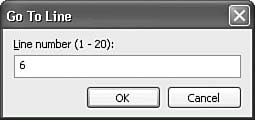
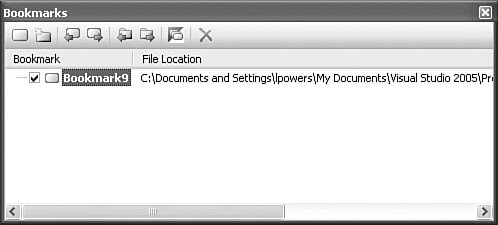
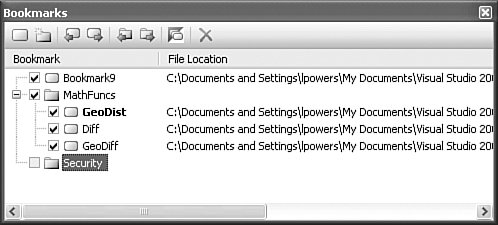
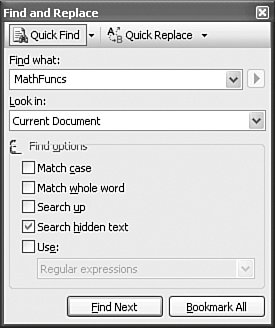
You can clearly see the "changed text" indicator and line numbers in action in Figure 6.8. Figure 6.8. Changed text indicators.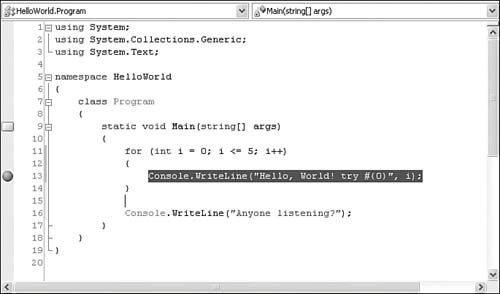 Tip Visual Studio provides a dedicated toolbar for the text editor. You can view this toolbar by selecting View, Toolbars, Text Editor. It exposes buttons for the Member List, Quick Info, Parameter List, and Word Completion IntelliSense features, in addition to indenting, commenting, and bookmark navigation buttons. The navigation buttons are arguably the most useful here because they provide easily accessible forward and back navigation through your code. Code Navigation ToolsAs the lines of code in any given project increase, the concept of effectively navigating through the code basethat is, quickly and easily finding lines of interest among the potentially thousands or even millions of lines of codebecomes an issue. The text editor comes equipped with several tools to help you mark lines of code, search and replace text across source files, and, in general, maintain your situational awareness from within a long code listing. Line NumberingAs we mentioned in the discussion of the text editor's selection margin, line numbering can be enabled for any given document loaded into an editor. This option is controlled in the Options dialog box within the Text Editor, All Languages, General page, or selectively under the individual languages and their General page. By themselves, line numbers would be fairly useless. The capability to immediately jump to a line of code completes the equation and provides some real benefit from a navigation perspective. While within a text editor, press the Ctrl+G key combination to jump to a line of code. This triggers the Go To Line dialog box (see Figure 6.9), which provides a text box for specifying the line number to jump to and even indicates the valid "scope" for the jump by providing a line number range for the current document. Entering a valid line number here will move the current cursor position to the start of that line. Figure 6.9. Jumping to a line. BookmarksBookmarks tackle the problem of navigating through large code files. By placing a bookmark on a line of code, you can instantly navigate back to that line of code at any time. When dealing with a series of bookmarks, you can jump back and forth through the bookmarked lines of code. This turns out to be a surprisingly useful feature. If you are a developer who is dealing with a large base of source code, there will inevitably be points of interest within the source code that you want to view in the editor. Recall that the text editor window does provide a means of navigating via type and member drop-downs; these are not, however, the best tools for the job when your "line of interest" may be an arbitrary statement buried deep within a million lines of code. Bookmarks are visually rendered in the indicator margin of the text editor (refer to Figure 6.8; a bookmark appears on line 9). To add a bookmark or navigate through your bookmarks, you use either the text editor toolbar or the Bookmarks window. You can view the Bookmarks window, shown in Figure 6.10, by choosing View, Other Windows, Bookmarks Window. You will notice that this window provides a toolbar for bookmark actions and provides a list of all available bookmarks, along with their actual physical location (filename and line number within that file). Figure 6.10. The Bookmarks window. To toggle a bookmark for a given line of code, you first place your cursor on the desired line within the text editor and then click on the Toggle bookmark button. The same process is used to toggle the bookmark off. Using the forward and back buttons within the bookmarks window will jump the text editor's cursor location back and forth through all available bookmarks. Tip Use the Bookmarks window to navigate through code across projects. You are not limited to bookmarks placed within a single code file; they can, in fact, be in any loaded code file. The list of bookmarks in this window is also a useful mechanism for quickly toggling a bookmark on or off (via the check box next to the bookmark) and for assigning a meaningful name to a bookmark. Right-clicking on a bookmark will allow you to rename it something more meaningful than "Bookmark7." Bookmark FoldersOne interesting feature with the Bookmarks window is the capability to create a bookmark folder. This is a logical organizational bucket for related bookmarks. For instance, you may want to place bookmarks for a specific math algorithm under a folder called MathFuncs. To do this, you would first create a folder by using the New Folder button the toolbar. You can rename the folder to whatever makes sense for your particular scenario. Then you can create a bookmark and drag and drop it into the folder. See Figure 6.11 for a look at a populated Bookmarks window. Note that two folders are in use, in addition to bookmarks being shown for a variety of different source code files. Figure 6.11. The Bookmarks window with folders. Searching DocumentsThe text editor window provides an extensive search-and-replace capability. Three primary methods of searching are supported: Quick Find (ideal for finding text fragments within the current document or set of open documents), Search In Files (ideal for finding text in a file residing anywhere with a folder structure), and Find Symbol (ideal for searching on objects or members by name). All of these search mechanisms are triggered through the Find and Replace window; a drop-down button on the Find and Replace window will control the mode of the window, which directly maps to the three search methods just itemized. This same window is used to perform text substitution. This Replace functionality has two different modes that equate to the first two search modes. Thus, you have Quick Replace, which functions in a similar fashion to Quick Find, and Replace In Files, which functions in a similar fashion to Search In Files. Let's take a closer look at each of these search-and-replace modes individually. Quick Find/Quick ReplaceFigure 6.12 illustrates the Find and Replace window in Quick Find mode. You have three pieces of information to fill in here: You need to indicate what you are searching for, what you want to search in, and you can also select from different options to fine-tune your search parameters. Figure 6.12. Quick Find mode. The Find What drop-down, obviously, specifies the string to search for. This drop-down will hold the last 20 strings used in a Find operation, making it easy to reuse a previous search: Just select it from the list. The Look In drop-down sets the scope of the search. For Quick Find searches, you have a few different options to choose from:
Fine-Tuning Your SearchBelow the Look In control is a series of check boxes for fine-tuning the search. The effects these options have on your search are self-explanatory:
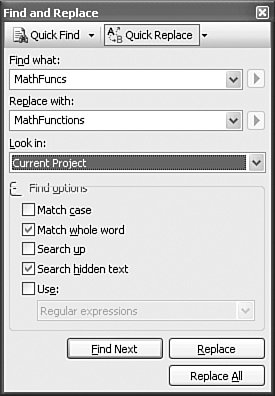
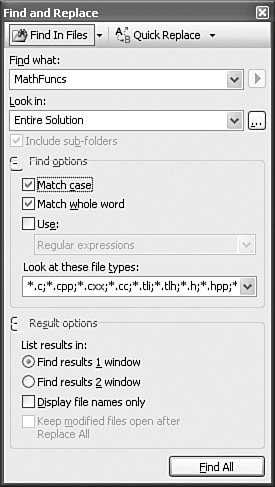
Tip If you elect to use wildcards or regular expressions for your search, there is a tool that can help you to write the correct syntax for the search phrase. If the Use check box is selected, a small button located directly to the right of the Find What drop-down will become enabled. This button will display the expression builder: a fly-out menu of expression syntax choices along with their descriptions. The context of this menu will change depending on whether you have indicated wildcard or regular expressions. Finding Search ResultsAfter you have specified all of the criteria for your search, the Find Next button at the bottom of the search window will launch the search. Any matches within the scope specified will be highlighted for you within the document. Clicking on the Find Next button will move to the next match until there are no more matches found. You also have the option of placing a bookmark against any matches. Just click the Bookmark All button. Replacing TextYou set the Quick Replace mode (see Figure 6.13) by clicking on the rightmost of the two mode buttons (in the same fashion that you set Quick Find mode). The Quick Replace process is virtually identical to Quick Find; a single additional field, used to specify the replacement text, is added to the dialog box. The Find What, Look In, and Find Options fields all remain the same in form and function. Figure 6.13. Quick Replace mode. Two buttons are added to the dialog box to initiate the string replacement: Replace, which will replace the first instance found with the Replace With text, and Replace All, which will replace all instances found with the Replace With text. Note that any replacements made can always be undone via the Undo command under the Edit menu. These two buttons take the place of the Bookmark All button, which is not available in this mode. Note Although a complete discussion of regular expressions is outside the scope of this book, you should note that the Replace With box is capable of supporting tagged expressions. For more information on how you might use this to your advantage during replace operations, consult a regular expression reference manual and look at the MSDN Regular Expressions help topic for Visual Studio. Find In Files/Replace In FilesFigure 6.14 depicts the Find and Replace dialog box in Find In Files mode. The operation of this mode is similar to Quick Find, with a few minor differences. You still have to specify the "what" and the "where" components of the search. And you still can fine-tune your search, although you lose the Search Up and Search Hidden options because they don't make sense for a file-based search. The major differences with this mode are (1) the available search scopes you can specify in the Look In drop-down and (2) the way search results are displayed. Let's look at these two differences in turn. Figure 6.14. Find In Files mode. The search scope is notable in that it allows you to select the entire solution as your search target (in addition to the scopes supported for Quick Find). In addition, notice that you now have a Choose Search Folders button located just to the right of the Look In drop-down. Building Search Folder SetsClicking the Search Folders button will launch a dialog box; this dialog box allows you to build up a set of directories as the scope of the search. You can name this folder set and even set the search order for the directories. Figure 6.15 captures this dialog box as a search set called ClassLibCode is built. You can see that two directories have been added to the set and that you can add more by simply browsing to the folder with the Available Folders control and adding them to the Selected Folders list. Figure 6.15. Building a Search Folder set.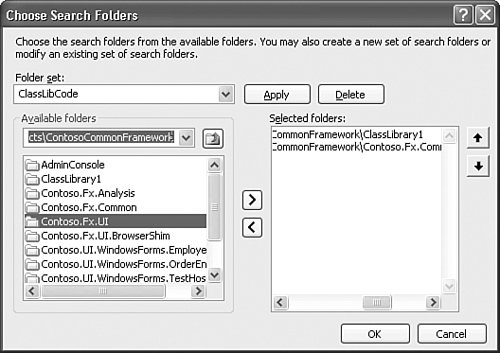 The Find Results WindowWith Quick Find, the search results are simply highlighted (or bookmarked) right within the text editor window. The Find In Files mode will display its search results in a separate, dedicated Find Results window (see Figure 6.16). You can redirect the output to one of two results windows by selecting either the Find Results 1 Window or Find Results 2 Window option at the bottom of the search dialog box. These windows are identical; two options provided here allow you to keep different search results separate and avoid the confusion that the co-mingling of matches would cause if you were constrained to just one output window. Figure 6.16. The Find Results window.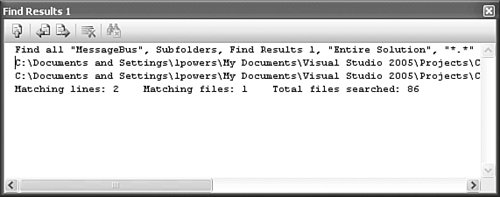 In Figure 6.16 you see the results of a simple search conducted across all of the files in a solution. The interior of the Find Results window provides the following information:
Double-clicking on one of the results lines in the window will jog the cursor location directly to the matching line within the editor. Note that this window has a toolbar. From left to right, the buttons on this toolbar allow you to
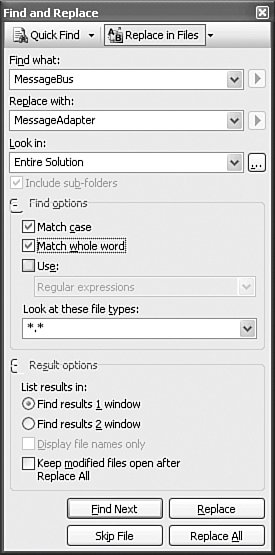
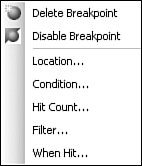
Replacing In FilesThe Replace In Files mode builds from the Find in Files mode by providing all of the same functionality and adding back the ability to cycle through matching results in the Text Editor window. Replace, Replace All, and Skip File buttons also make an appearance in this mode (see Figure 6.17). Figure 6.17. Replace In Files mode. We've already covered the Replace and Replace All functions. Each file that matches the search phrase will be opened in a separate text editor window, and the replacements will be made directly in that window. If performing a Replace All, the replacements will be made and then saved directly into the containing file. You also have the option, via the Keep Modified Files Open after Replace All check box, to have Visual Studio keep any files touched open inside their respective text editors. This allows you to selectively save or discard the replacements as you see fit. You can elect to skip files during the search-and-replace process by using the Skip File button. This button is available only if more than one file has been selected as part of the search scope. Clicking this button tells the search engine to skip the current file being processed and continue with the next in-scope file. Find SymbolThe last search mode supported by the Find and Replace dialog box is called Find Symbol. It is used to search out lines of code in which a symbol is defined, referenced, or used. This tighter search scope makes this the preferred mechanism for, say, finding all places where a class called CustomAnalyzer is referenced. You could use the other Find modes to locate this text, but the Find Symbol algorithm's tighter scope is much more relevant to this kind of search because it will not rove over any non-symbol text in the document. In addition, the Find Symbol function uses reflection and the compiler to find symbol references; this is not a simple text search with a different scope. The Find Symbol search also has two other distinguishing characteristics over the normal Find/Replace. It is able to search external components even in the absence of source code. As an example, you can opt to select .NET Framework in the Look In drop-down. Figure 6.18 shows the results of searching for the String symbol in the framework itself. Figure 6.18. Find Symbol Results window.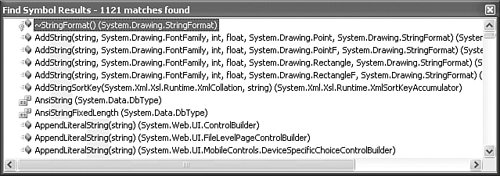 The second difference with Find Symbol is the capability to immediately jump to a referenced object's definition or browse its definition using the object browser. You can access both of these functions, Go To Definition and Browse Definition, by right-clicking on any of the matches displayed in the results window. Note If you are searching for a symbol within a library where you do not have access to the source code, the option to view the symbol's definition in source (for example, Go To Definition) will obviously not be available. However, you can still leverage the Browse Definition function to instantly pull the definition open in the object browser. It turns out that this is a great way to understand and explore libraries not of your own creation. Incremental SearchIncremental Search functions without the aid of a dialog box. With a text editor open, select Edit, Advanced, Incremental Search (or press Ctrl+I). While Incremental Search is active, you will see a visual pointer cue composed of binoculars and a down arrow. If you start typing a search string, character-by-character, the first match found will be highlighted within the text editor window itself. With each successive character, the search string is altered and the search itself is re-executed. The current search string is displayed on the Visual Studio status bar. Figure 6.19 illustrates an Incremental Search in progress; the characters M E S S A have been entered, and you can see the first match flagged within the text editor. Figure 6.19. Incremental search.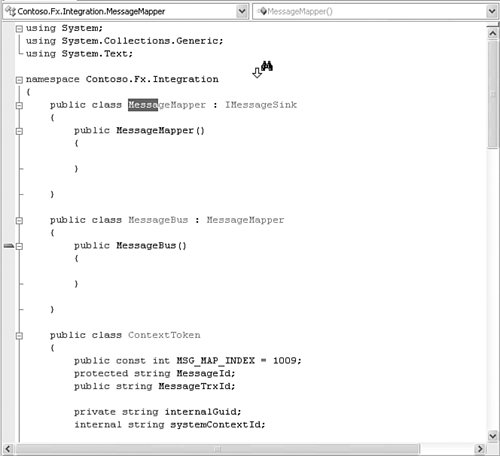 By default, the search function works from the top of the document to the bottom, and from left to right. You can reverse the direction of the search by using the Ctrl+Shift+I key combination. To jump to the next match within the document, use the Ctrl+I key combination. Clicking anywhere within the document or pressing the Esc key will cancel the incremental search. Note Incremental searches are always performed in a manner that is not case sensitive and will always match on substrings. Debugging in the Text EditorThe text editormore specifically, the code editorhas several interactive features that facilitate with the code debugging process. Debugging activities within the text editor primarily center on breakpoints and runtime code control. We will cover general Visual Studio debugging in greater detail in Chapter 9. A breakpoint is simply a location (for example, line of code) that is flagged for the debugger; when the debugger encounters a breakpoint, the currently executing program is paused immediately prior to executing that line of code. While the program is in this paused state, you can inspect the state of variables or even affect variable state by assigning new values. You can also interactively control the code flow at this point by skipping over the next line of code or directly to another line of code and continuing from thereall of this without actually leaving the IDE. Setting a BreakpointTo set a breakpoint using the code editor, first locate the line of code you want to pause on and then click on that line of code within the indicator margin. This will set the breakpoint, which can now be visually identified by a red ball in the indicator margin. Hovering over the breakpoint indicator margin will show a ToolTip indicating some basic information about that breakpoint: the code filename, the line number within that code file, the type you are in (if any), and line number within that type. In Figure 6.20, a breakpoint has been set within a class called MessageMapper. The ToolTip information shows that you are on line 3 in the MessageMapper type, but within the overall code file (Integration.cs), you are on line number 9. Figure 6.20. Setting a breakpoint.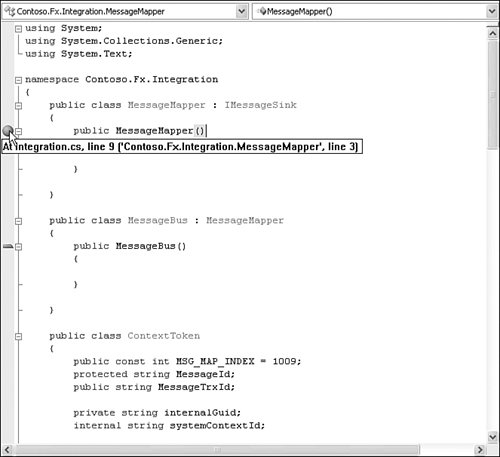 Clicking on the breakpoint again will remove it. The breakpoint we have set is a simple one in that it will suspend the program on that line of code without regard for any other variable or factor. Simple breakpoints are, however, only the tip of the iceberg. Breakpoints support an extensive set of conditions used to fine-tune and control what will actually trigger the breakpoints. For instance, you can set a breakpoint to activate the state of a variable or the number of times program execution will "hit" the breakpoint. You also can configure conditional breakpoints by simply pointing and clicking within the code editor window. Configuring a BreakpointRight-clicking on the breakpoint indicator will reveal the context menu (see Figure 6.21) for configuring the breakpoint. Figure 6.21. Configuring a breakpoint. It is from here that you can indicate special conditions for triggering the breakpoint and even disable or enable the breakpoint. Disabling the breakpoint, rather than deleting it, keeps its location intact if you ever need to re-enable it. Tip Visual Basic actually provides a command word that allows you to programmatically trigger a breakpoint within your code. The Stop statement, like a breakpoint, will suspend execution of the executing code. This capability is useful when you're running the application outside the IDE. Any time a Stop statement is encountered during runtime, the Visual Studio debugger will launch and attach to the program. Controlling the Flow of Running CodeWhen a program is run within the IDE, it will continue along its path of execution through the code base until it hits a breakpoint or Stop statement, is paused manually, or terminates either by reaching the end of its code path or by a manual stop. Tip The VCR-like controls and their shortcut keys (available under the Debug menu or on the Debug toolbar) are, by far, the easiest way to start, pause, or stop code within the IDE. When a breakpoint is hit, the code editor will visually indicate the line of code where execution has paused. Figure 6.22 shows a slightly modified version of the "Hello, World" program, suspended at a breakpoint. A yellow arrow in the indicator margin flags the next statement that will execute when you resume running the program. In this case, because the breakpoint is also here, the next statement indicator appears in the margin embedded within the breakpoint glyph. Figure 6.22. Stopping at a breakpoint.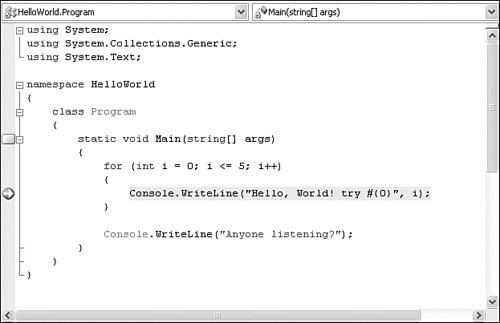 When execution is paused, you may change the next line of code to be executed. By default, of course, this will be the line of code where operations were paused (recall that execution stops just prior to running the line of code matched with the breakpoint). But you can manually specify the next line of code to run by right-clicking on the target line and then selecting Set Next Statement. In Figure 6.23, this feature has been used to jump out of the WriteLine loop. Normal flow through the code has been circumvented, and instead of continuing to spin through the for loop, the program will immediately execute the line of code just after the loop. You can see the arrow and highlighting, which show that the next line of code and the breakpoint are no longer at the same location within the code file. Figure 6.23. Setting the Next Run Statement.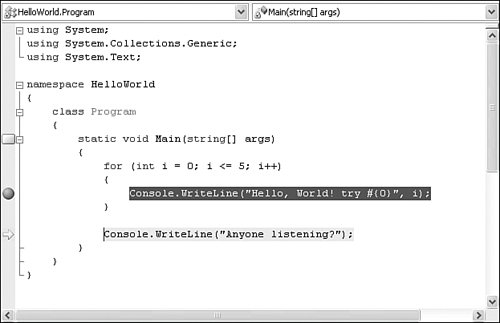 You can also create a sort of virtual breakpoint by selecting Run To Cursor from the editor's context menu. This will cause the program to run until it hits the line of code that you have selected, at which point it will pause much as if you had set a breakpoint there. Printing CodeTo print the current text editor's contents, select Print from the File menu. The Print dialog box is fairly standard, allowing you to select your printer and set basic print properties. Two Visual Studiospecific options bear mentioning here. The Print What section in this dialog box controls whether line numbers will be produced in the printout and whether collapsed regions will be included in the printed content. Colors and FontsBy default, the font colors and markup that you see in the text editor window will be sent to the printer as is (assuming that you are printing to a color printer). If you so desire, you can tweak all these settings from the Fonts and Colors page in the Options dialog box (see Figure 6.24). Figure 6.24. The Fonts and Colors Options dialog box.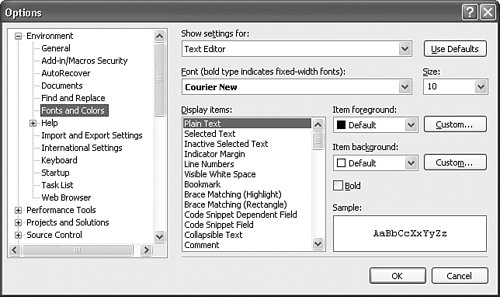 This is the same dialog box used to control font and color settings for many of the IDE's constituent parts. You access the printer settings by selecting Printer in the Show Settings For drop-down at the top of the dialog box. Figure 6.25 provides a snapshot of output produced by printing a code file. Figure 6.25. Code printout.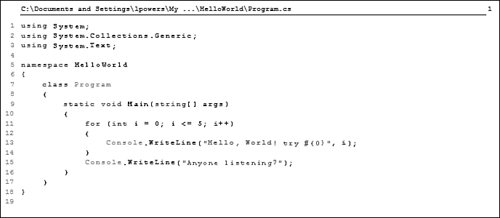 Using the Code Definition WindowThe code definition window is a "helper" window that works in close conjunction with the code editor window by displaying definitions for symbols selected within the code editor. It is actually a near clone of the code editor window, with one big exception: It is read-only and does not permit edits to its content. The code definition window content is refreshed any time the cursor position is moved within the code editor window. If the cursor or caret is placed in a symbol/type, the code definition window will show you how that symbol is defined. Figure 6.26 shows an open code editor and a code definition window; the cursor in the editor is positioned on an internal field, _state, defined within the class InternalToken. Figure 6.26. The code definition window.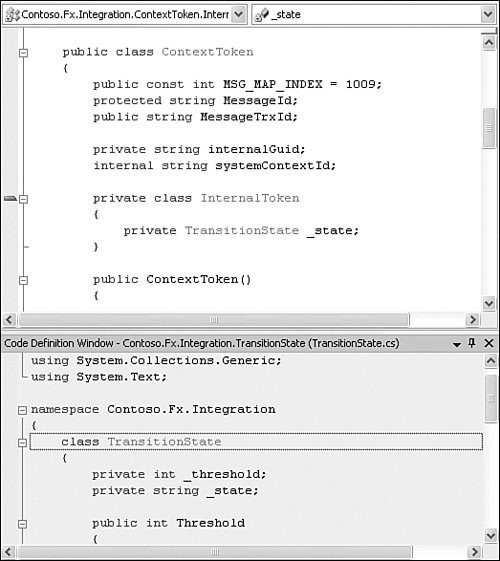 The code definition window has reacted to the cursor position by showing the source code that actually defines the type of the _state field. You can see from the figure that the code definition window is a fairly featured adaptation of a text editor window: It supports bookmarks, breakpoints, and various navigation aids. Although you cannot edit code using this window, you are not prevented from copying code out of the window. |
EAN: 2147483647
Pages: 195